パッケージ、リポジトリ、アプリカテゴリを検索

flutter_echarts のカバー
パッケージ詳細v2.5.0

flutter_echarts

Apache ECharts をベースにしたデータ可視化チャートライブラリで、WebGL 3D、GISマップなどの高度なチャートを構築できます。

AndroidiOSmacOS
30日間ダウンロード
5490
いいね数
578
Pub ポイント
130

パッケージをインストール

flutter pub add flutter_echarts

パッケージ概要

公開情報に基づく選定ガイドです。参考としてご利用ください。

flutter_echarts は Apache ECharts をベースにした強力なデータ可視化ライブラリです。WebGL 3D ビジュアライゼーションやインタラクティブな GIS マップなどの高度なチャートを作成できるようにします。このパッケージは Android、iOS、macOS など複数のプラットフォームをサポートしており、Flutter アプリ内での豊富でダイナミックなチャート機能を提供します。シンプルな pub コマンドによるシームレスな統合により、高性能で機能豊富なデータ表現を必要とするアプリケーションに最適です。

用途

  • インタラクティブダッシュボード
  • 地理空間データマッピング
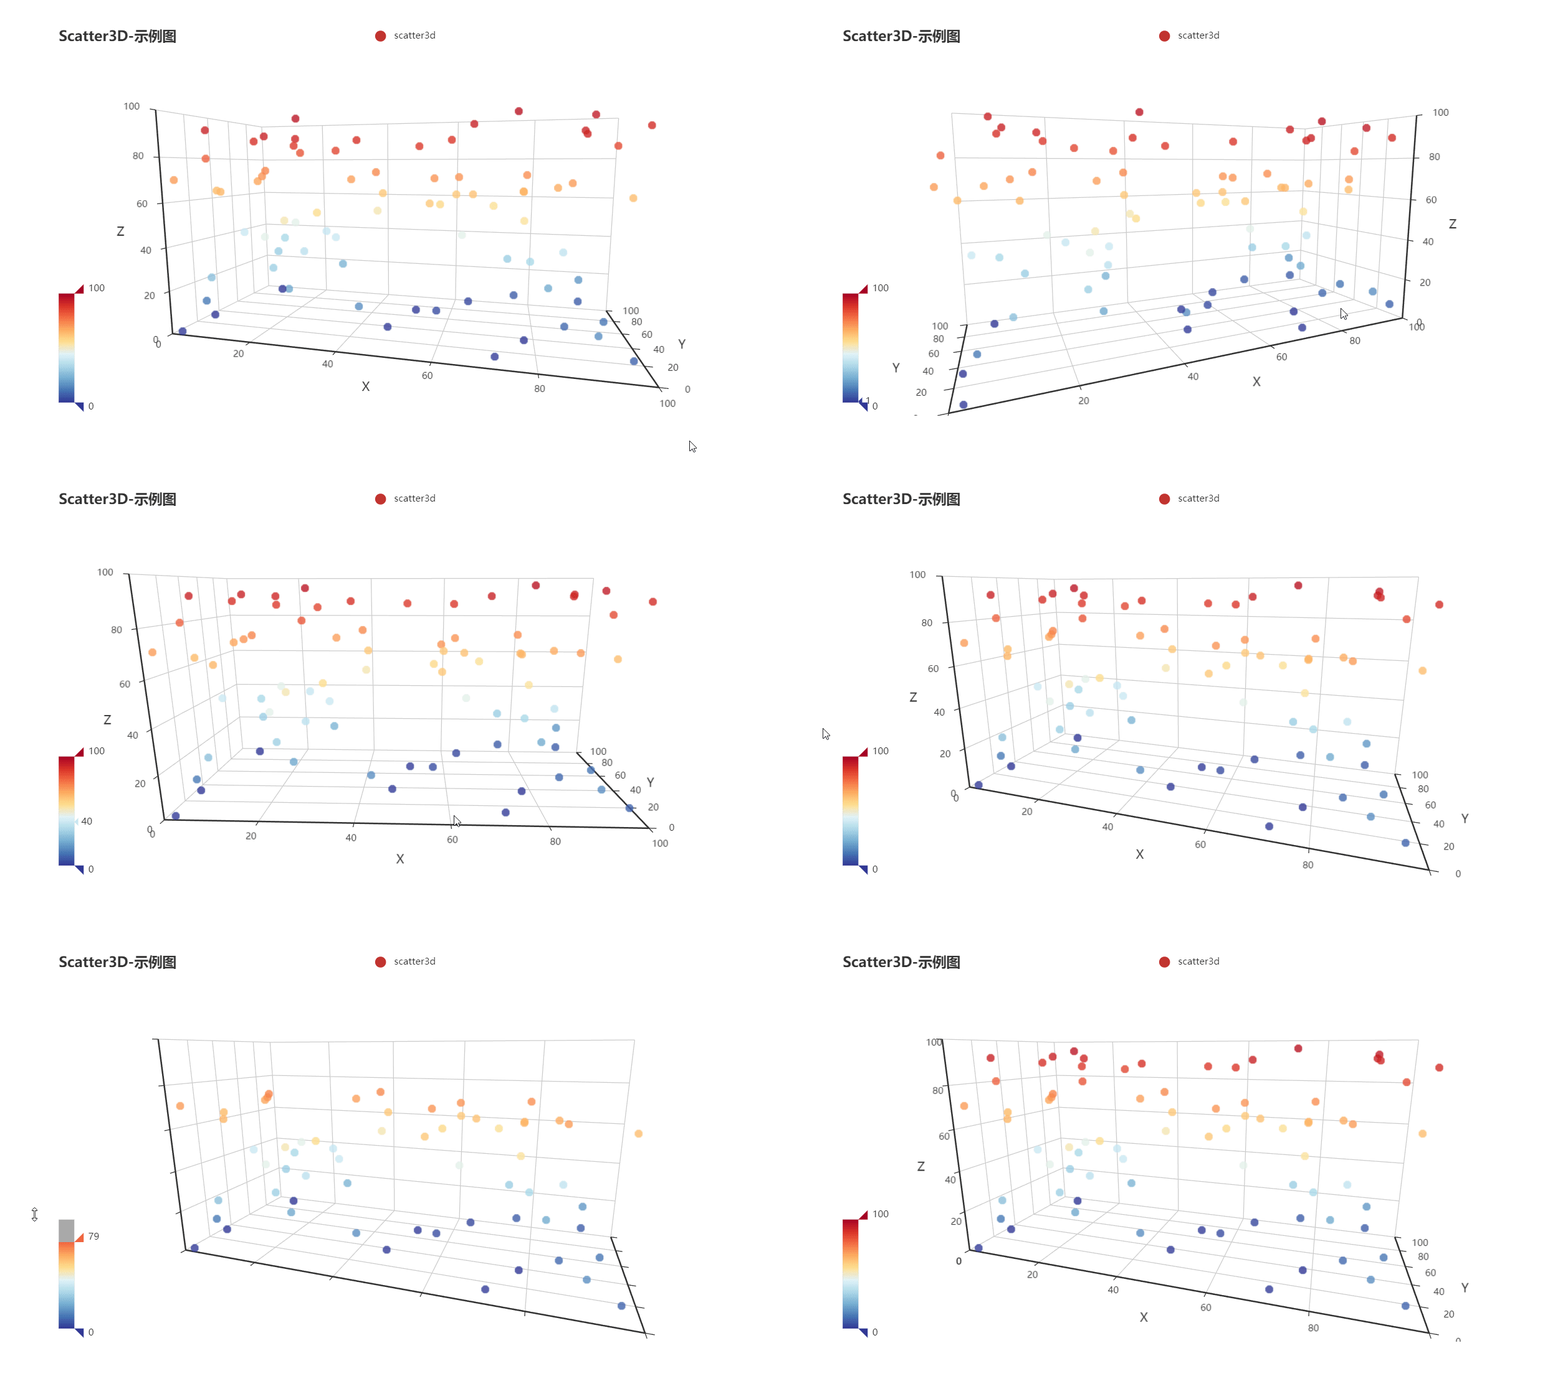
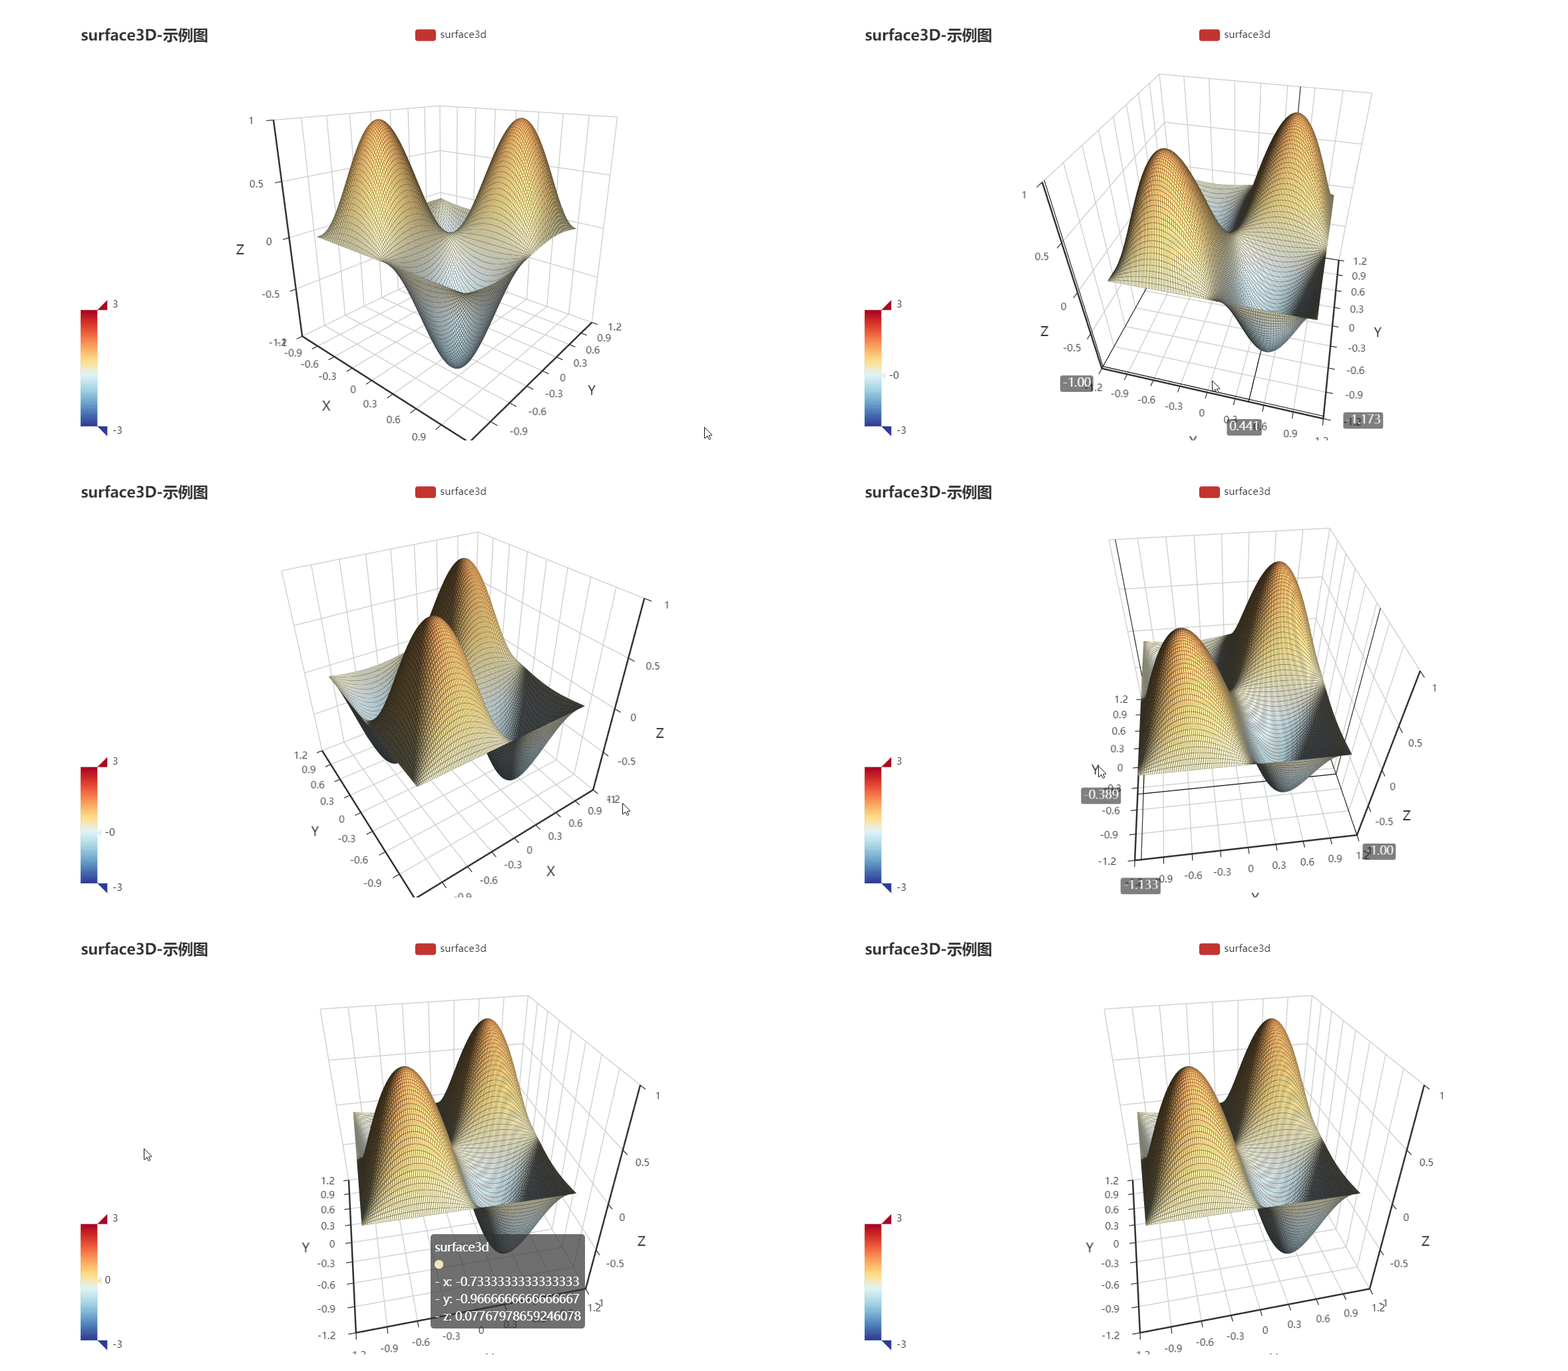
  • 3Dデータの可視化
  • リアルタイム分析表示
  • モバイルアプリにおける複雑なチャートレンダリング

主な機能

  • WebGL 3D チャートをサポートしています
  • 組み込みGISマップ統合
  • 高パフォーマンスレンダリング
  • クロスプラットフォーム互換性
  • 豊富なチャートタイプ

適している対象

  • データ集約型アプリケーション
  • 分析プラットフォーム
  • モバイルGISツール
  • エンジニアリングおよび科学アプリ
  • エンタープライズダッシュボード開発

注意事項

  • ECharts の設定について理解が必要
  • バンドルされたアセットのため、アプリサイズが増加する可能性があります
  • パフォーマンスはデバイスのハードウェアに依存します
  • 制限されたネイティブFlutterウィジェット統合
  • 初心者には学習曲線が急峻です

元の README

関連するソースリポジトリの README 原文のスナップショットです。最新の内容はリポジトリをご覧ください。

Archiving Note

After many years, this project, as a transitional solution using Webview, has completed its historical mission and is therefore being archived. We recommend Graphic or other native chart libraries as alternatives.

中文

*A Flutter widget to use [Apache ECharts](https://github.com/apache/incubator-echarts) in a reactive way.*

Features

Reactive Updating

The most exciting feature of Flutter widgets and React components is that the view can update reactively when data changes. Thanks to ECharts' data driven architecture, flutter_echarts implements a reactive way to connect charts with data. The charts automatically re-render when data in the option property changes.

Two Way Communication

The onMessage and extraScript properties provide a way to set two-way event communication between Flutter and JavaScript.

Configurable Extensions

ECharts has a lot of extensions. The extensions property allows you to inject the extension scripts as raw strings. In this way, you can copy these scripts to your source code without being confusing by assets dirs.

Installing

Add this to your package's pubspec.yaml file:

dependencies:
  flutter_echarts: #latest version

Now in your Dart code, you can use:

import 'package:flutter_echarts/flutter_echarts.dart';  

Details see pub.dev.

Usage

The flutter_echarts package itself is very simple to use, just like a common statelessWidget:

Details about the option object is in the Echarts docs or Echarts examples.

Container(
  child: Echarts(
  option: '''
    {
      xAxis: {
        type: 'category',
        data: ['Mon', 'Tue', 'Wed', 'Thu', 'Fri', 'Sat', 'Sun']
      },
      yAxis: {
        type: 'value'
      },
      series: [{
        data: [820, 932, 901, 934, 1290, 1330, 1320],
        type: 'line'
      }]
    }
  ''',
  ),
  width: 300,
  height: 250,
)

See the full flutter_echarts_example.

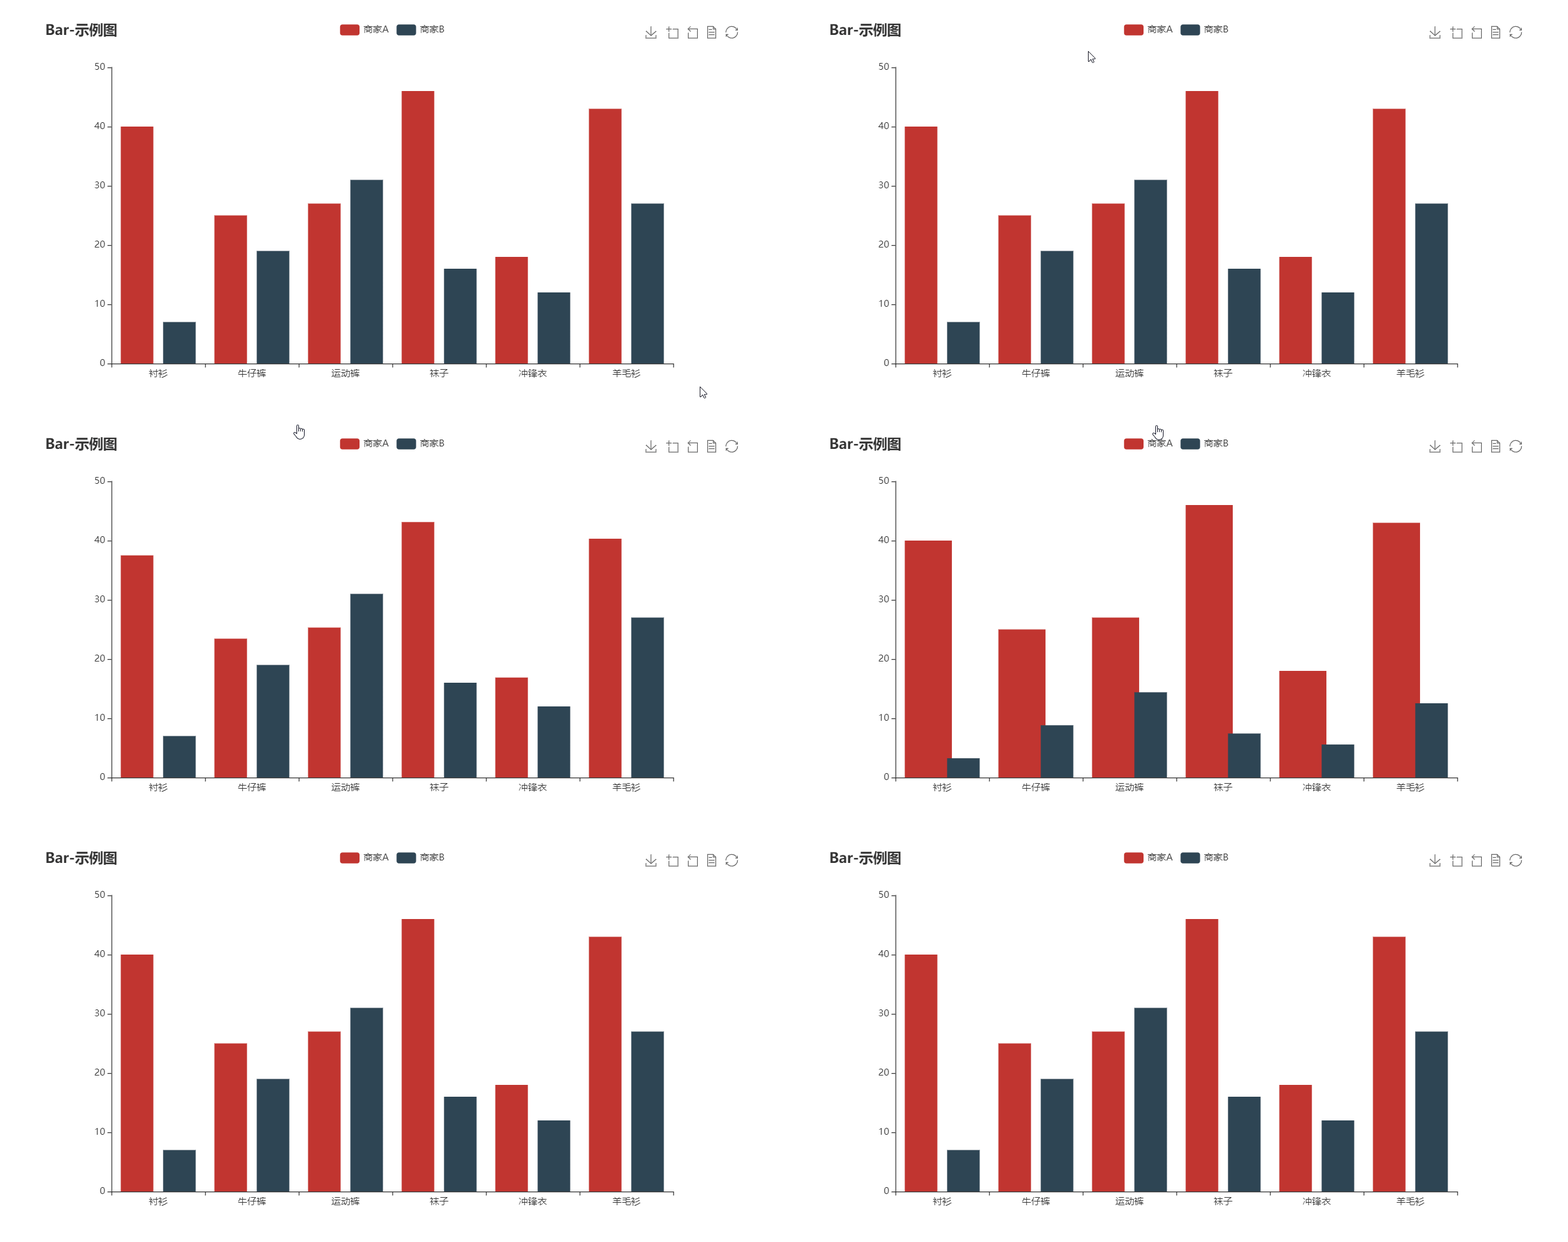
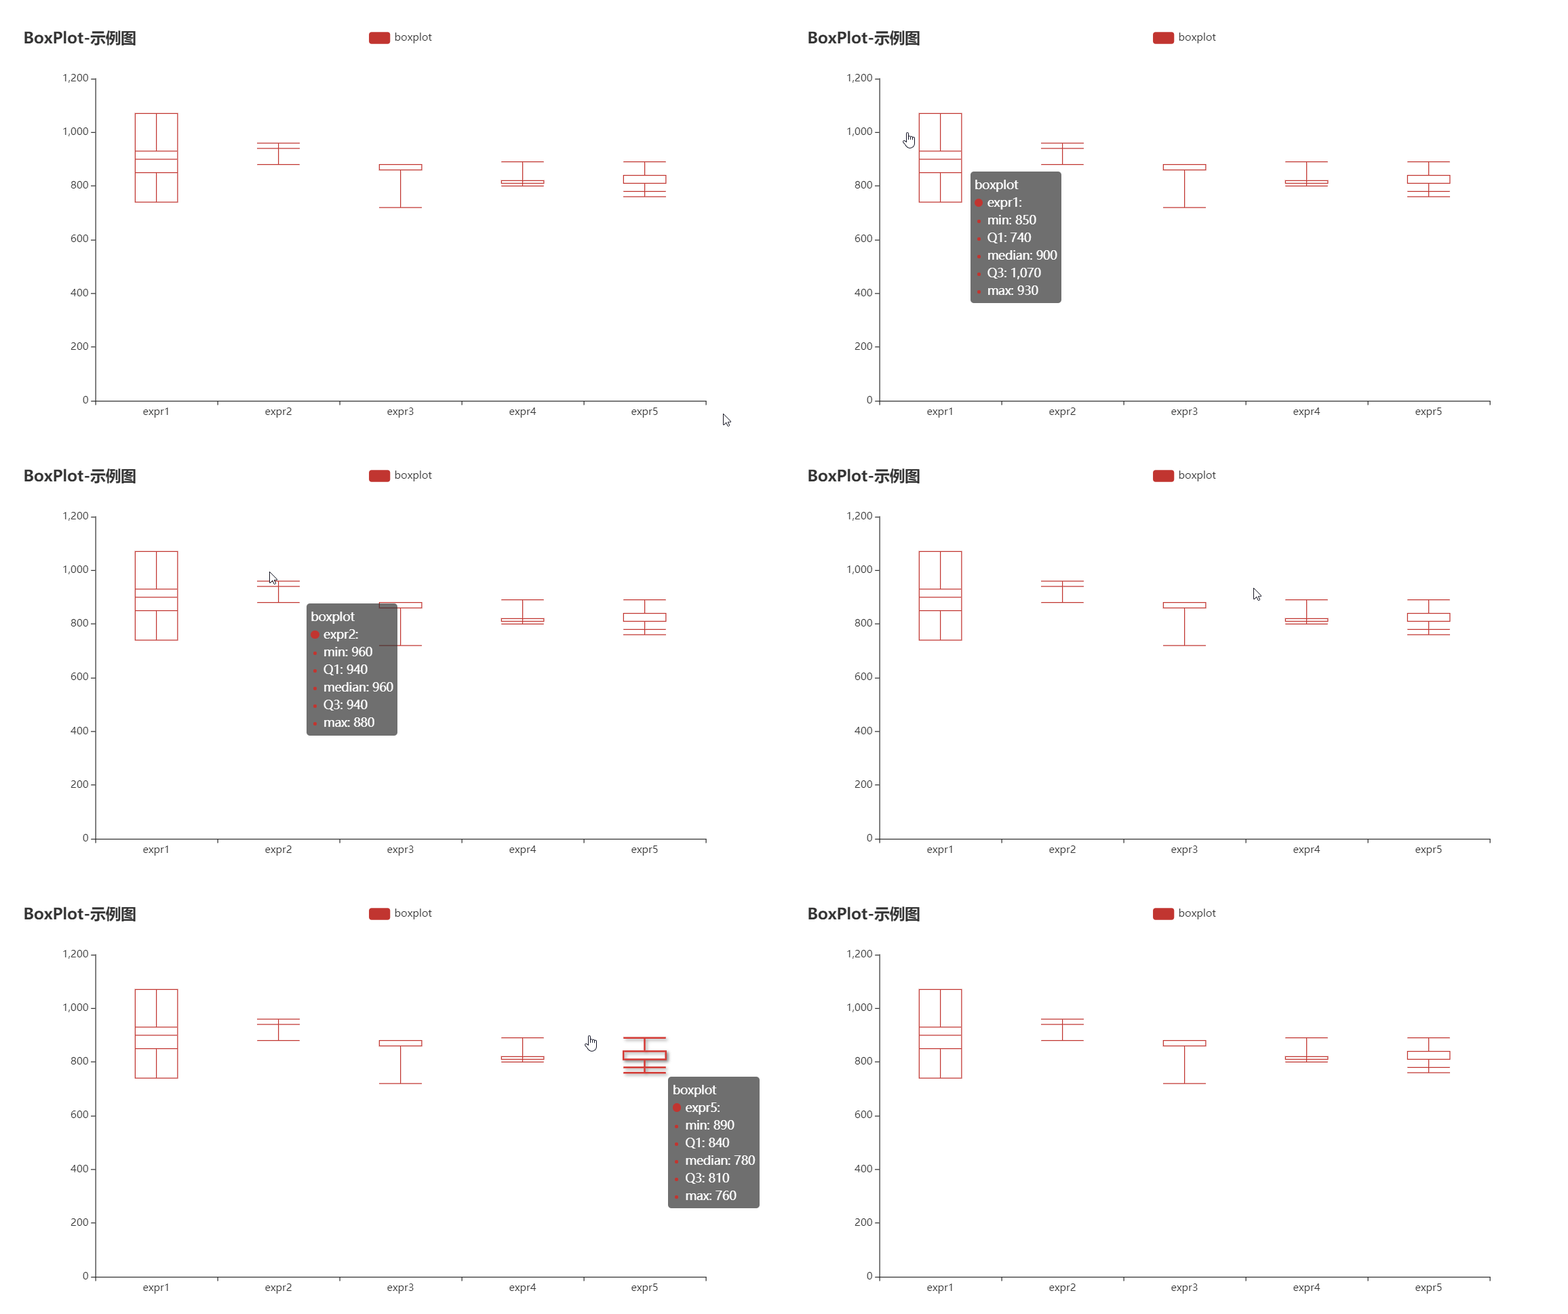
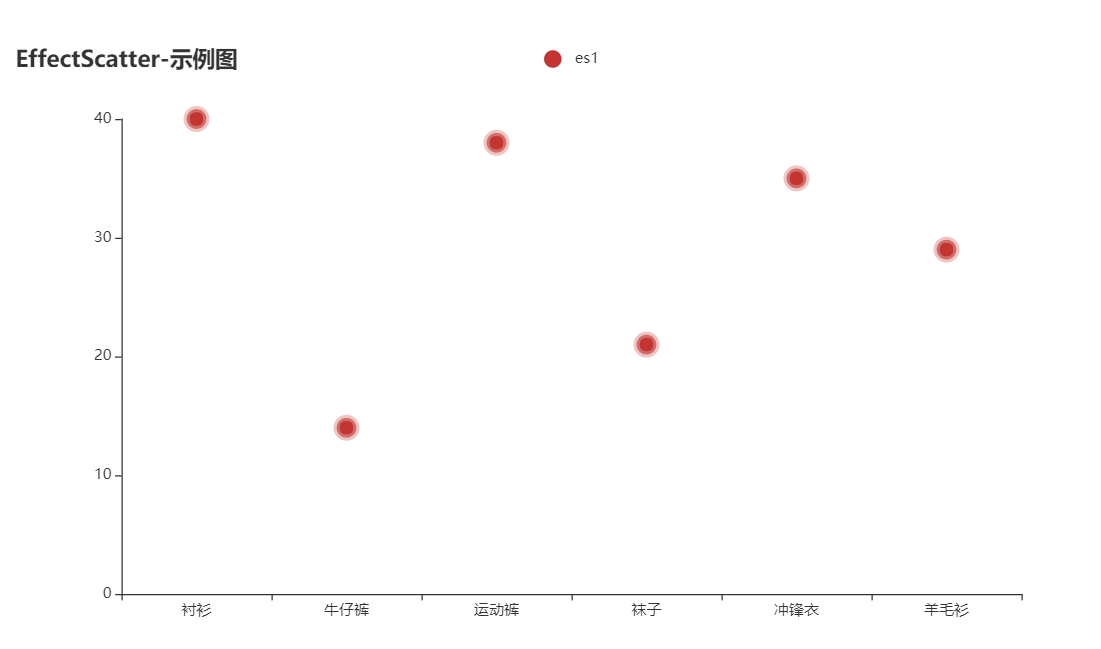
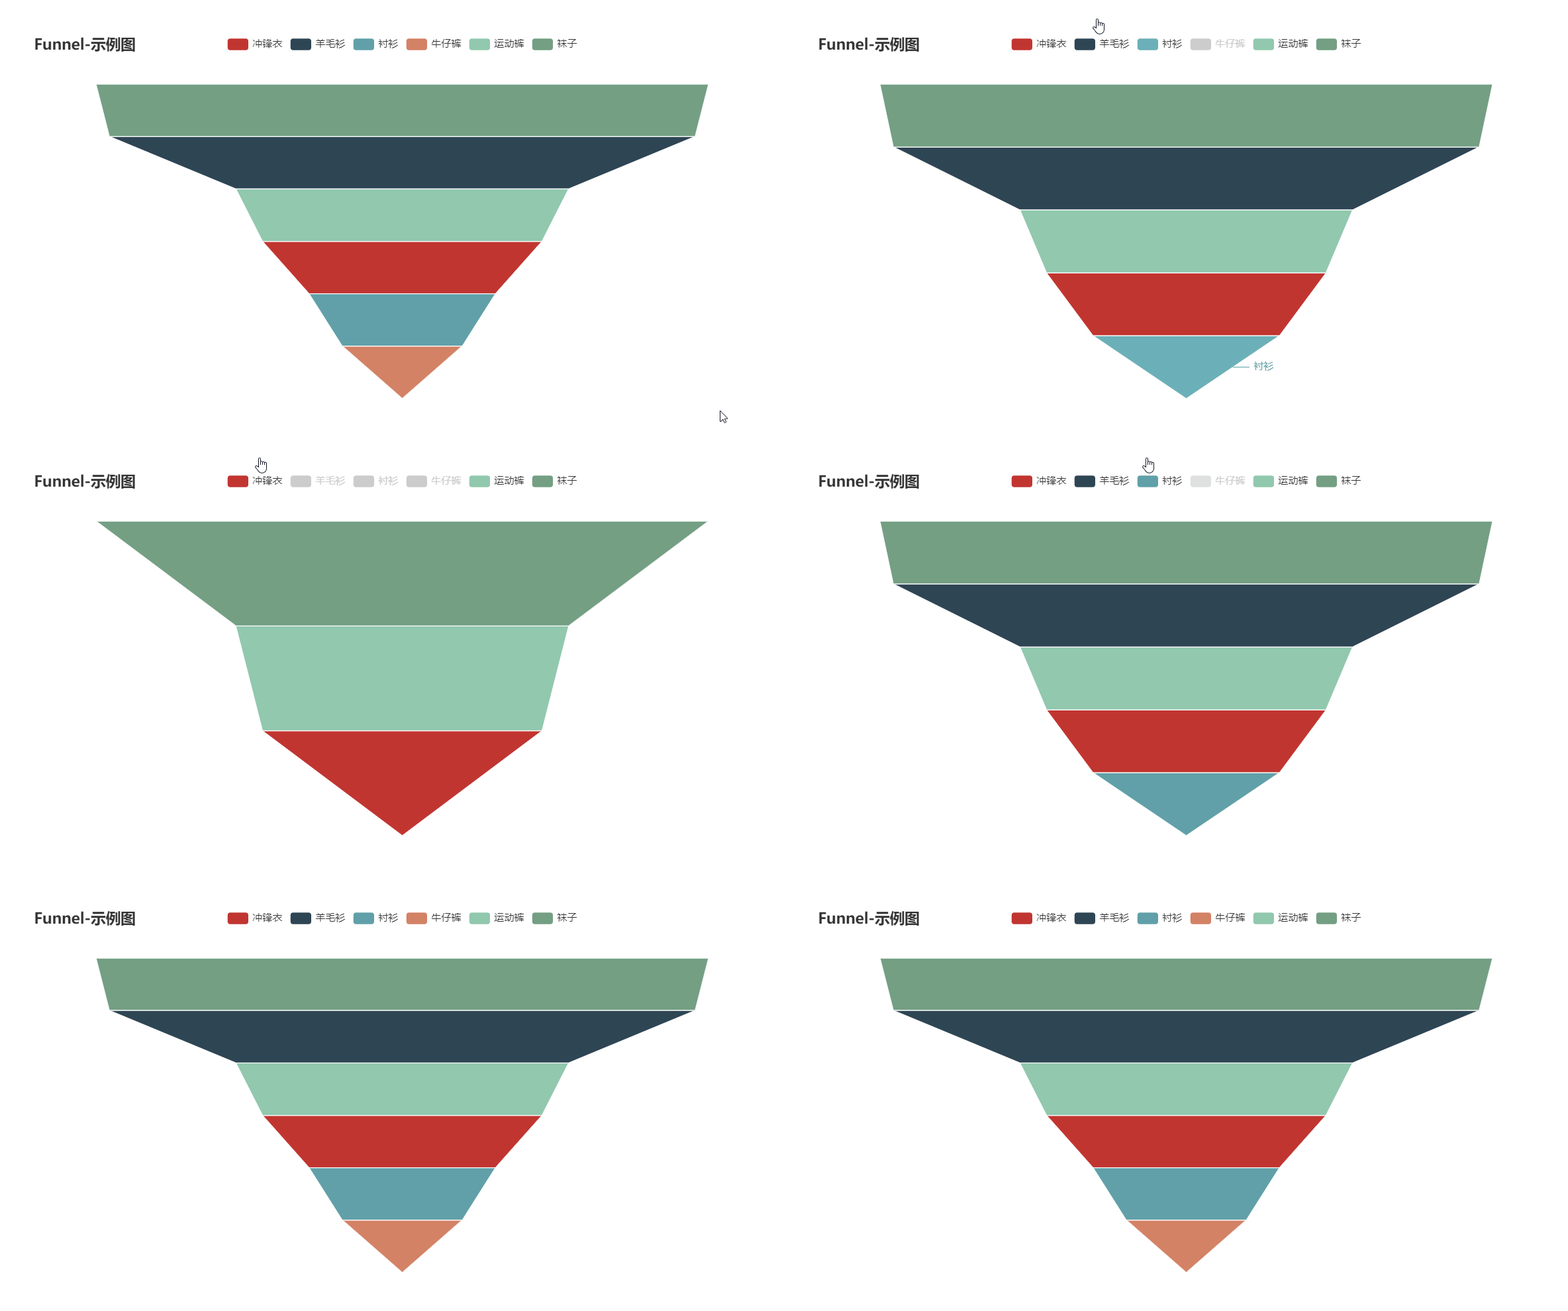
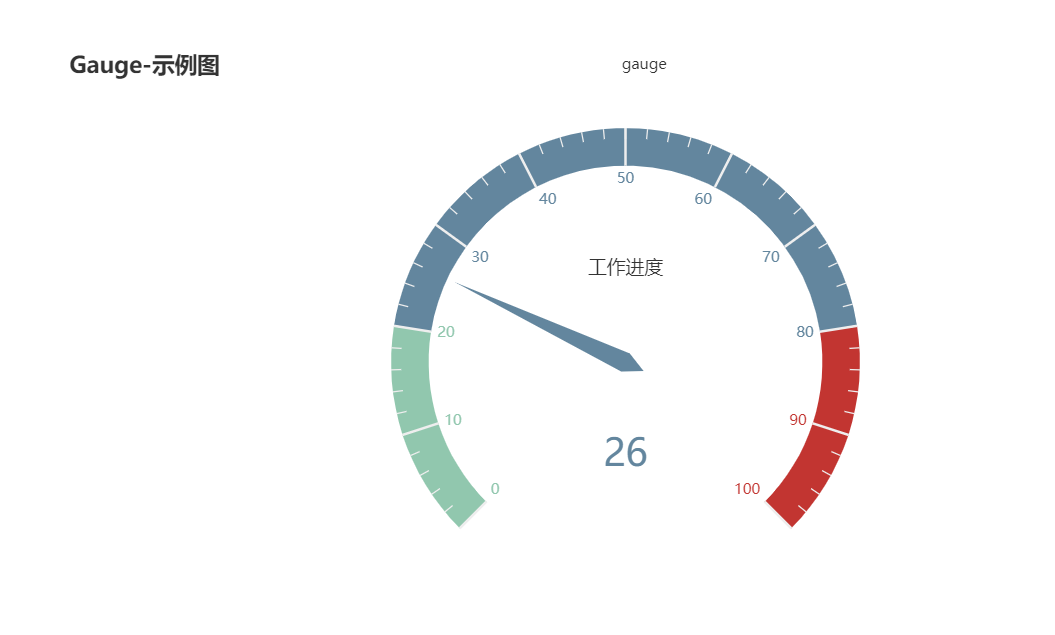
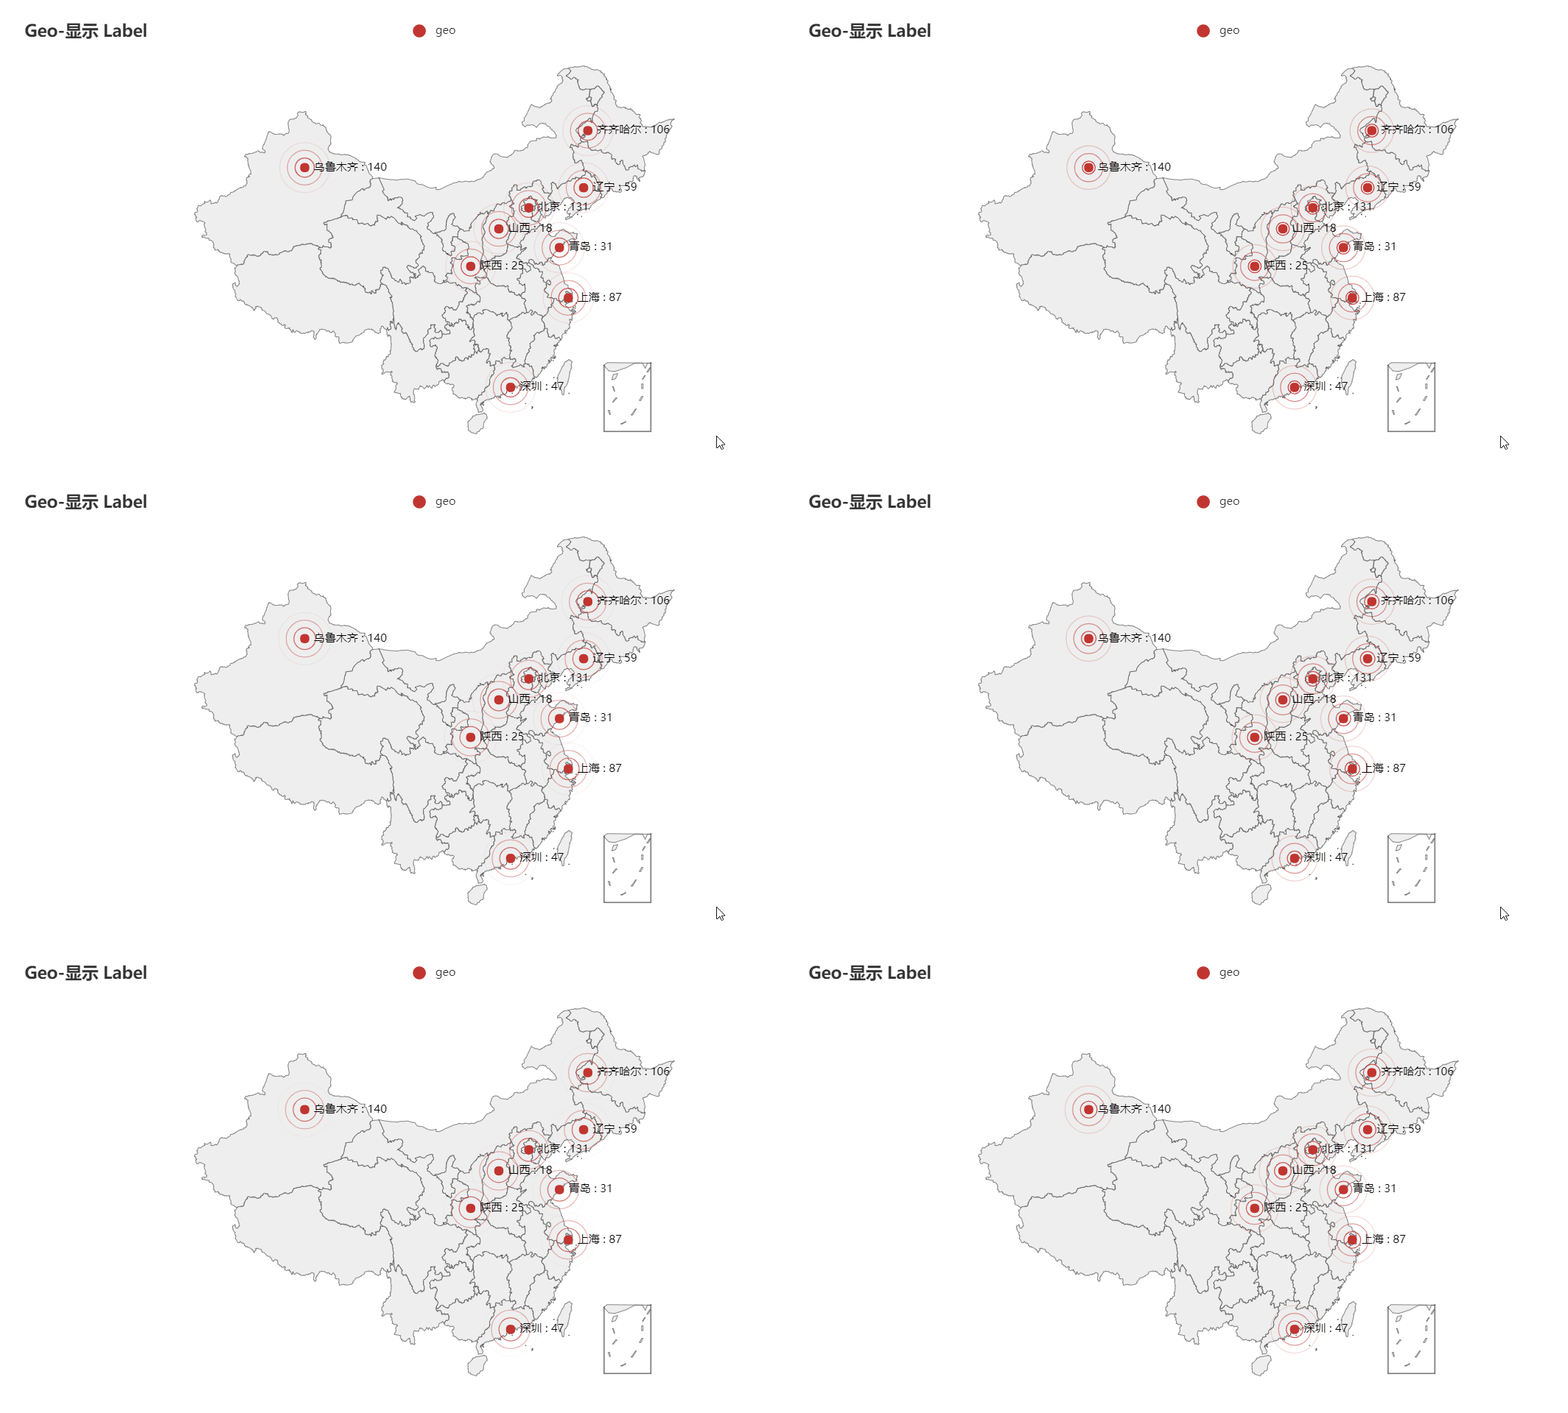
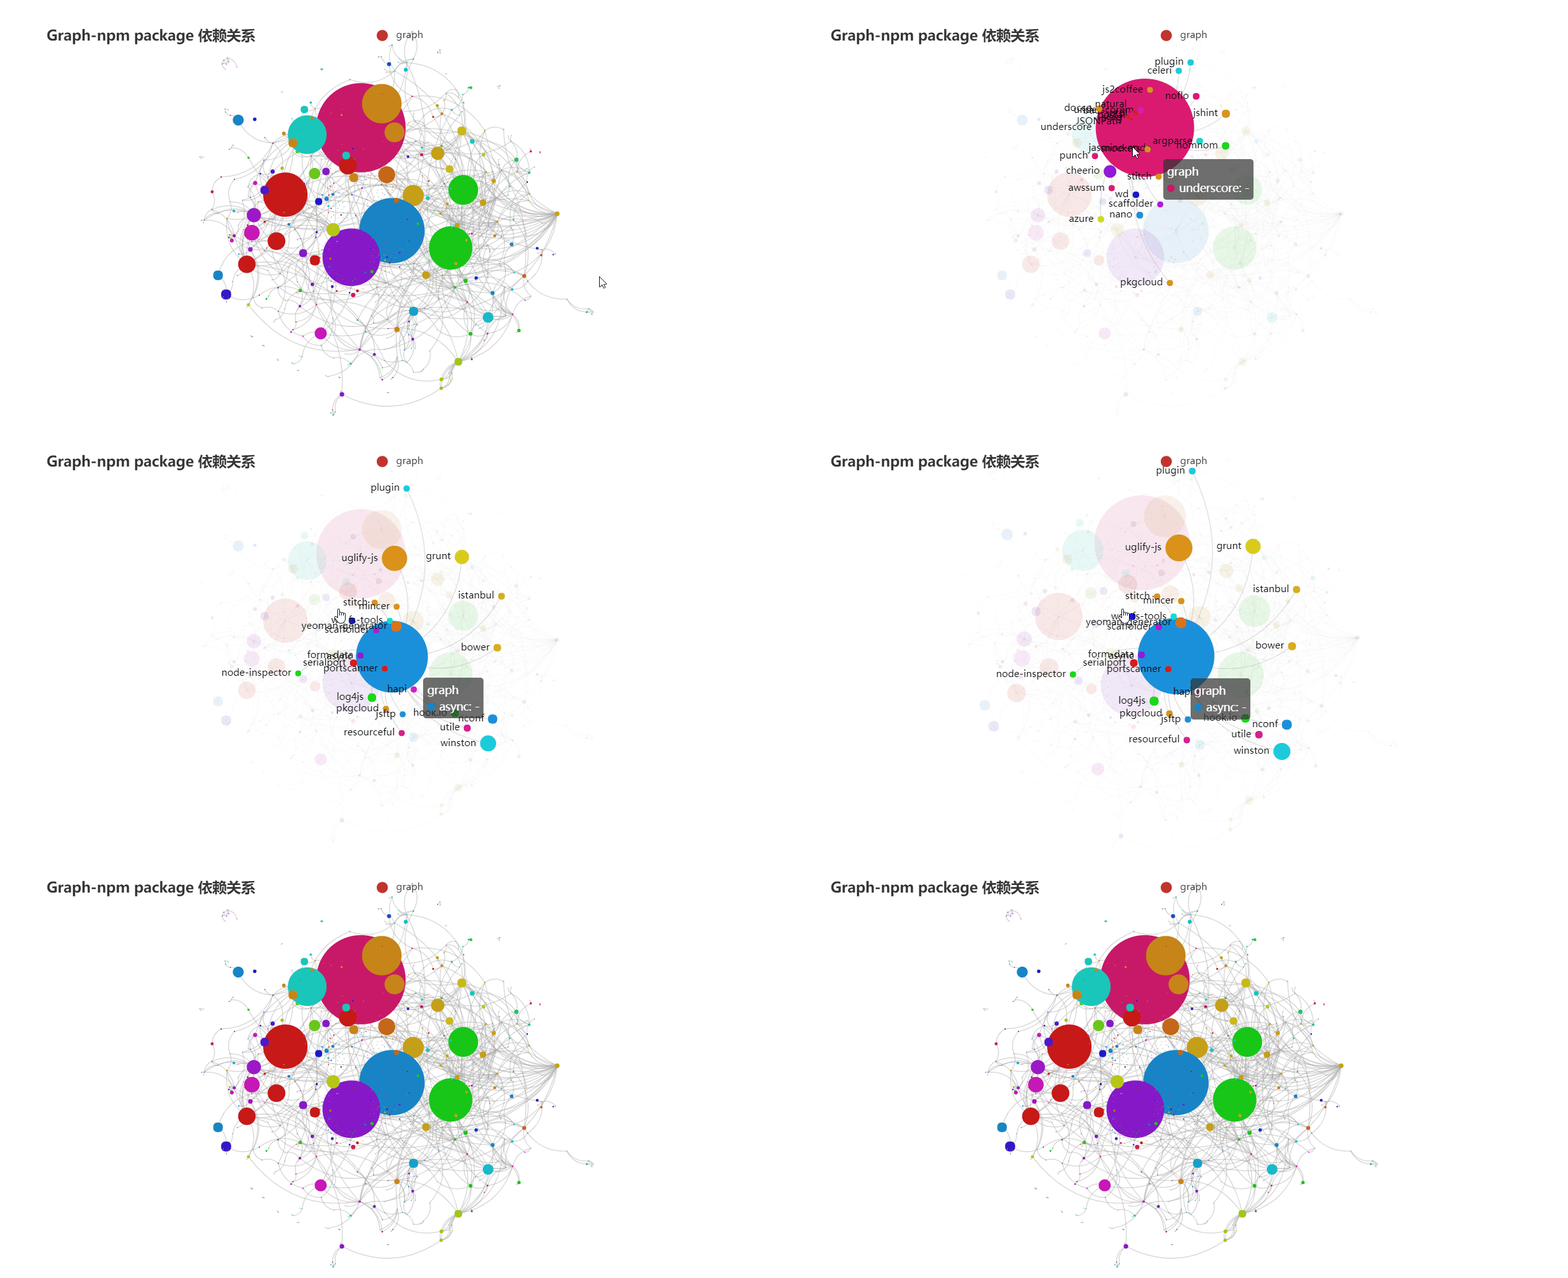
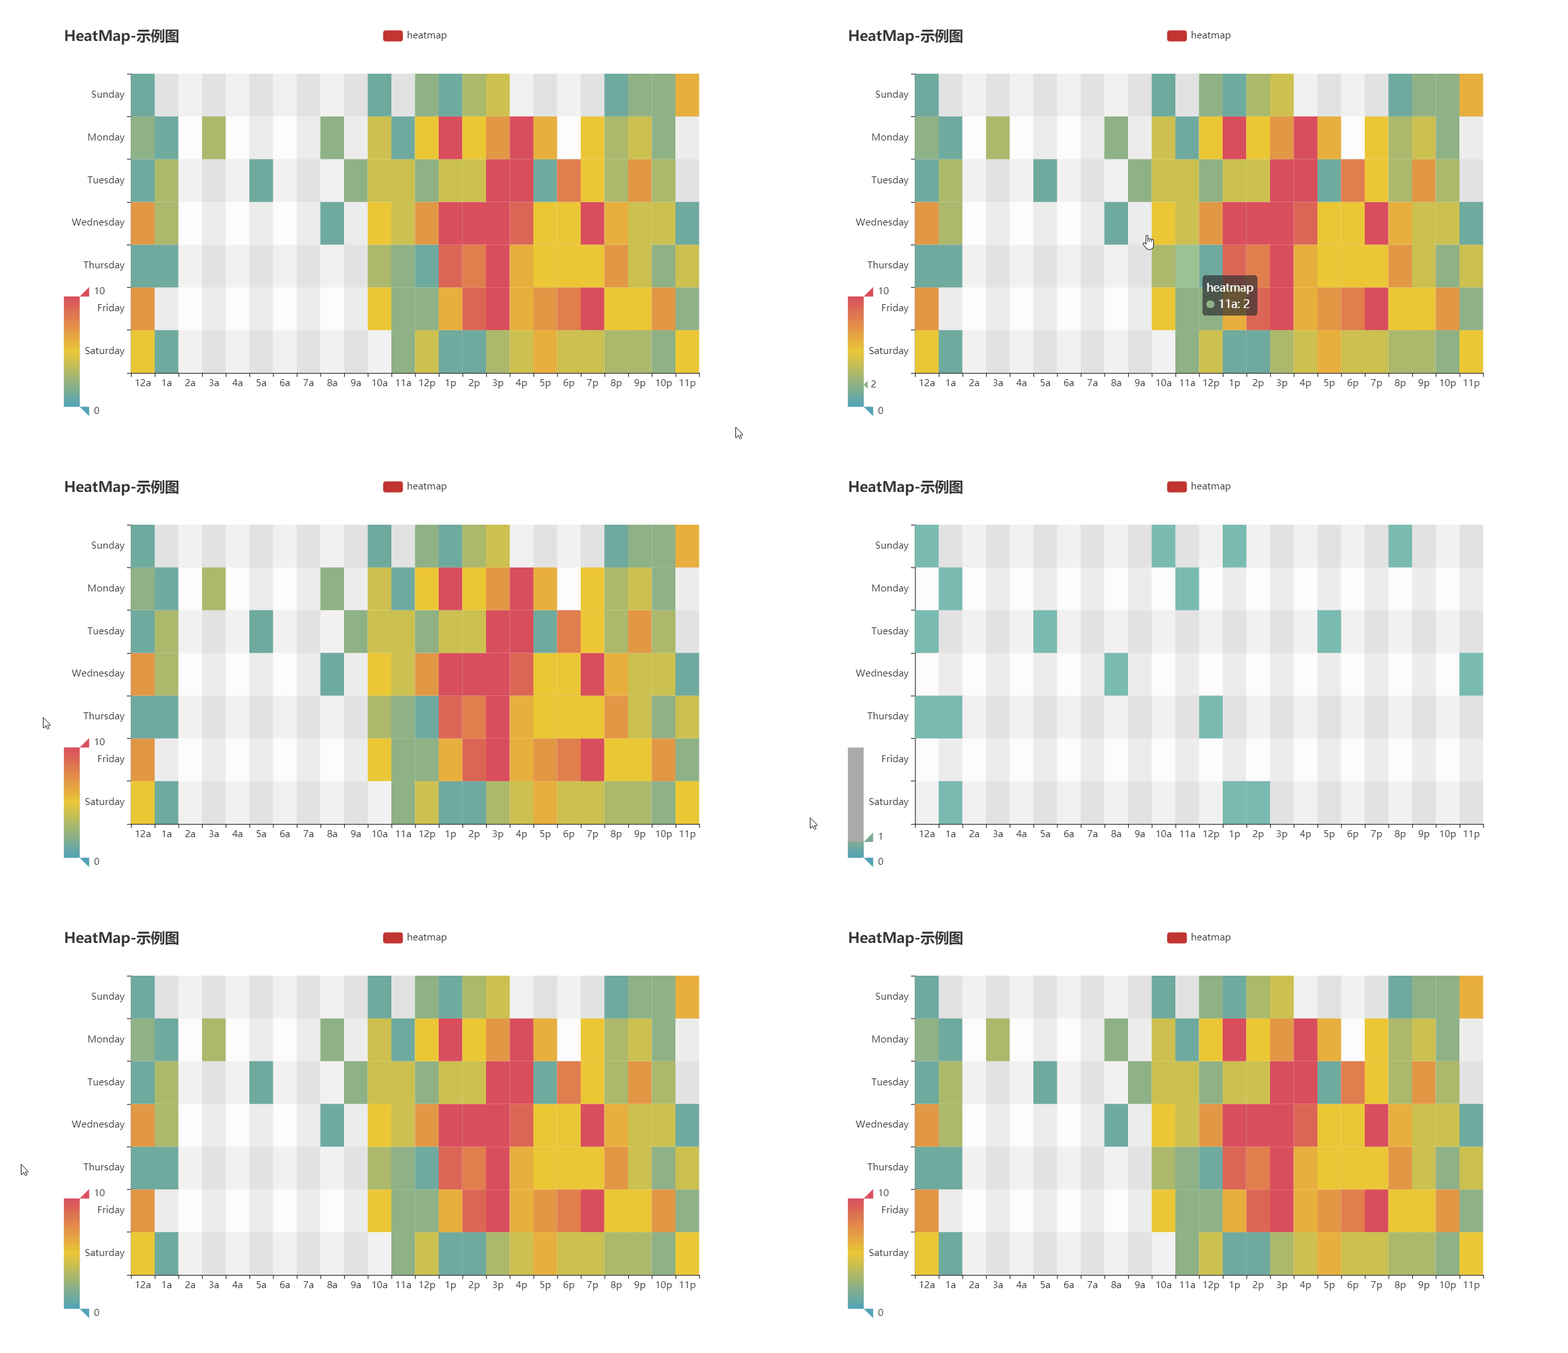
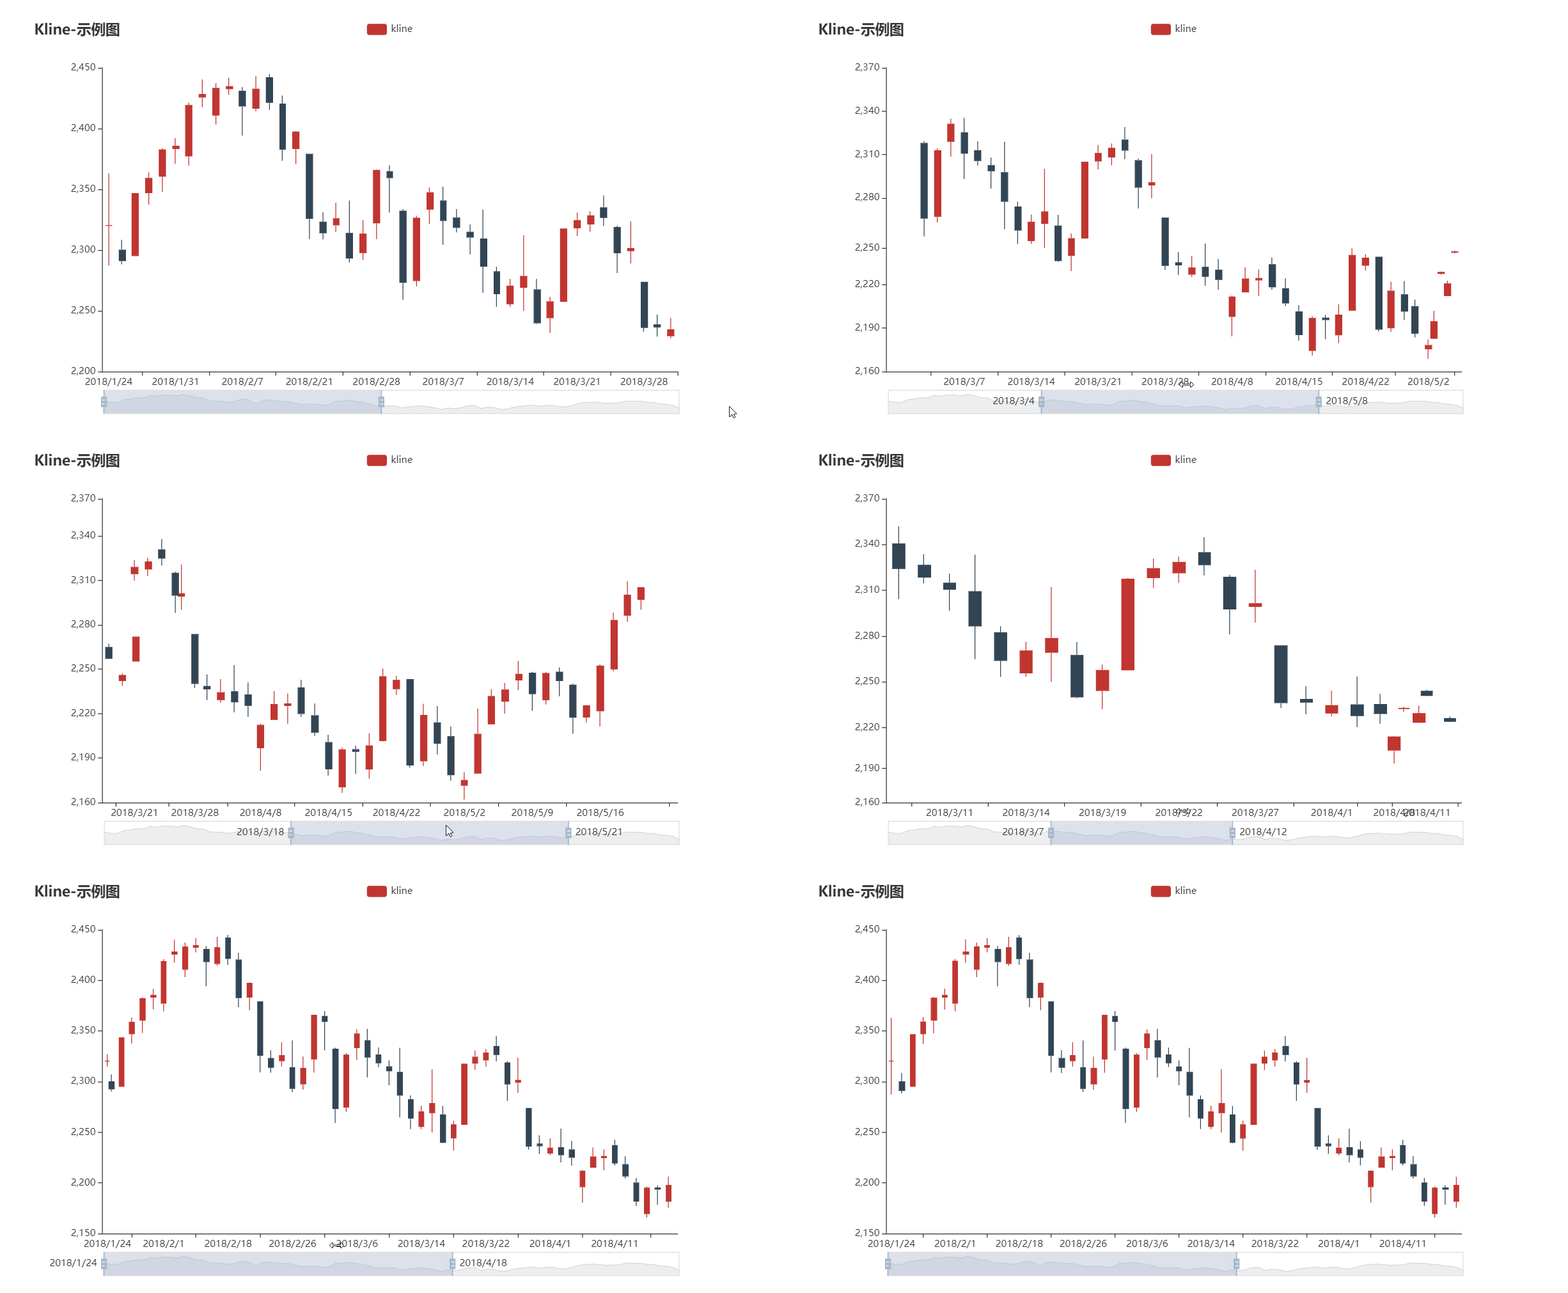
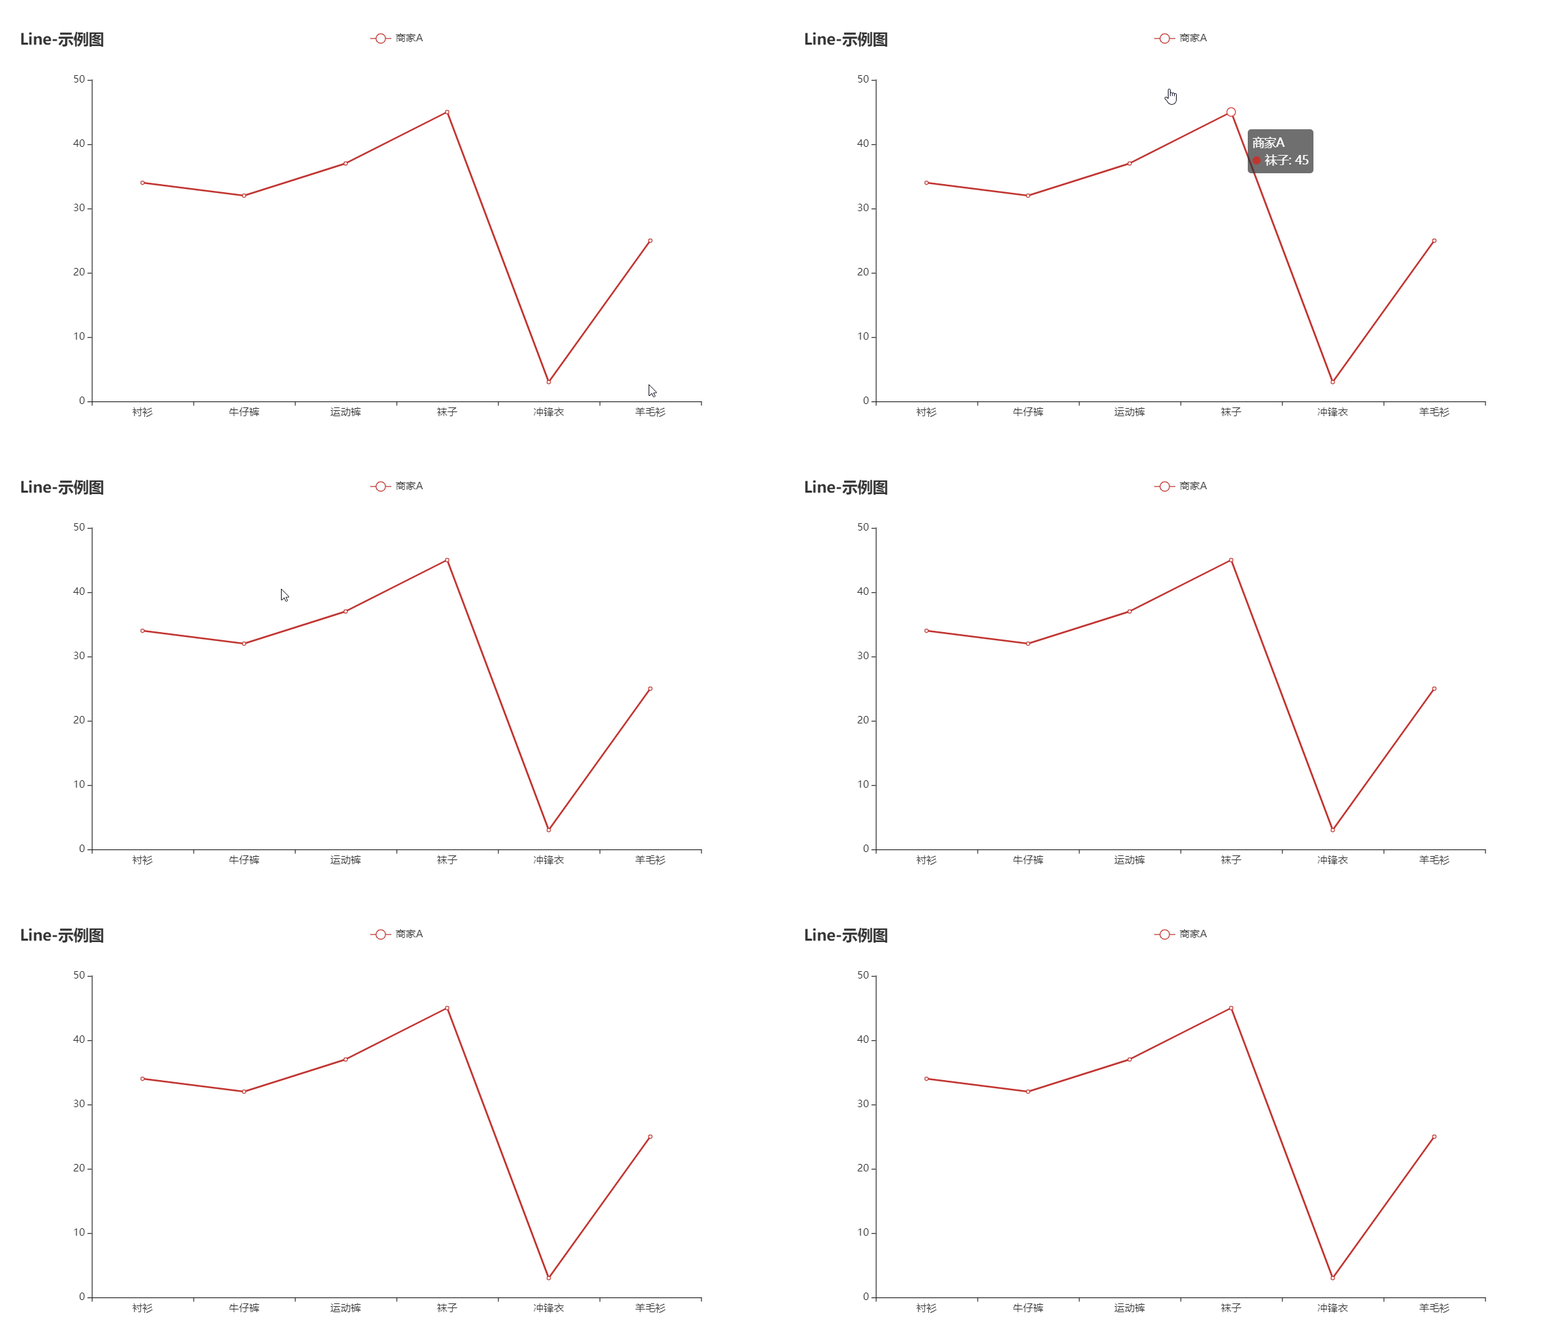
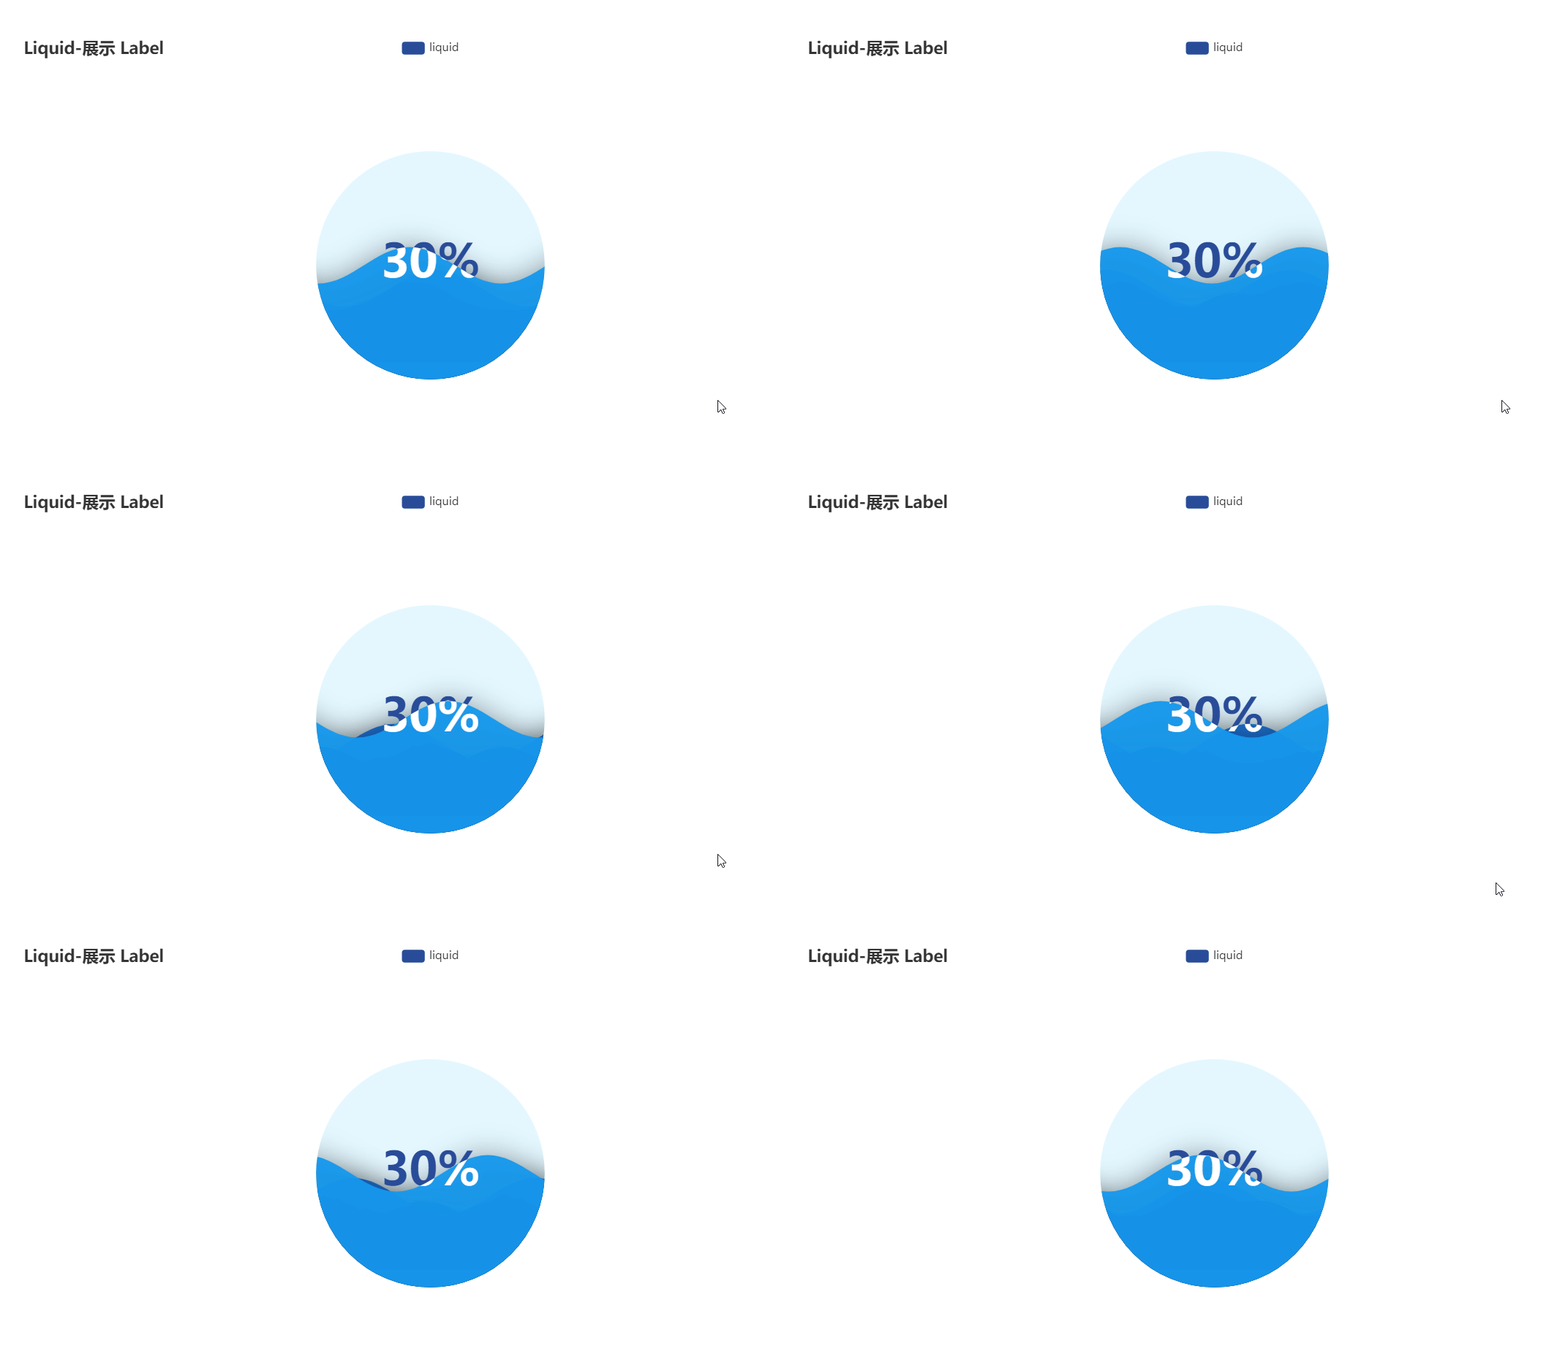
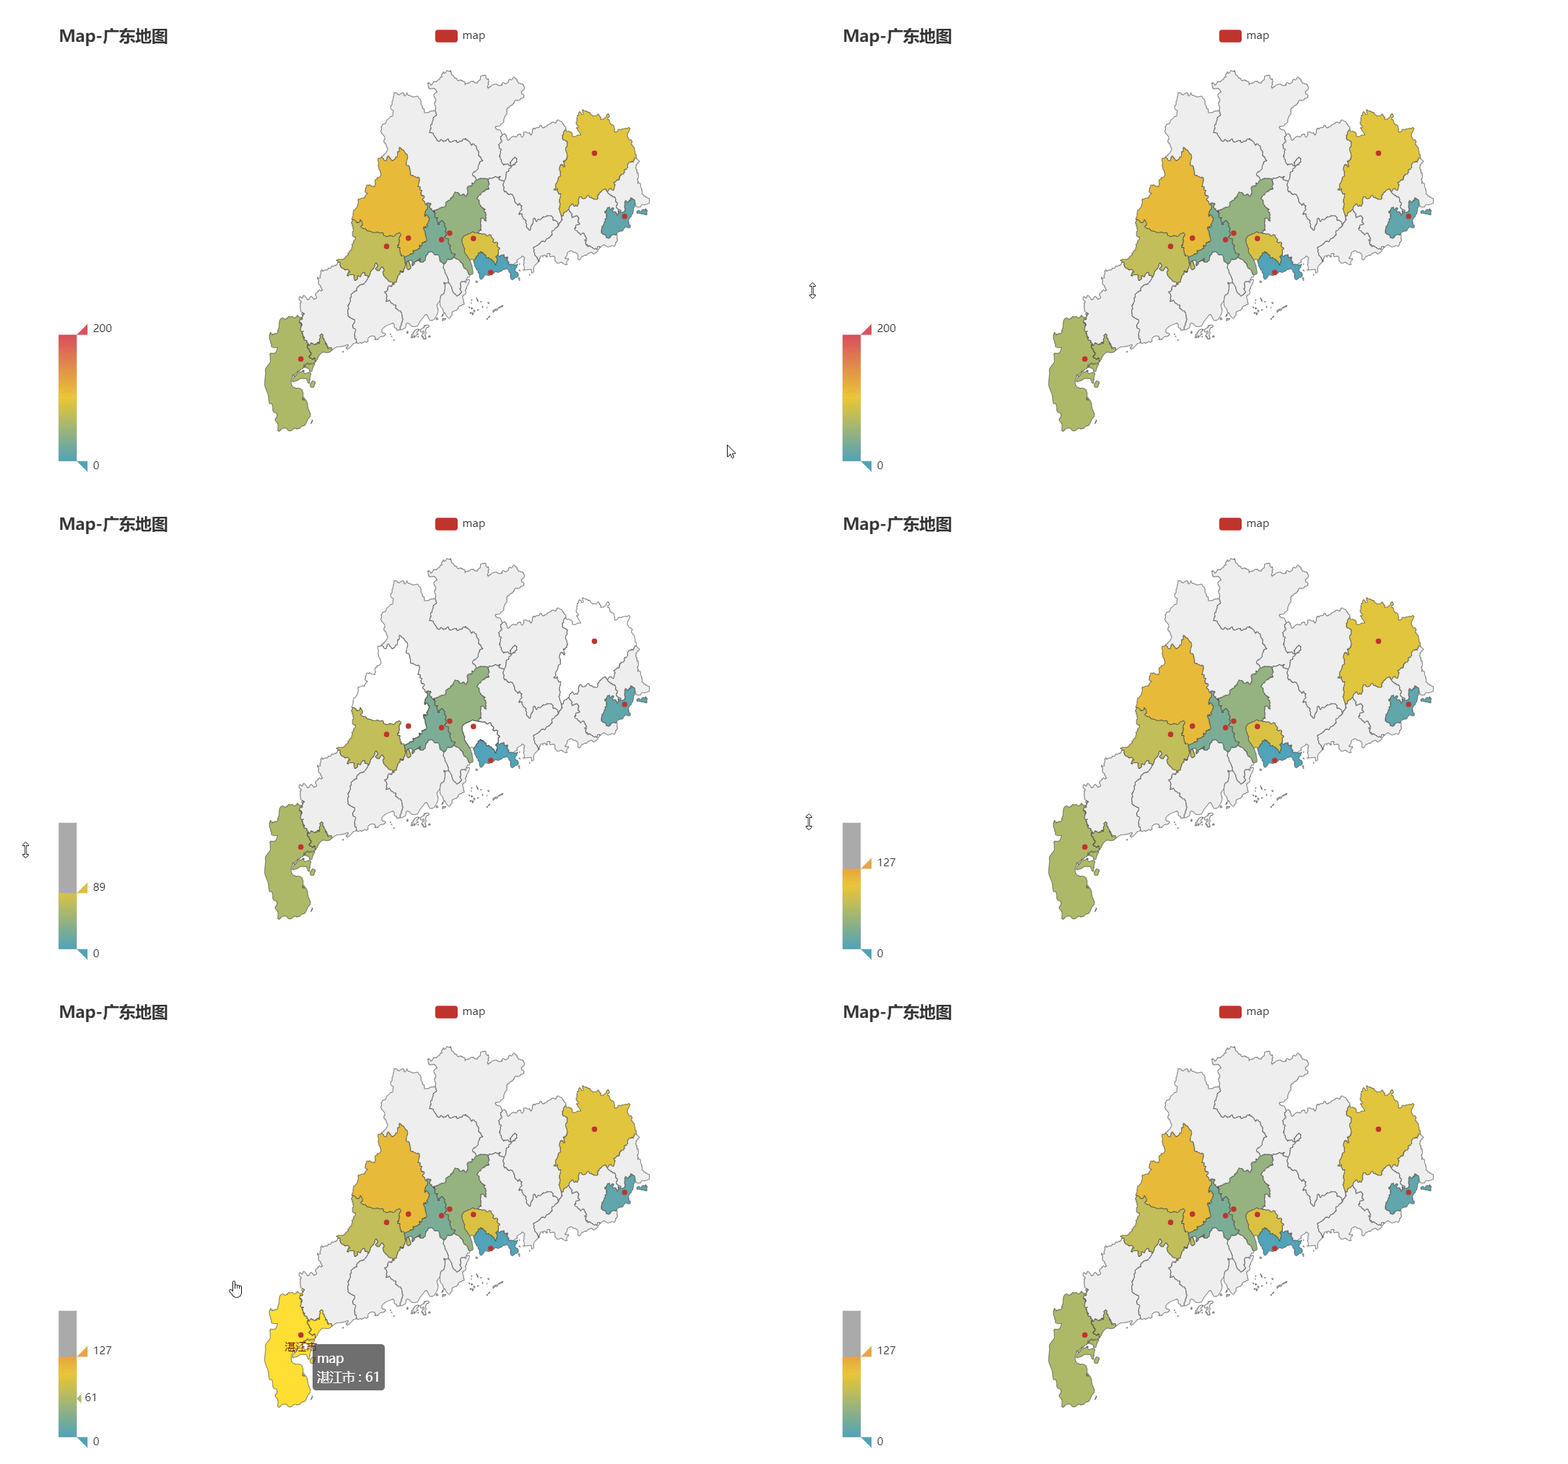
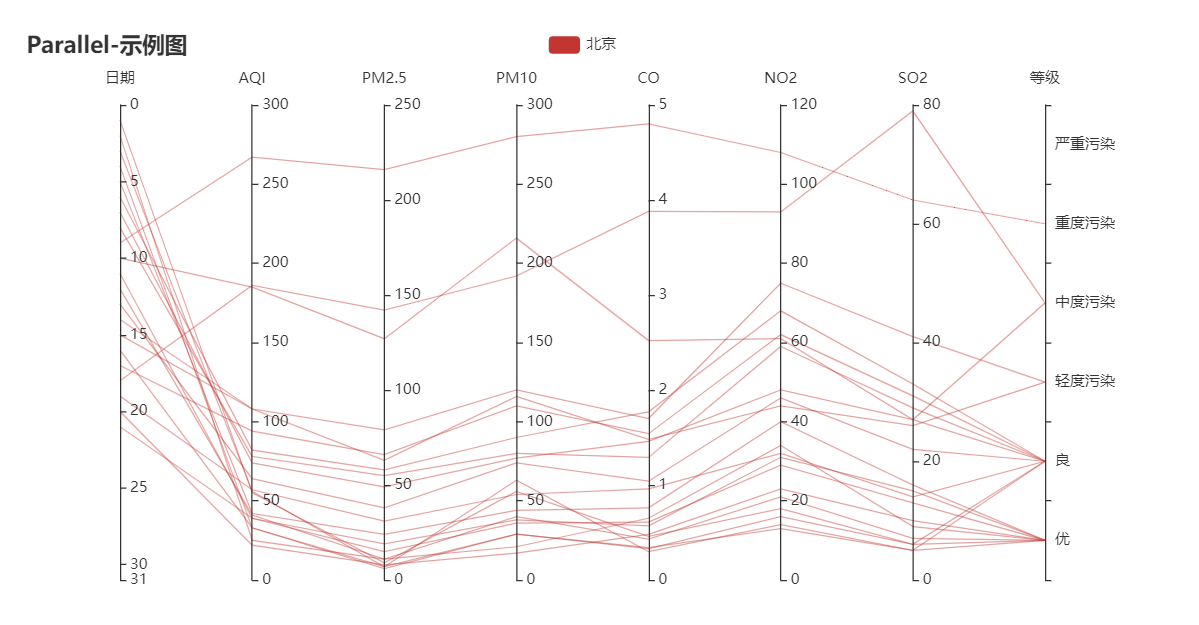
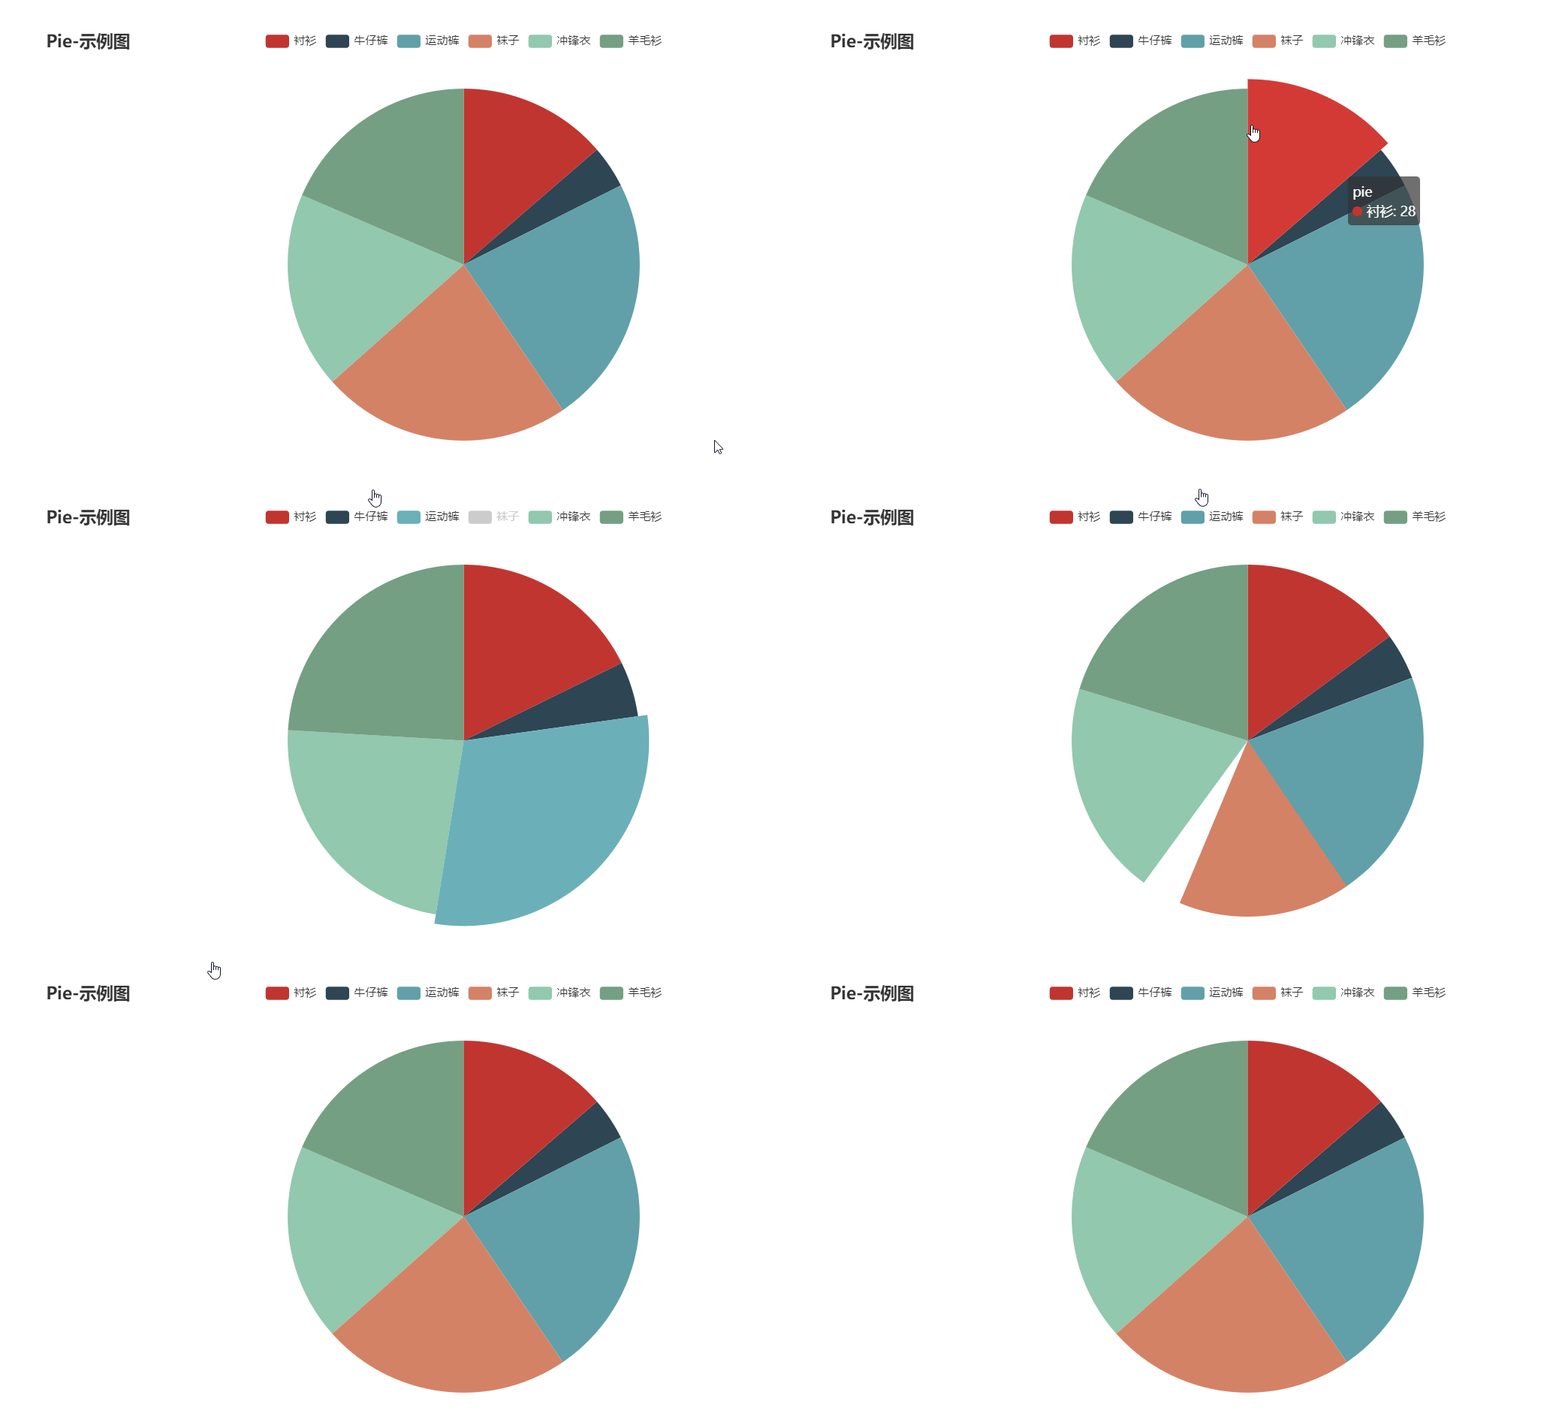
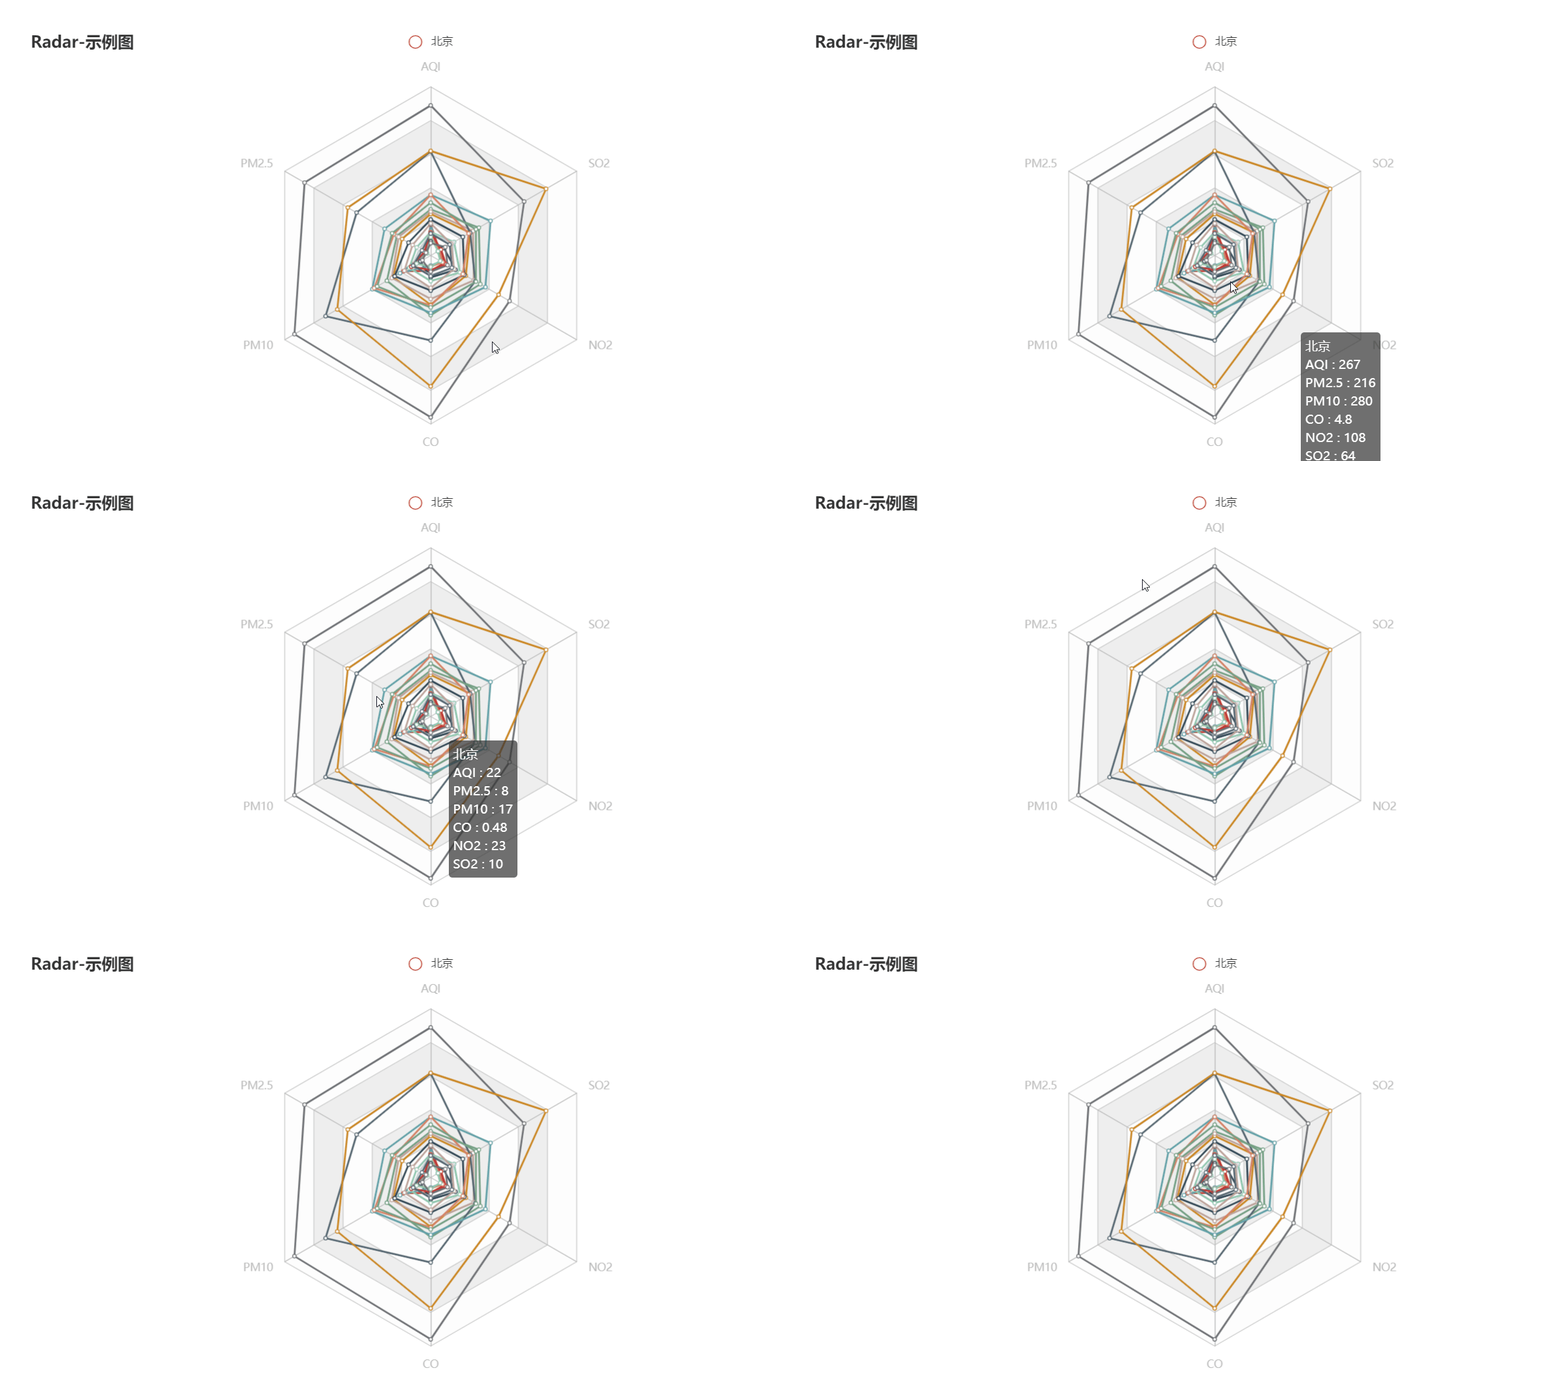
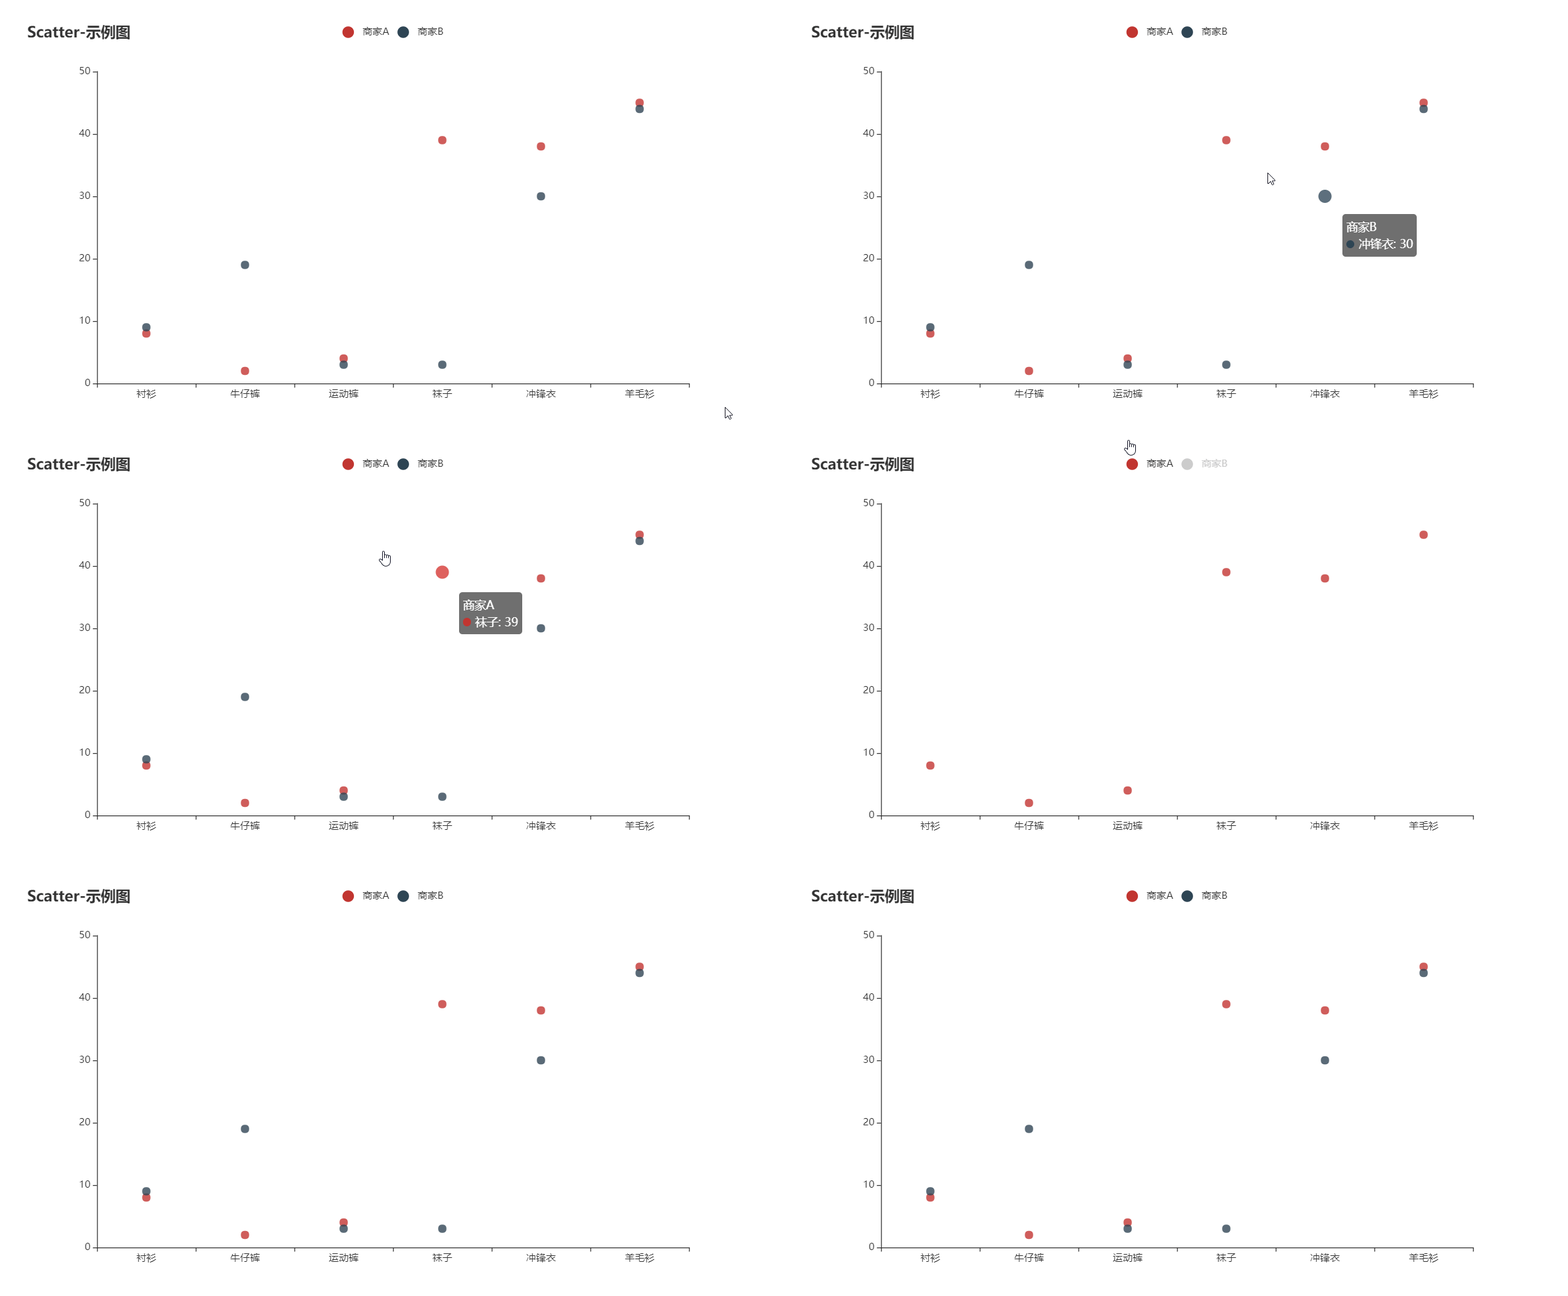
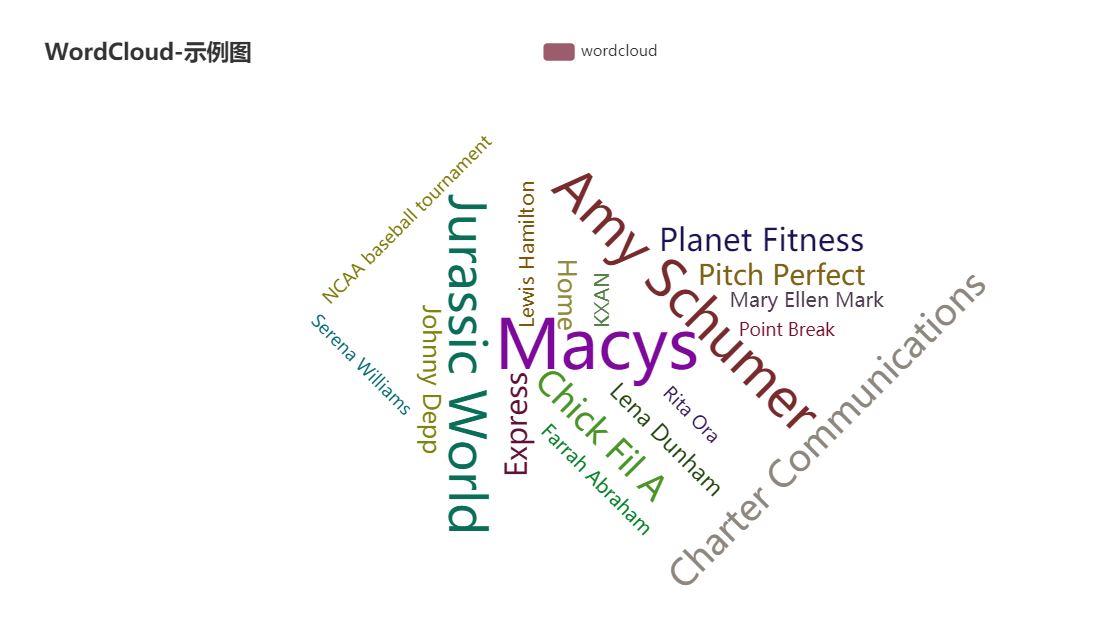
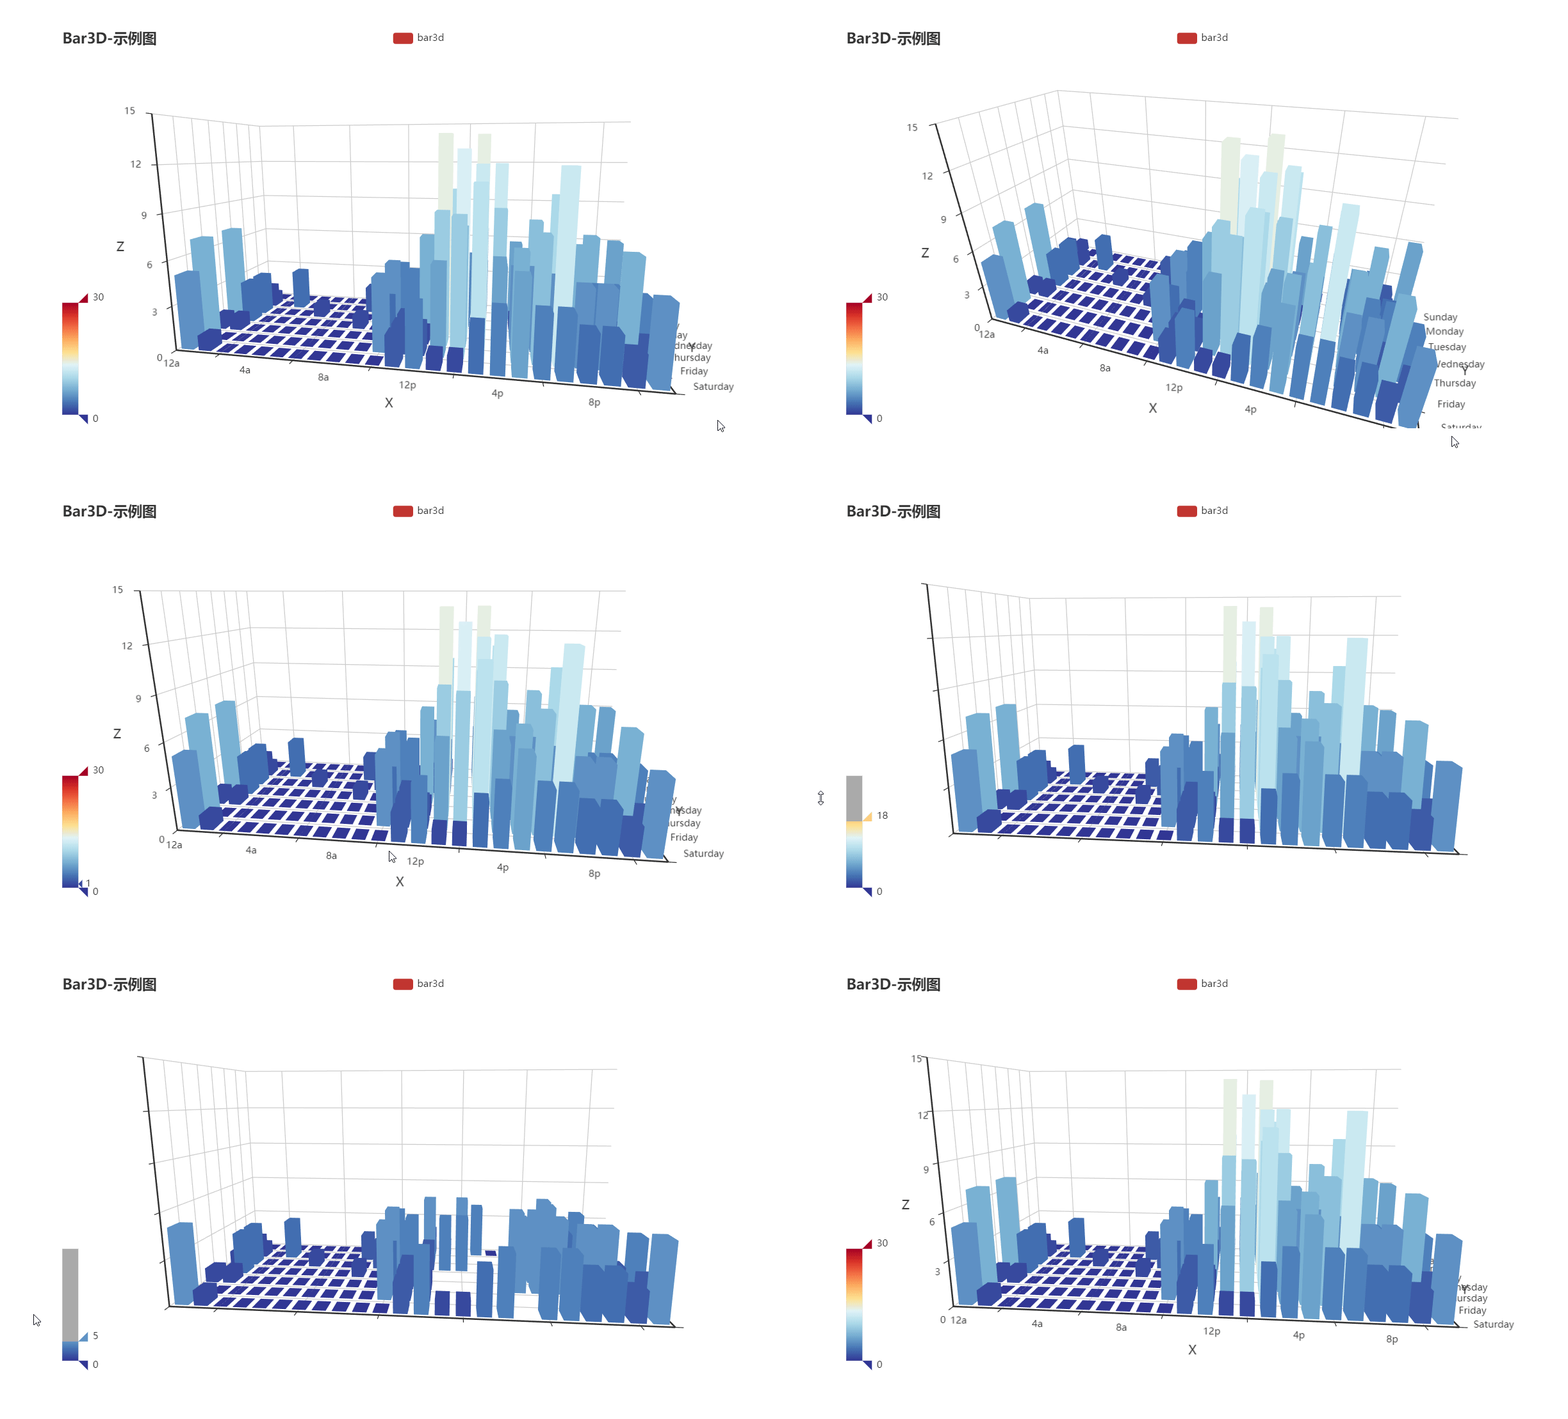
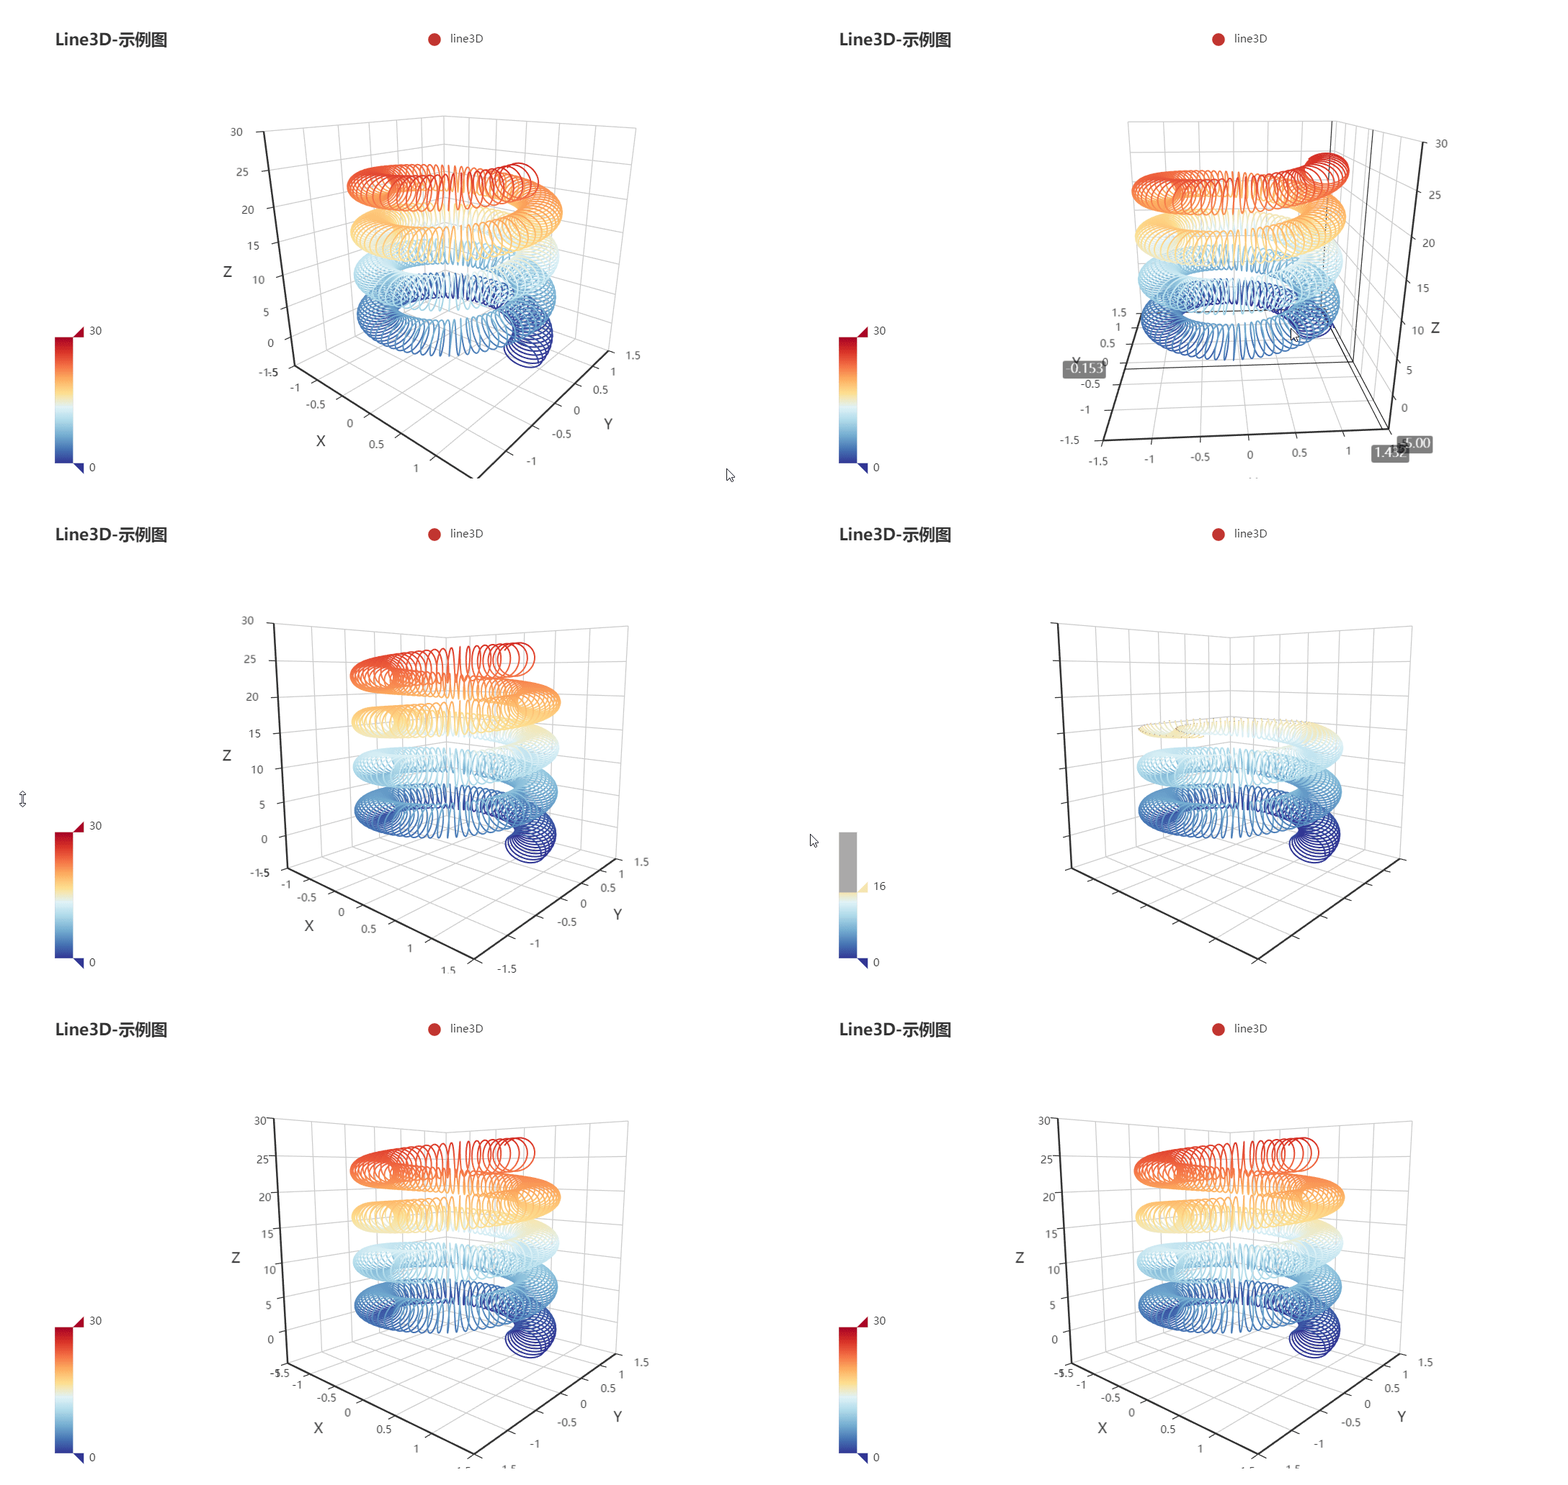
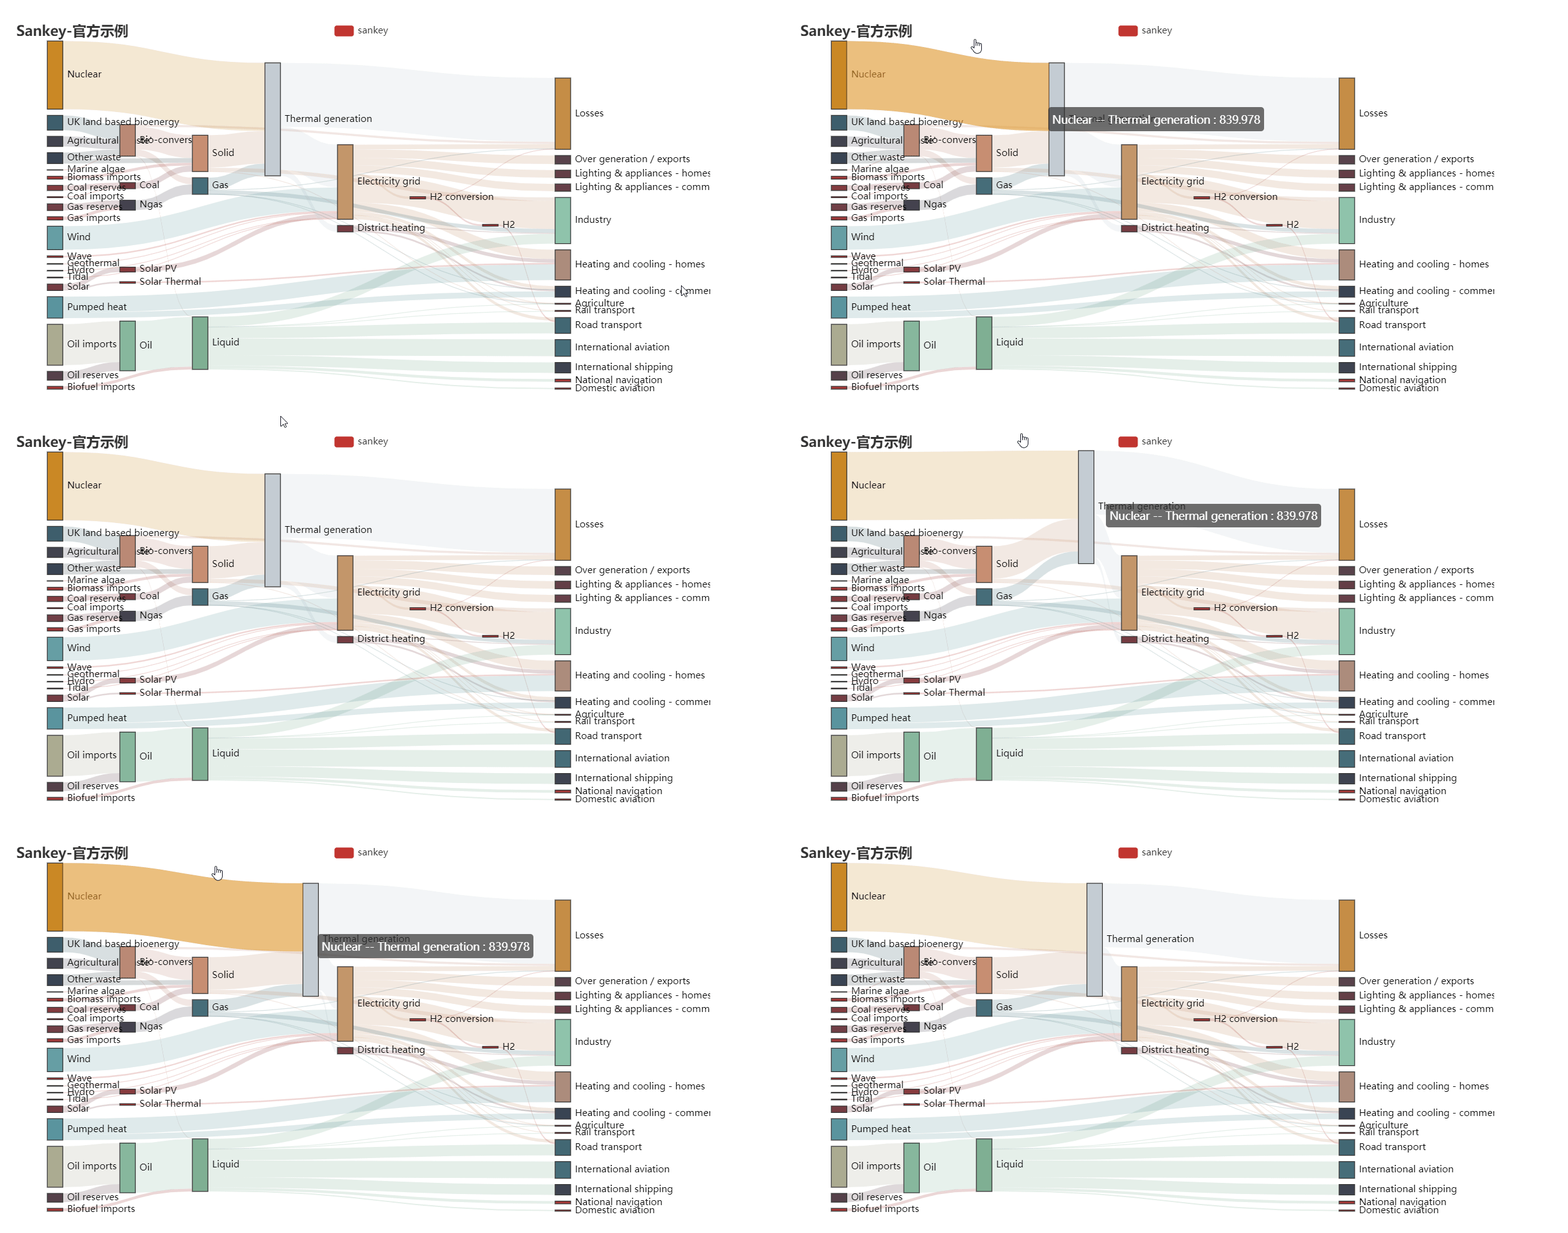
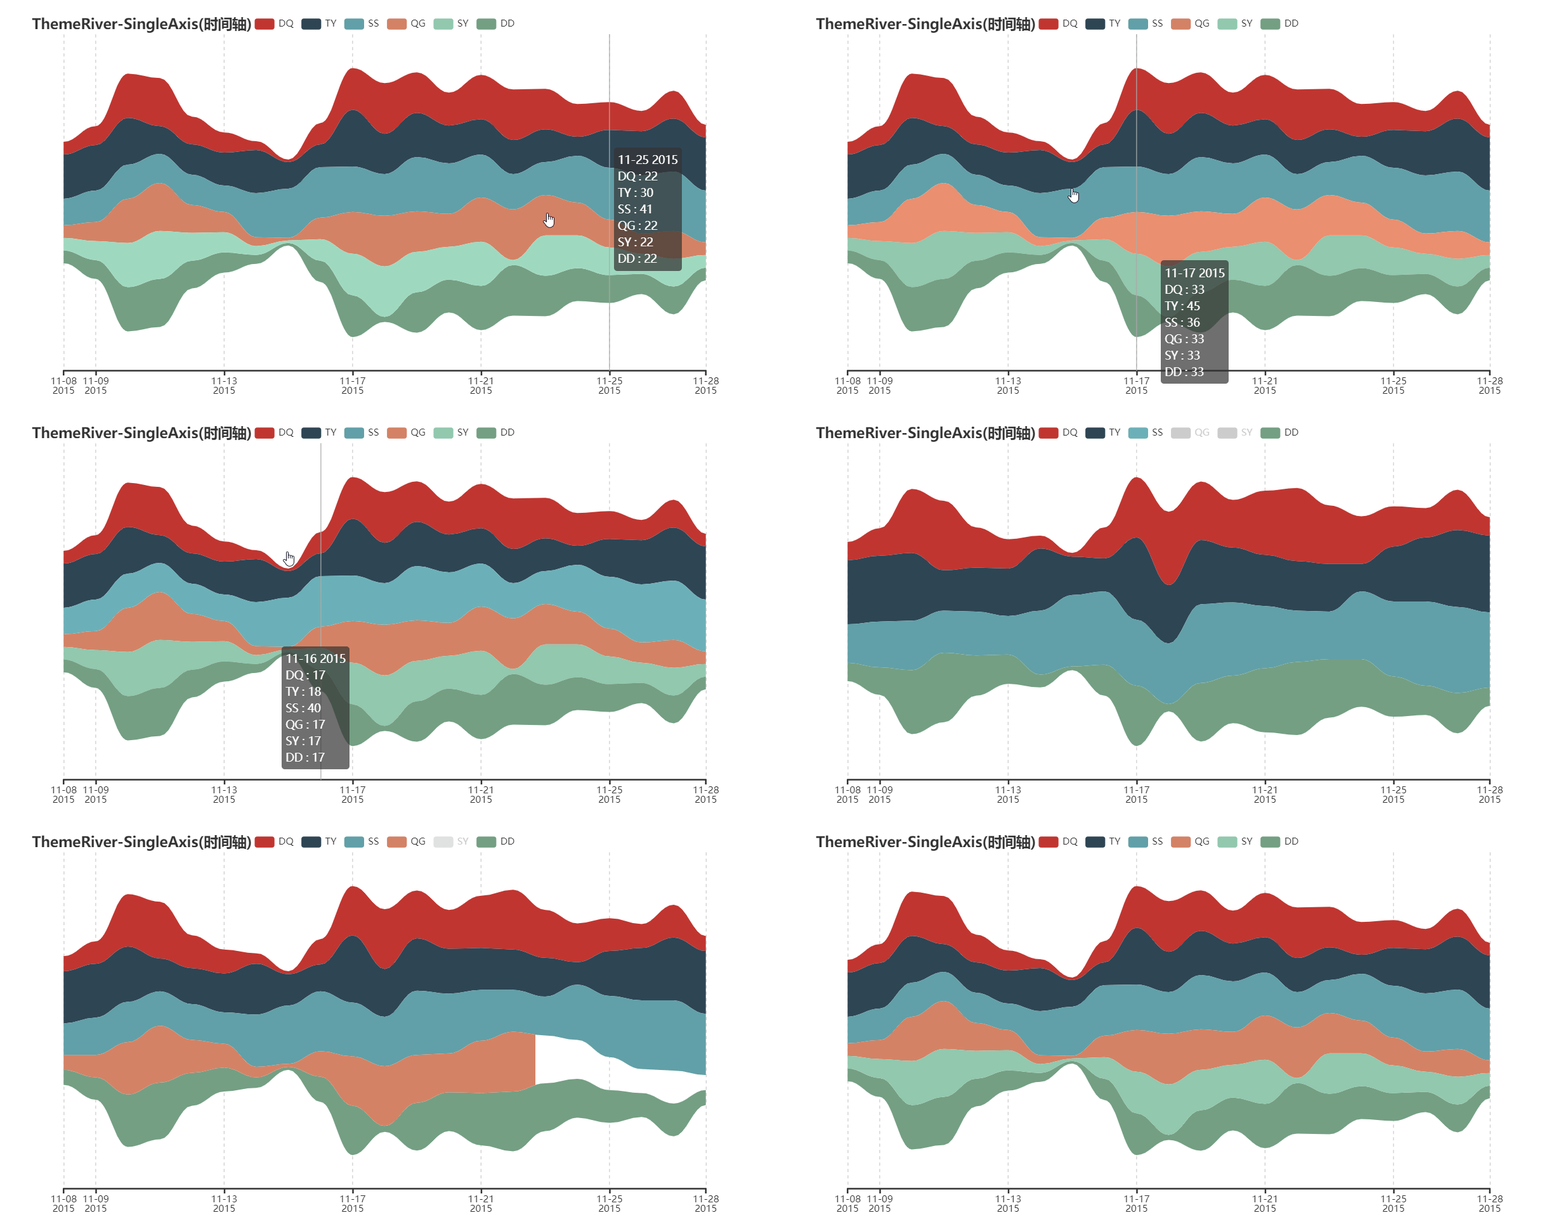
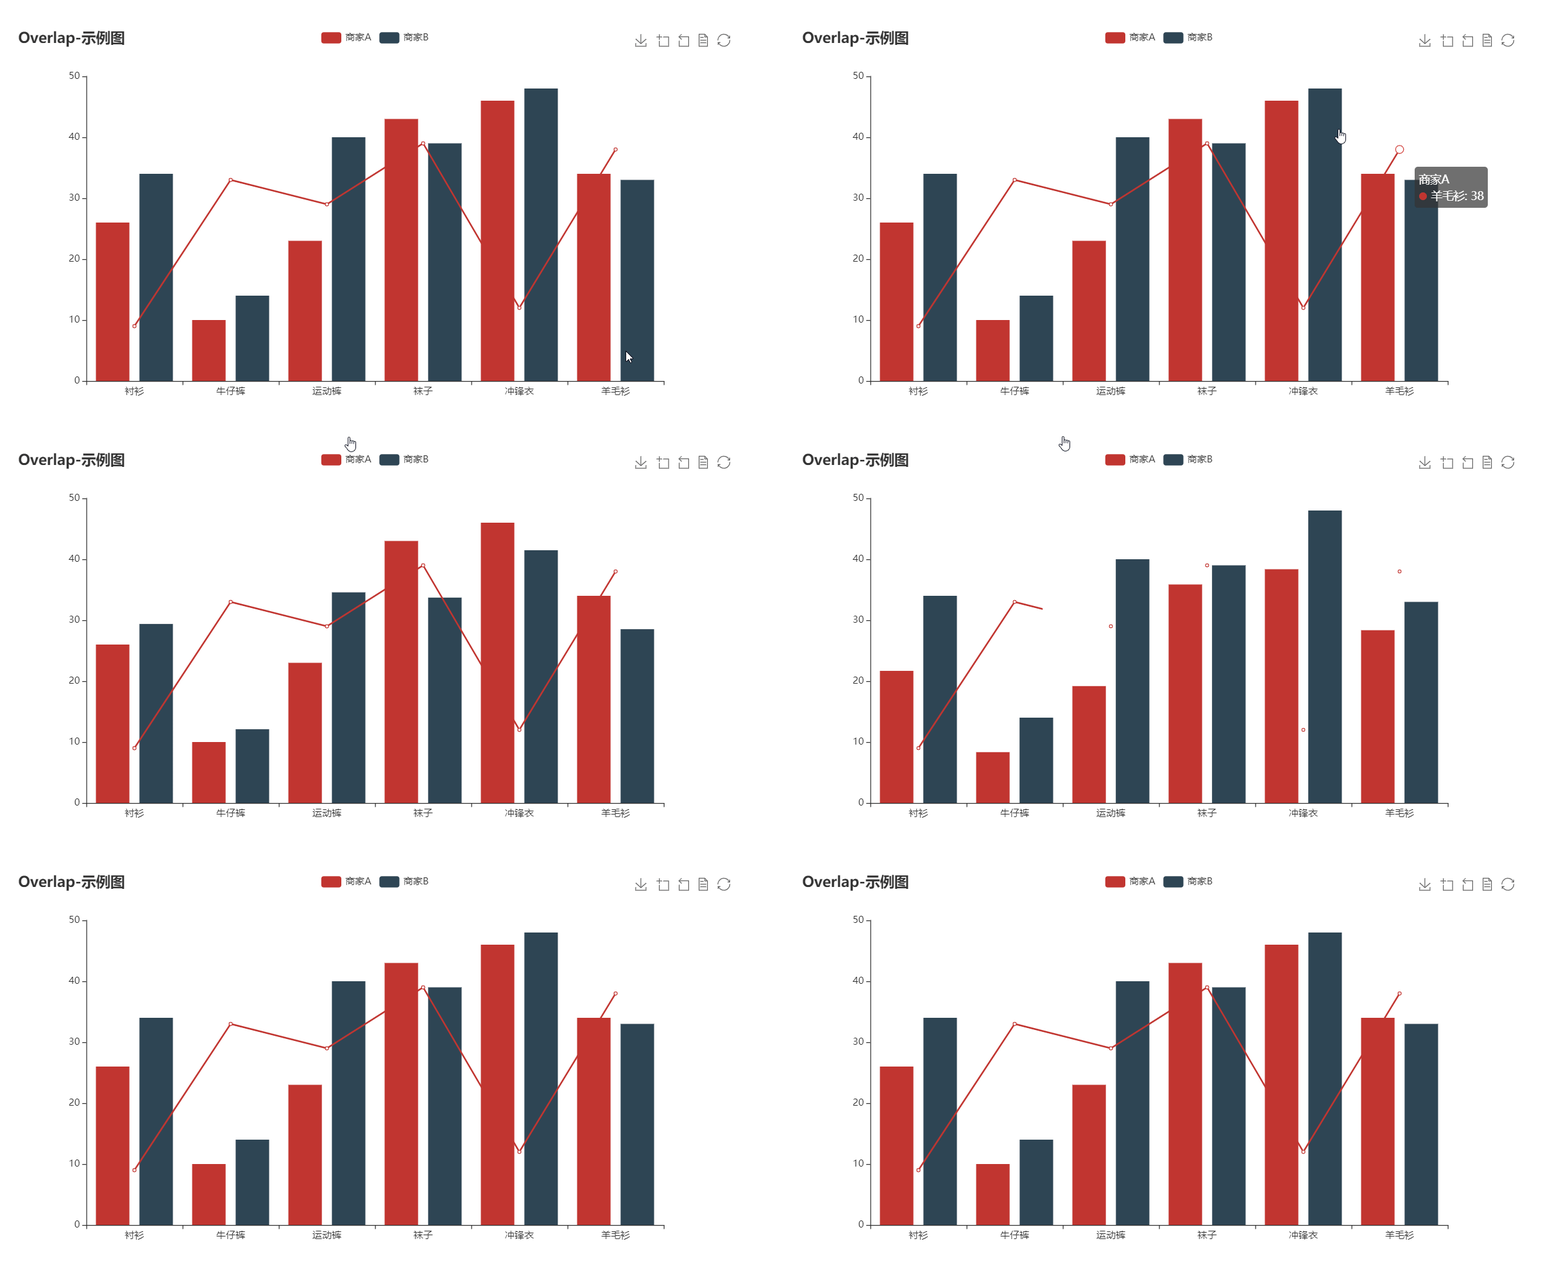
bar boxplot effectScatter funnel gague geo graph heatmap kline line liquid map parallel pie radar scatter wordCloud bar3D line3D sankey scatter3D surface3D themeRiver overlap

Widget Properties

option

String

( required )

ECharts is mainly configured by passing a string value to the JavaScript option property.

You can use jsonEncode() function in dart:convert to convert data in Dart object form:

source: ${jsonEncode(_data1)},

Because JavaScript don't have ''', you can use this operator to reduce some escape operators for quotas:

Echarts(
  option: '''
  
    // option string
    
  ''',
),

To use images in option properties, we suggest the Base64 Data URL :

image: 'data:image/png;base64,iVBORw0KG...',

extraScript

String

JavaScript which will execute after the Echarts.init() and before any chart.setOption(). The widget has a Javascript channel named Messager, so you can use this identifier to send messages from JavaScript to Flutter:

extraScript: '''
  chart.on('click', (params) => {
    if(params.componentType === 'series') {
        Messager.postMessage('anything');
    }
  });
''',

onMessage

void Function(String)?

Function to handle the message sent by Messager.postMessage() in extraScript .

extensions

List<String>

List of strings are from Echarts extensions, such as themes, components, WebGL, and languages. You can download them from the official ECharts extension list. Insert extensions as raw strings:

const liquidPlugin = r'''

  // copy from liquid.min.js

''';

theme

String

You can download built-in ECharts themes or build your own custom themes with the ECharts theme builder. Copy the theme script into the extensions param and register the theme name with this param.

captureAllGestures

bool

( default: false )

Setting captureAllGestures to true is useful when handling 3D rotation and data zoom bars. Note that setting prevents containers like ListViews from reacting to gestures on the charts.

If true, captureHorizontalGestures and captureVerticalGestures are forced true.

captureHorizontalGestures

bool

( default: false )

Only capture horizontal gestures.

captureVerticalGestures

bool

( default: false )

Only capture vertical gestures.

onLoad

void Function(WebViewController)?

The callback when first time the chart is loaded and rendered. You can get the webview controller from this function to do your magic.

reloadAfterInit

bool

( default: false )

If you have trouble in rendering charts in "Movable Widgets"(ListView, SliverView, PageVIew...) on iOS, try setting reloadAfterInit to true .

onWebResourceError

void Function(WebViewController, Exception)?

Handle the web resource error.

Blog

Reactive Echarts Flutter Widget

A performance optimization of Flutter WebView


If you have any suggestions or requests, please open an issue.

The gallery GIF is from chenjiandongx

カテゴリー

依存関係

依存関係一覧 1 件

ソースリポジトリ

このパッケージを使用しているプロジェクト