

 v1.2.1
graphify
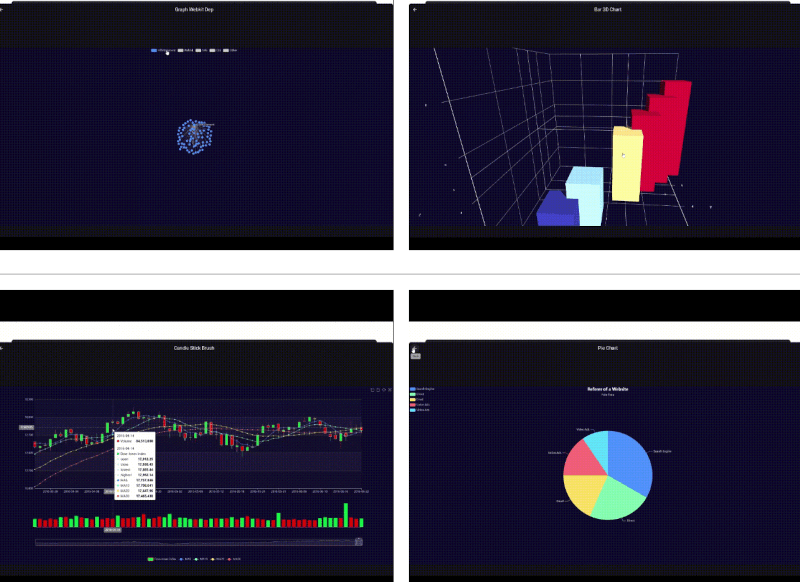
Apache Echarts をベースにしたデータ可視化チャートライブラリで、WebGL 3D、棒グラフ、折れ線グラフ、ローソク足、レーダー、グラフ、ツリーなど高度なチャートを構築できます。
45いいね 69530日間ダウンロード135Pub ポイント
AndroidiOSWebmacOSWindows
Apache Echarts をベースにしたデータ可視化チャートライブラリで、WebGL 3D、棒グラフ、折れ線グラフ、ローソク足、レーダー、グラフ、ツリーなど高度なチャートを構築できます。

以下は英語原文のスナップショットです。最新版は GitHub をご覧ください。





A data visualization charts library, based on Apache Echarts, able to build advanced charts like WebGL 3D, Bar, Line, Candlestick, Radar, Graph, Tree etc.
A Flutter package that serves as a bridge to Apache ECharts for creating interactive charts and data visualizations in your Flutter applications.
Features
Installation
Quick Start
Basic Example
Parameters and Settings
License
Contributing
How quickly you can install the package you can find here.
Import the package into your Dart file:
import 'package:graphify/graphify.dart';
Below is a minimal example demonstrating how to display a bar chart:
class BasicBarChart extends StatefulWidget {
  const BasicBarChart({super.key});

  @override
  State<BasicBarChart> createState() => _BasicBarChartState();
}

class _BasicBarChartState extends State<BasicBarChart> {

  final controller = GraphifyController();

  @override
  Widget build(BuildContext context) {
    return GraphifyView(
      controller: controller,
      initialOptions: const {
        "xAxis": {
          "type": "category",
          "data": ["Mon", "Tue", "Wed", "Thu", "Fri", "Sat", "Sun"]
        },
        "yAxis": {
          "type": "value"
        },
        "series": [
          {
            "data": [120, 200, 150, 80, 70, 110, 130],
            "type": "bar"
          }
        ]
      },
    );
  }

  @override
  void dispose() {
    controller.dispose();
    super.dispose();
  }

}
A string containing the JSON configuration for the chart, based on the Apache ECharts documentation.
Refer to the Apache ECharts Documentation for detailed configuration options and features. For source code, issue tracking, and contributions, visit the GitHub repository.
This project is licensed under the MIT License.
We welcome your contributions!
For bug reports or feature requests, please open an issue.
Thank you!
依存関係一覧 5 件
{"sdk":"flutter"}^4.10.0^1.1.1{"sdk":"flutter"}^3.0.1用途で絞り込み、開発状況を比較し、採用前に元のリポジトリで要件を確認しましょう。
“A repository is the most basic element of GitHub.”
GitHub Docs — About repositories ↗