パッケージ、リポジトリ、アプリカテゴリを検索

graphify のカバー
パッケージ詳細v1.2.1

graphify

Apache Echarts をベースにしたデータ可視化チャートライブラリで、WebGL 3D、棒グラフ、折れ線グラフ、ローソク足、レーダー、グラフ、ツリーなど高度なチャートを構築できます。

AndroidiOSWebmacOSWindows
30日間ダウンロード
695
いいね数
45
Pub ポイント
135

パッケージをインストール

flutter pub add graphify

パッケージ概要

公開情報に基づく選定ガイドです。参考としてご利用ください。

Graphify は、Apache Echarts を基盤として、高度なデータ可視化を実現するための Flutter/Dart パッケージです。WebGL 3D、棒グラフ、折れ線グラフ、ローソク足、レーダー、グラフ、ツリーなどの幅広いチャートタイプをサポートしています。クロスプラットフォーム対応で、Android、iOS、Web、macOS、Windows でスムーズに動作します。最小限のセットアップでインタラクティブで高パフォーマンスなビジュアライゼーションを構築できるようになります。ダッシュボードや分析アプリ、データ駆動型インターフェースに最適であり、Graphify は強力なチャート機能を Flutter アプリケーションに直接提供します。

用途

  • インタラクティブダッシュボード
  • リアルタイムデータモニタリング
  • 財務チャート
  • データ分析プラットフォーム
  • 科学可視化

主な機能

  • WebGL 3D チャートをサポートしています
  • 複数のチャートタイプ(棒グラフ、ラインチャート、キャンドルスティックなど)
  • クロスプラットフォーム互換性
  • 高パフォーマンスレンダリング
  • Flutter との簡単な統合
  • カスタマイズ可能なビジュアルテーマ

適している対象

  • データアナリスト
  • ダッシュボード開発者
  • ファイナンスアプリ開発者
  • 教育ソフトウェア
  • ビジュアライゼーションに焦点を当てたアプリ

注意事項

  • Echartsの概念を理解する必要があります
  • WebGL のため、バンドルサイズが大きくなる可能性があります
  • 限定的なネイティブのFlutterウィジェットカスタマイズ
  • 複雑な可視化に最適ですが、単純なチャートには向いていません
  • 外部のEchartsライブラリに依存しています

元の README

関連するソースリポジトリの README 原文のスナップショットです。最新の内容はリポジトリをご覧ください。

graphify_banner

Pub Package GitHub Repo stars GitHub closed issues GitHub open issues GitHub contributors Contributing

GRAPHIFY

A data visualization charts library, based on Apache Echarts, able to build advanced charts like WebGL 3D, Bar, Line, Candlestick, Radar, Graph, Tree etc.

A Flutter package that serves as a bridge to Apache ECharts for creating interactive charts and data visualizations in your Flutter applications.

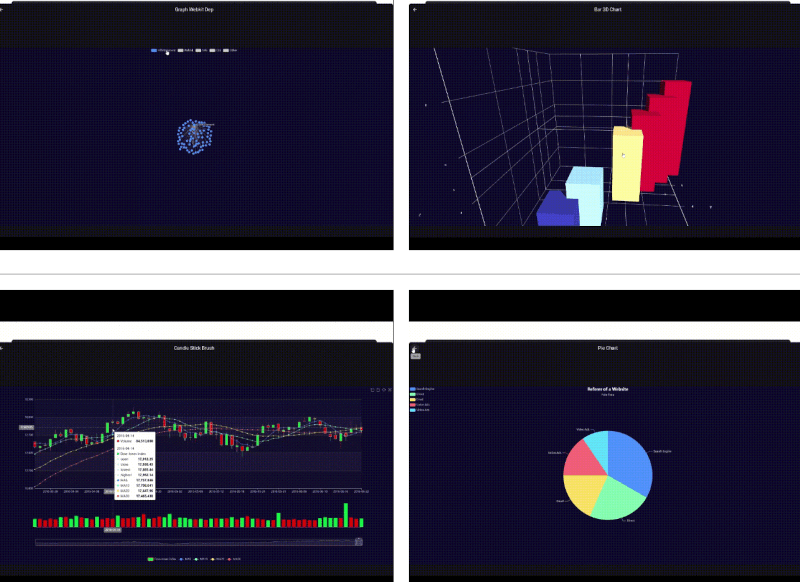
graph_webkit_dep bar_3d_chart
candle_stick_brush all

See demo
Echarts Examples
Pub.dev

Content

Features
Installation
Quick Start
Basic Example
Parameters and Settings
License
Contributing

Features

  • Apache ECharts Integration: Leverage the full power of Apache ECharts directly within your Flutter app.
  • Flexible Configuration: Pass chart configurations as JSON to render interactive visualizations.
  • All ECharts Features: You can find here eCharts features

Installation

How quickly you can install the package you can find here.

Quick Start

Importing the Package

Import the package into your Dart file:

import 'package:graphify/graphify.dart';
Basic Example

Below is a minimal example demonstrating how to display a bar chart:

class BasicBarChart extends StatefulWidget {
  const BasicBarChart({super.key});

  @override
  State<BasicBarChart> createState() => _BasicBarChartState();
}

class _BasicBarChartState extends State<BasicBarChart> {

  final controller = GraphifyController();

  @override
  Widget build(BuildContext context) {
    return GraphifyView(
      controller: controller,
      initialOptions: const {
        "xAxis": {
          "type": "category",
          "data": ["Mon", "Tue", "Wed", "Thu", "Fri", "Sat", "Sun"]
        },
        "yAxis": {
          "type": "value"
        },
        "series": [
          {
            "data": [120, 200, 150, 80, 70, 110, 130],
            "type": "bar"
          }
        ]
      },
    );
  }

  @override
  void dispose() {
    controller.dispose();
    super.dispose();
  }

}

Parameters and Settings

A string containing the JSON configuration for the chart, based on the Apache ECharts documentation.

Documentation and Support

Refer to the Apache ECharts Documentation for detailed configuration options and features. For source code, issue tracking, and contributions, visit the GitHub repository.

License

This project is licensed under the MIT License.

Contributing

We welcome your contributions!

  1. Fork the repository and create a branch for your changes.
  2. Commit your changes with clear messages.
  3. Open a pull request describing your work.

For bug reports or feature requests, please open an issue.

Thank you!

カテゴリー

依存関係

依存関係一覧 2 件

ソースリポジトリ

このパッケージを使用しているプロジェクト

データはまだありません。