

 v1.1.2
chart_sparkline
Flutter용 아름다운 스파크라인 차트. 평균선, 최고값 및 최저값.
135좋아요 7.5천30일 다운로드150Pub 점수
AndroidiOSWebmacOSWindowsLinux
Flutter용 아름다운 스파크라인 차트

아래는 영문 원문 스냅샷입니다. 최신 내용은 GitHub에서 확인하세요.

Beautiful sparkline charts for Flutter.

Install the latest version from pub.
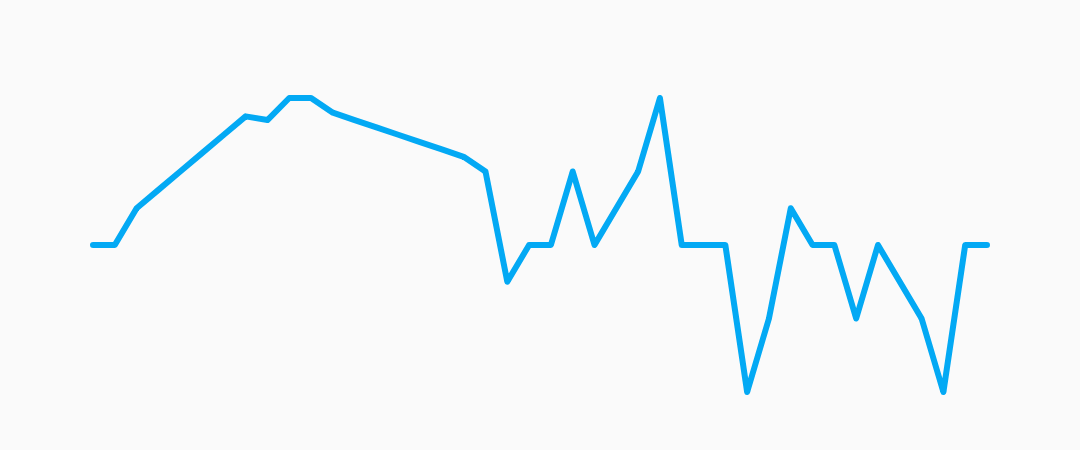
Import the package, create a Sparkline , and pass it your data.
import 'package:flutter/material.dart';
import 'package:chart_sparkline/chart_sparkline.dart';

void main() {
  var data = [0.0, 1.0, 1.5, 2.0, 0.0, 0.0, -0.5, -1.0, -0.5, 0.0, 0.0];
  runApp(
    MaterialApp(
      home: Scaffold(
        body: Center(
          child: Container(
            width: 300.0,
            height: 100.0,
            child: Sparkline(
              data: data,
            ),
          ),
        ),
      ),
    ),
  );
}

| Property | Default |
|---|---|
| lineWidth | 2.0 |
| lineColor | Colors.lightBlue |
| lineGradient | null |
Example:
Sparkline(
  data: data,
  lineWidth: 5.0,
  lineColor: Colors.purple,
);

Sparkline(
  data: data,
  lineWidth: 10.0,
  lineGradient: LinearGradient(
    begin: Alignment.topCenter,
    end: Alignment.bottomCenter,
    colors: [Colors.purple[800], Colors.purple[200]],
  ),
);

| Property | Default |
|---|---|
| pointsMode | PointsMode.none |
| pointSize | 4.0 |
| pointColor | Colors.lightBlue[800] |
| pointIndex | null |
| PointsMode | Description |
|---|---|
| none (default) | Do not draw individual points. |
| all | Draw all the points in the data set. |
| last | Draw only the last point in the data set. |
| atIndex | Draw one point at the index specified by pointIndex. |
Example:
Sparkline(
  data: data,
  pointsMode: PointsMode.all,
  pointSize: 8.0,
  pointColor: Colors.amber,
);

Sparkline(
  data: data,
  pointsMode: PointsMode.last,
  pointSize: 8.0,
  pointColor: Colors.amber,
);

Sparkline(
  data: data,
  pointsMode: PointsMode.atIndex,
  pointIndex: 7,
  pointSize: 8.0,
  pointColor: Colors.amber,
);
| Property | Default |
|---|---|
| fillMode | FillMode.none |
| fillColor | Colors.lightBlue[200] |
| fillGradient | null |
| FillMode | Description |
|---|---|
| none (default) | Do not fill, draw only the sparkline. |
| above | Fill the area above the sparkline. |
| below | Fill the area below the sparkline. |
Example:
Sparkline(
  data: data,
  fillMode: FillMode.below,
  fillColor: Colors.red[200],
);

Sparkline(
  data: data,
  fillMode: FillMode.above,
  fillColor: Colors.red[200],
);

Sparkline(
  data: data,
  fillMode: FillMode.below,
  fillGradient: LinearGradient(
    begin: Alignment.topCenter,
    end: Alignment.bottomCenter,
    colors: [Colors.red[800], Colors.red[200]],
  ),
);

Sparkline(
  data: data,
  useCubicSmoothing: true,
  cubicSmoothingFactor: 0.2,
),

Sparkline(
  data: data,
  averageLine: true,
  averageLabel: true,
),

Sparkline(
  data: data,
  kLine: ['max', 'min', 'first', 'last'],
),

Sparkline(
  gridLinelabelPrefix: '\$',
  gridLineLabelPrecision: 3,
  enableGridLines: true,
),

AnimatedBuilder(
  animation: AnimationController(duration: const Duration(seconds: 1), vsync: this),
  builder: (context, child) => Sparkline(
    data: [0.0, 1.0, 1.5, 2.0, 0.0, 0.0, -0.5, -1.0, -0.5, 0.0, 0.0],
    animationController: _controller,
    pointsMode: PointsMode.all,
    pointSize: 8.0,
  ),
),
의존성 목록 3 개
{"sdk":"flutter"}{"sdk":"flutter"}^3.0.0사용 목적에 따라 검색하고 개발 활동을 비교한 뒤 원본 저장소에서 요구 사항을 확인하세요.
“A repository is the most basic element of GitHub.”
GitHub Docs — About repositories ↗