연결된 소스 저장소의 README 원문 스냅샷입니다. 최신 내용은 저장소에서 확인하세요.
chart_sparkline
Beautiful sparkline charts for Flutter.
Online Demo
Online Demo
Installation
Install the latest version from pub .
Quick Start
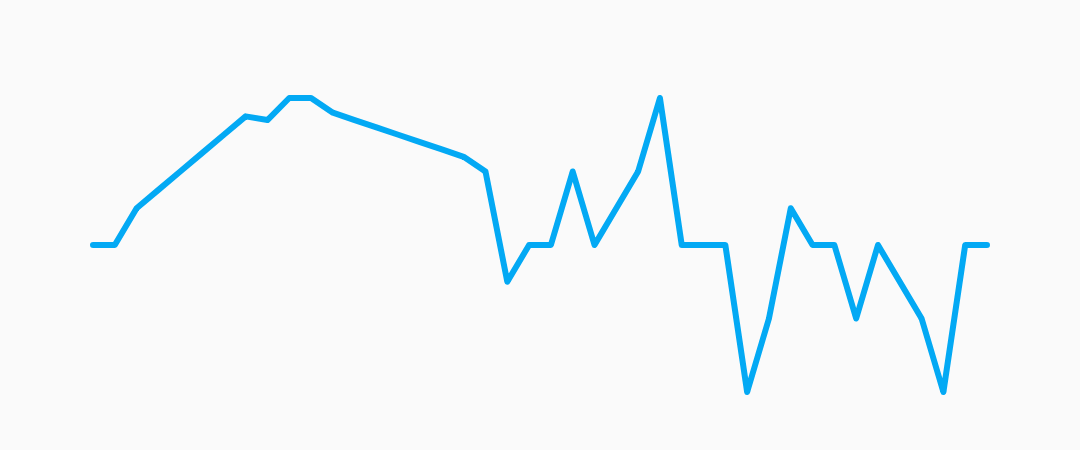
Import the package, create a Sparkline , and pass it your data.
import 'package:flutter/material.dart' ;
import 'package:chart_sparkline/chart_sparkline.dart' ;
void main () {
var data = [0.0 , 1.0 , 1.5 , 2.0 , 0.0 , 0.0 , -0.5 , -1.0 , -0.5 , 0.0 , 0.0 ];
runApp (
MaterialApp (
home: Scaffold (
body: Center (
child: Container (
width: 300.0 ,
height: 100.0 ,
child: Sparkline (
data: data,
),
),
),
),
),
);
}
Customization
Sparkline
Property
Default
lineWidth
2.0
lineColor
Colors.lightBlue
lineGradient
null
Example:
Sparkline (
data: data,
lineWidth: 5.0 ,
lineColor: Colors .purple,
);
Sparkline (
data: data,
lineWidth: 10.0 ,
lineGradient: LinearGradient (
begin: Alignment .topCenter,
end: Alignment .bottomCenter,
colors: [Colors .purple[800 ], Colors .purple[200 ]],
),
);
Points
Property
Default
pointsMode
PointsMode.none
pointSize
4.0
pointColor
Colors.lightBlue[800]
pointIndex
null
PointsMode
Description
none (default)
Do not draw individual points.
all
Draw all the points in the data set.
last
Draw only the last point in the data set.
atIndex
Draw one point at the index specified by pointIndex.
Example:
Sparkline (
data: data,
pointsMode: PointsMode .all,
pointSize: 8.0 ,
pointColor: Colors .amber,
);
Sparkline (
data: data,
pointsMode: PointsMode .last,
pointSize: 8.0 ,
pointColor: Colors .amber,
);
Sparkline (
data: data,
pointsMode: PointsMode .atIndex,
pointIndex: 7 ,
pointSize: 8.0 ,
pointColor: Colors .amber,
);
Fill
Property
Default
fillMode
FillMode.none
fillColor
Colors.lightBlue[200]
fillGradient
null
FillMode
Description
none (default)
Do not fill, draw only the sparkline.
above
Fill the area above the sparkline.
below
Fill the area below the sparkline.
Example:
Sparkline (
data: data,
fillMode: FillMode .below,
fillColor: Colors .red[200 ],
);
Sparkline (
data: data,
fillMode: FillMode .above,
fillColor: Colors .red[200 ],
);
Sparkline (
data: data,
fillMode: FillMode .below,
fillGradient: LinearGradient (
begin: Alignment .topCenter,
end: Alignment .bottomCenter,
colors: [Colors .red[800 ], Colors .red[200 ]],
),
);
Smoothing
Sparkline (
data: data,
useCubicSmoothing: true ,
cubicSmoothingFactor: 0.2 ,
),
Average Line
Sparkline (
data: data,
averageLine: true ,
averageLabel: true ,
),
first, last, highest and the lowest
Sparkline (
data: data,
kLine: ['max' , 'min' , 'first' , 'last' ],
),
Grid Line
Sparkline (
gridLinelabelPrefix: '\$' ,
gridLineLabelPrecision: 3 ,
enableGridLines: true ,
),
Animation Line
Online Demo
AnimatedBuilder (
animation: AnimationController (duration: const Duration (seconds: 1 ), vsync: this ),
builder: (context, child) => Sparkline (
data: [0.0 , 1.0 , 1.5 , 2.0 , 0.0 , 0.0 , -0.5 , -1.0 , -0.5 , 0.0 , 0.0 ],
animationController: _controller,
pointsMode: PointsMode .all,
pointSize: 8.0 ,
),
),
Todo:
[x] simple sparkline
[x] custom line width
[x] custom line color
[x] optional rounded corners
[x] fill
[x] embiggen individual points/change color
[x] different points modes [all/last/none]
[ ] animate between two sparklines
[x] animate drawing a single sparkline
[ ] gesture detector to select closest point to tap
[x] baseline
[x] different fill modes [above/below/none]
[x] fix edge points overflowing by offsetting by lineWidth
[x] better corner rounding
[x] axis labels
[x] gradient shader on line paint
[x] gradient shader on fill paint
[ ] multiple overlapping sparklines on a shared axis