
 v0.2.1
flutter_radar_chart
Flutter용 기본 레이더 차트입니다. 이 차트는 주어진 데이터에 맞춰 자동으로 조정되며, 즉시 사용할 수 있도록 설계되었습니다. 차트 디자인은 Python Graph Gallery에서 영감을 받았습니다.
101좋아요 1.8천30일 다운로드140Pub 점수
AndroidiOSWebmacOSWindowsLinux
Flutter용 기본 레이더 차트

{"sdk":"flutter"}{"sdk":"flutter"}아래는 영문 원문 스냅샷입니다. 최신 내용은 GitHub에서 확인하세요.
Animated radar chart for Flutter inspired by The Python Graph Gallery (https://python-graph-gallery.com/radar-chart/).
Follow the instructions on pub to install this package.
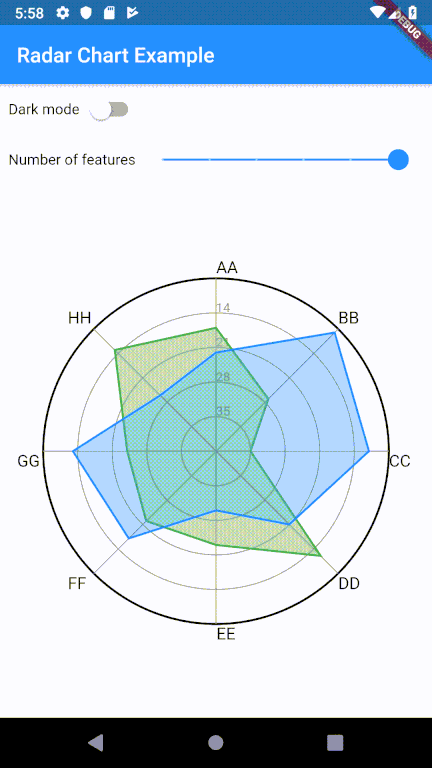
screenshot
Basic usage of radar chart requires three pieces of data:
ticks - Defines the numerical axis for the chart. Each tick generates an outline. Currently, each feature is plotted using the numerical range define by the ticks.features - Defines the numerical variables for each individual in the chart. There is no limit to the number of features.data - List of data points used to construct each individual in the chart. The number of data points must match the number of features. There is no limit to the number of individuals in the chart; however, multiple entities might cause the graph to become unreadable.RadarChart.light(
ticks: ticks,
features: features,
data: data,
),
A full example (as seen in the screenshots) can be found in example/lib/main.dart
Most of the customizability of the graph is a work in progress, but here's some of the features of the chart:
didUpdateWidget). Animations are currently enabled by default.screenshot
There's a few more areas of work that I'd love to get around to building. I will eventually move these items over to issues for better tracking.