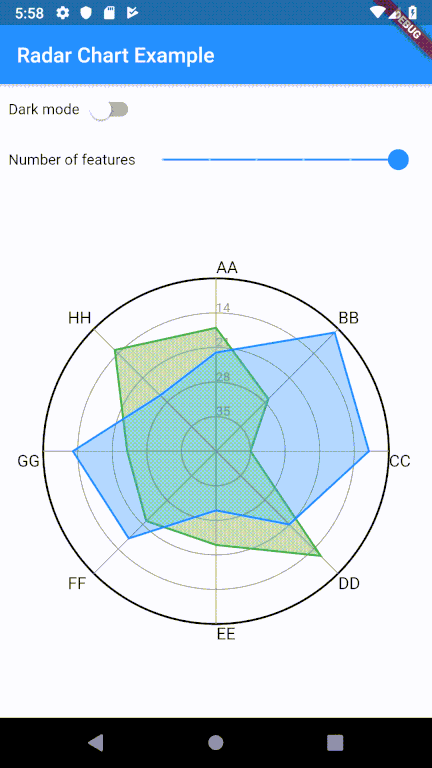
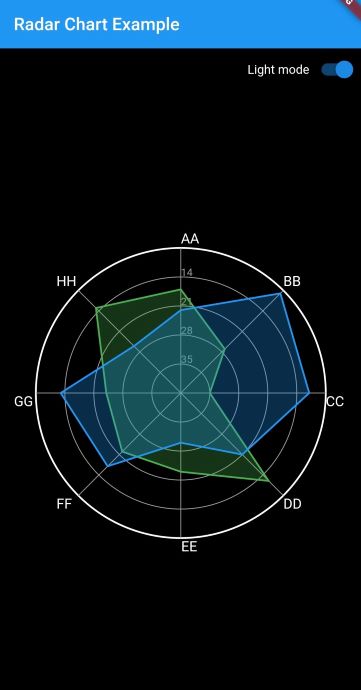
Flutter용 간단하고 자동 조정 가능한 레이더 차트로, 제공된 데이터와 원활하게 작동하도록 설계되었습니다. 파이썬 그래프 갤러리에서 영감을 받아 다차원 데이터에 대한 깔끔하고 직관적인 시각화를 제공합니다. 차트는 입력 값에 따라 자동으로 스케일링되고 적응하므로 복잡한 설정 없이도 빠르게 구현할 수 있습니다. 다양한 플랫폼에서 대시보드, 성능 비교 및 데이터 분석 인터페이스에 적합합니다.
사용 사례
성능 메트릭 시각화
다차원 데이터 비교
대시보드 위젯
앱에서의 데이터 분석
교육 도구
주요 기능
데이터 기반 자동 스케일링
최소한의 설정 필요
크로스 플랫폼 지원
깔끔하고 현대적인 디자인
반응형 레이아웃
적합한 대상
빠른 레이더 차트를 찾는 개발자
대시보드에서의 데이터 시각화
교육 또는 분석용 애플리케이션
다중 축 데이터를 가진 앱
경량 차트가 필요한 프로젝트
고려 사항
제한된 사용자 정의 옵션
작은부터 중간 규모의 데이터 세트에 적합
매우 상호작용적인 차트에는 적합하지 않음
내장된 툴팁이나 애니메이션이 없음
고급 기능을 위해 외부 라이브러리에 의존합니다
원본 README
연결된 소스 저장소의 README 원문 스냅샷입니다. 최신 내용은 저장소에서 확인하세요.
flutter_radar_chart
Animated radar chart for Flutter inspired by The Python Graph Gallery (https://python-graph-gallery.com/radar-chart/).
Follow the instructions on pub to install this package.
Example
Usage
Basic usage of radar chart requires three pieces of data:
ticks - Defines the numerical axis for the chart. Each tick generates an outline. Currently, each feature is plotted using the numerical range define by the ticks.
features - Defines the numerical variables for each individual in the chart. There is no limit to the number of features.
data - List of data points used to construct each individual in the chart. The number of data points must match the number of features. There is no limit to the number of individuals in the chart; however, multiple entities might cause the graph to become unreadable.
A full example (as seen in the screenshots) can be found in example/lib/main.dart
Customizability
Most of the customizability of the graph is a work in progress, but here's some of the features of the chart:
Animations! Trying to add some life to the chart. Animation is currently triggered whenever the widget is updated (didUpdateWidget). Animations are currently enabled by default.
Number of features: As shown in the example, the radar chart will adjust to the number of given variables. More work is needed to ensure the chart doesn't explode when given invalid data.
Reverse axis: Reverses the axis range so that the min value starts at the graph outline.
Dark mode: Simple factory that showcases the color customizability of the chart.
Polygon sides: Ability to use flat polygon borders instead of a circular border.
Future Work Ideas
There's a few more areas of work that I'd love to get around to building. I will eventually move these items over to issues for better tracking.