
 v1.2.0
fl_animated_linechart
애니메이션 효과가 있는 Flutter 선형 및 영역 차트입니다. 대용량 데이터 세트를 처리할 수 있으며, 다중 Y축과 날짜/시간 X축을 지원합니다.
73좋아요 12730일 다운로드130Pub 점수
AndroidiOSWebmacOSWindowsLinux
플러터용 애니메이션 라인 차트

{"sdk":"flutter"}^0.19.0^1.0.1{"sdk":"flutter"}아래는 영문 원문 스냅샷입니다. 최신 내용은 GitHub에서 확인하세요.
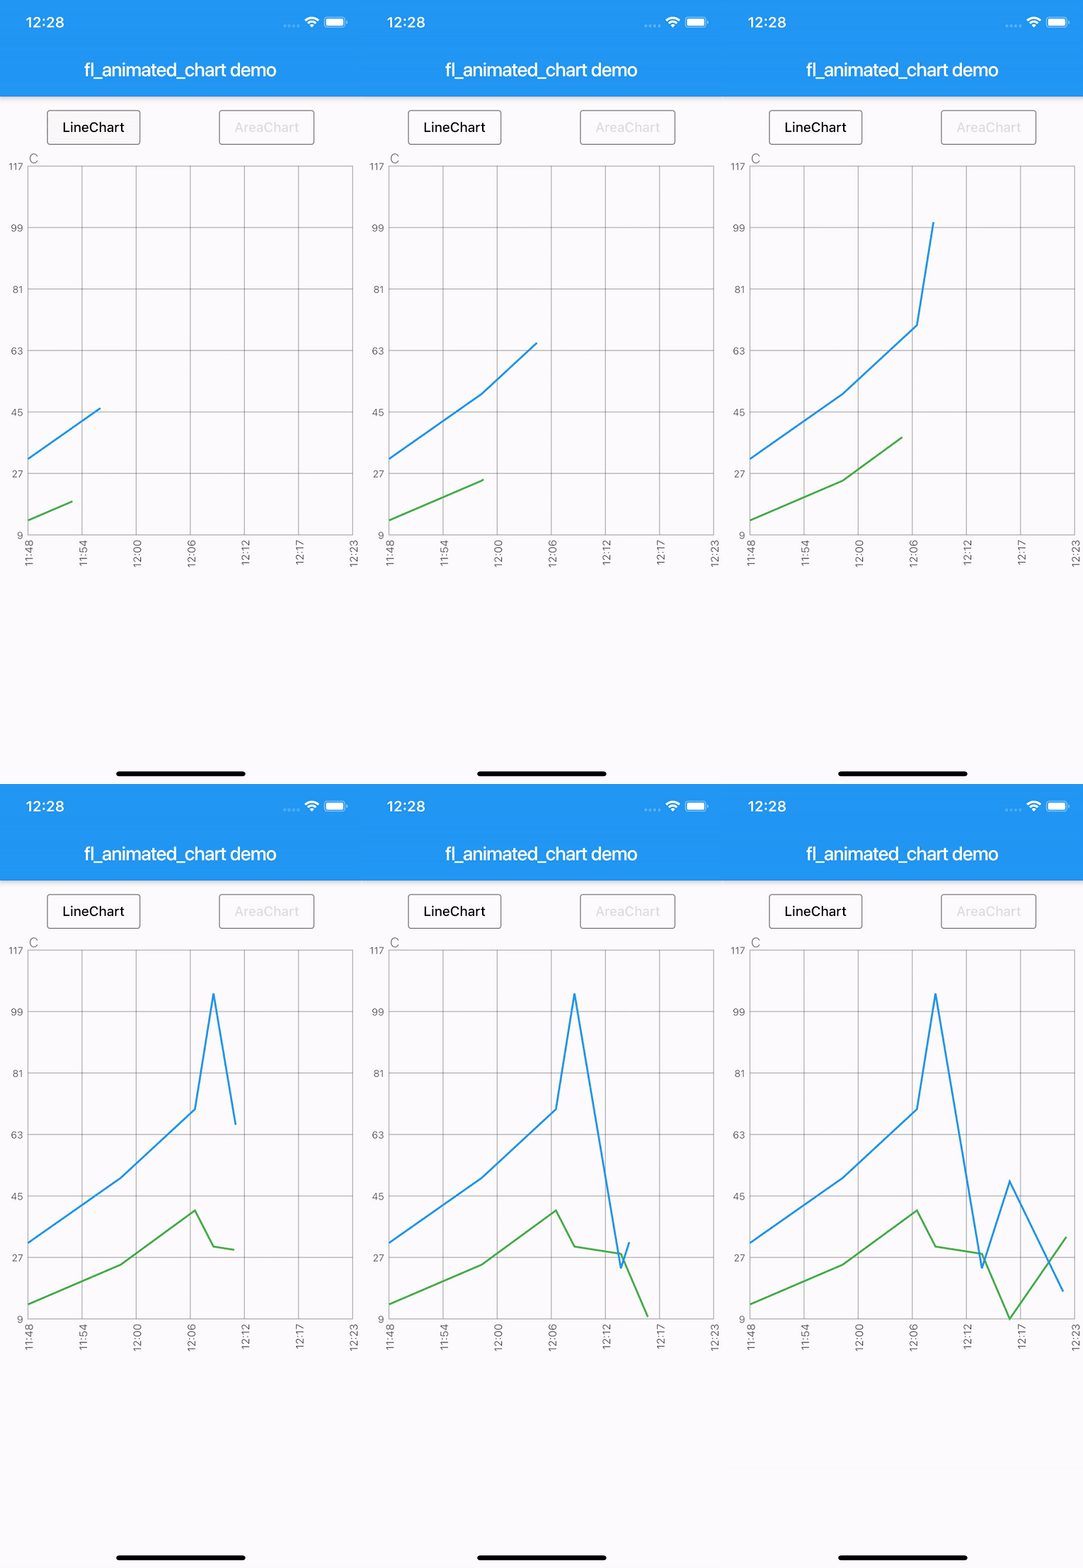
Animations
An animated chart library for flutter.
There are currently two different charts:
Try the sample project or include in your project.
Highlight for the line chart:
Chart example with highlight
Linechart with markerlines, icons, legends and "heat-map" shaded zones:
Chart example with markerlines and legends
Chart example with horizontal and vertical markerlines along with icons on the chart and legends
Chart example with shaded area between markerlines
Area chart:
Area Chart example
Area Chart example
Example code:
    LineChart lineChart = LineChart.fromDateTimeMaps([line1, line2], [Colors.green, Colors.blue]);

    return Scaffold(
      appBar: AppBar(
        title: Text(widget.title),
      ),
      body: Container(
        child: Column(
            mainAxisSize: MainAxisSize.max,
            mainAxisAlignment: MainAxisAlignment.spaceBetween,
            crossAxisAlignment: CrossAxisAlignment.stretch,
            children: [
              Expanded(child: AnimatedLineChart(lineChart)),
            ]
        ),
      ),
    );
LineChart lineChart = LineChart.fromDateTimeMaps([
    line1,
    line2,
    line3,
    line4,
    line5
  ], [
    Colors.blue,
    Colors.red,
    Colors.yellow,
    Colors.yellow,
    Colors.red
  ], [
    'C',
    'C',
    'C',
    'C',
    'C',
  ], tapTextFontWeight: FontWeight.w400);
To define a line as a horizontal dashed markerline, first define the line as any other regular line, then set isMarkerLine to true:
lineChart.lines[1].isMarkerLine = true;
lineChart.lines[2].isMarkerLine = true;
lineChart.lines[3].isMarkerLine = true;
lineChart.lines[4].isMarkerLine = true;
Or:
  lineChart.lines.skip(1).forEach((line) {
      line.isMarkerLine = true;
    });
Legends:
A Legend has the following constructor:
const Legend({this.title, this.color, this.icon, this.style, this.showLeadingLine = false,});
You can choose to either have a short line or an Icon as the first part of the legend before the title. It is possible set showLeadingLine to true, then a short line will be shown in the color you have defined.
You can change the Color of the line and Icon, and the TextStyle of the String title.
The length of the Legends list must to equal to the length of chartlines which have isMakerLine = true.
When orientation of the screen is in landscape mode, it is possible to have the legends drawn on the right hand side instead of below the graph.
Simply set legendsRightLandscapeMode: true
      return Scaffold(
      appBar: AppBar(
        title: Text(widget.title),
      ),
      body: Container(
        child: Column(
          mainAxisSize: MainAxisSize.max,
          mainAxisAlignment: MainAxisAlignment.spaceBetween,
          crossAxisAlignment: CrossAxisAlignment.stretch,
          children: [
            Expanded(
              child: AnimatedLineChart(
                lineChart,
                toolTipColor: Colors.white,
                gridColor: Colors.black54,
                textStyle: TextStyle(fontSize: 10, color: Colors.black54),
                showMarkerLines:
                    true, // If this value is not set to true, all defines lines will be filled lines and not dashed
                legends: [
                  Legend(title: 'Critical', color: Colors.red, showLeadingLine: true),
                  Legend(title: 'Warning', color: Colors.yellow, Icon(Icons.report_problem_rounded, size: 17, color: Colors.yellow)),
                ],
                legendsRightLandscapeMode: true,
              ),
            ),
          ],
        ),
      ),
    );
It is possible to define a maximum of two vertical markerlines.
The verticalMarker variable is a List<DateTime> and the length can be >= 2.
If two vertical markerlines are defined, the area between the two lines will be filled with a color that can be defined with verticalMarkerColor.
It is possible to add an Icon on the point where the vertical markerline crosses the y-axis value by defining the verticalMarkerIcon.
The verticalMarkerIcon variable takes a List<Icon> and the lenght must be equal to the length of the verticalMarker variable.
The possibility of adding a colored background to the icons have been added and can be defined with iconBackgroundColor which takes a Color.
      return Scaffold(
      appBar: AppBar(
        title: Text(widget.title),
      ),
      body: Container(
        child: Column(
          mainAxisSize: MainAxisSize.max,
          mainAxisAlignment: MainAxisAlignment.spaceBetween,
          crossAxisAlignment: CrossAxisAlignment.stretch,
          children: [
            Expanded(
              child: AnimatedLineChart(
                lineChart,
                toolTipColor: Colors.white,
                gridColor: Colors.black54,
                textStyle: TextStyle(fontSize: 10, color: Colors.black54),
                showMarkerLines:
                    true, // If this value is not set to true, all defines lines will be filled lines and not dashed
                legends: [
                  Legend(title: 'Critical', color: Colors.red),
                  Legend(title: 'Warning', color: Colors.yellow),
                ],
                verticalMarker:[
                    DateTime.parse('2012-02-27 12:54:00'),
                    DateTime.parse('2012-02-27 13:16:00')
                        ],
                  verticalMarkerColor: Colors.yellow,
                  verticalMarkerIcon: [
                    Icon(
                      Icons.report_problem_rounded,
                      color: Colors.yellow,
                    ),
                    Icon(
                      Icons.check_circle_rounded,
                      color: Colors.green,
                    ),
                  ],
                  iconBackgroundColor: Colors.white,
              ),
            ),
          ],
        ),
      ),
    );
Example code with shaded area between markerlines:
It is possible to have shaded areas between the defined markerlines.
The shaded area will be in the same color as the markerline.
It is important that the order of enums in the List<MaxMin> filledMarkerLinesValues matches the order of defined markerlines to be shown in the graph.
Enums with the value MaxMin.MAX will draw to the top if there is only one markerline defined as MAX, otherwise it will draw from i - 1 where enum values are MAX.
If enum value is MaxMin.MIN the shaded area will draw downwards to i + 1, unless the index is the last in the list, then the shaded area will draw all the way to the bottom of the graph.
      return Scaffold(
      appBar: AppBar(
        title: Text(widget.title),
      ),
      body: Container(
        child: Column(
          mainAxisSize: MainAxisSize.max,
          mainAxisAlignment: MainAxisAlignment.spaceBetween,
          crossAxisAlignment: CrossAxisAlignment.stretch,
          children: [
            Expanded(
              child: AnimatedLineChart(
                  chart,
                  key: UniqueKey(),
                  gridColor: Colors.black54,
                  textStyle: TextStyle(fontSize: 10, color: Colors.black54),
                  toolTipColor: Colors.white,
                  showMarkerLines: true,
                  fillMarkerLines: true,
                  filledMarkerLinesValues:[
                          MaxMin.MAX,
                          MaxMin.MAX,
                          MaxMin.MIN,
                          MaxMin.MIN,
                        ],
              ),
            ),
          ],
        ),
      ),
    );
The example app, can toggle between line chart and area chart. Example app