Buscar pacotes, repositórios e categorias de apps

Capa de stacked_bar_chart
Detalhes do pacotev1.1.0+2

stacked_bar_chart

Uma biblioteca Flutter para desenhar gráficos que podem ser rolados, além de personalizáveis conforme as necessidades dos desenvolvedores.

AndroidiOSWebmacOSWindowsLinux
Downloads em 30 dias
16
Curtidas
38
Pontos Pub
130

Instalar pacote

flutter pub add stacked_bar_chart

Visão geral do pacote

Orientação gerada a partir de informações públicas. Apenas para referência.

Uma biblioteca Flutter para criar gráficos de barras empilhadas personalizáveis e roláveis. Projetada para desenvolvedores que precisam de ferramentas flexíveis de visualização, suporta renderização dinâmica de dados em múltiplas plataformas, incluindo Android, iOS, Web, macOS, Windows e Linux. O pacote permite uma representação intuitiva dos dados com rolagem suave e opções extensivas de estilização para atender às necessidades de design do aplicativo. Ideal para painéis, análises e interfaces de relatórios onde a comparação de dados em camadas é essencial.

Casos de uso

  • Painéis de dados
  • Relatórios de análise
  • Visualização de tendências financeiras
  • Aplicativos educacionais
  • rastreamento de inventário
  • Monitoramento de desempenho

Principais recursos

  • Gráficos roláveis
  • Cores e estilos personalizáveis
  • Visualização de barras em camadas
  • design responsivo
  • Suporte independente de plataforma
  • Atualizações dinâmicas de dados

Indicado para

  • Desenvolvedores de aplicativos com grande volume de dados
  • Designers de UI que precisam de gráficos interativos
  • Equipes trabalhando em projetos multiplataforma
  • Aplicações focadas em análise
  • Visualização de dados em tempo real

Considerações

  • Requer conhecimento das estruturas de dados do gráfico
  • Pode ser necessário gerenciamento de estado adicional para interações complexas
  • Impacto no desempenho com conjuntos de dados muito grandes
  • Dicas ou anotações internas limitadas
  • Estilos personalizados podem exigir código adicional

README original

Snapshot do README original do repositório-fonte vinculado. Consulte o repositório para o conteúdo mais recente.

stacked_bar_chart

A Flutter package for creating different types of charts.This package gives developer the flexibility to customize their graph as well.

img

Features

  1. Plot graphs

    • Stacked Rounded Rectangle Graph
    • Stacked Rectangele Graph
    • Net Line Graph
    • Net Point Graph
  2. Customize your graph

    • Select if you want to display the net line
    • change core color,line color as well as line width of the net line
  3. Scrollable

    • The graphs plotted are scrollable
  4. Provide data in json format

    • You can use the toMap() and forMap() methods to provide your data in json format
  5. Style your Labels

    • You can style both you X-axis and Y-axis Labels.
  6. Callback on bar tap

    • A callback is provided on tap of each bar. Developer can use this feature as per their need.

Installation

In the dependencies: section of your pubspec.yaml, add the following line:

stacked_bar_chart:

Then import it as :

import 'package:stacked_bar_chart/stacked_bar_chart.dart';

Graph Types

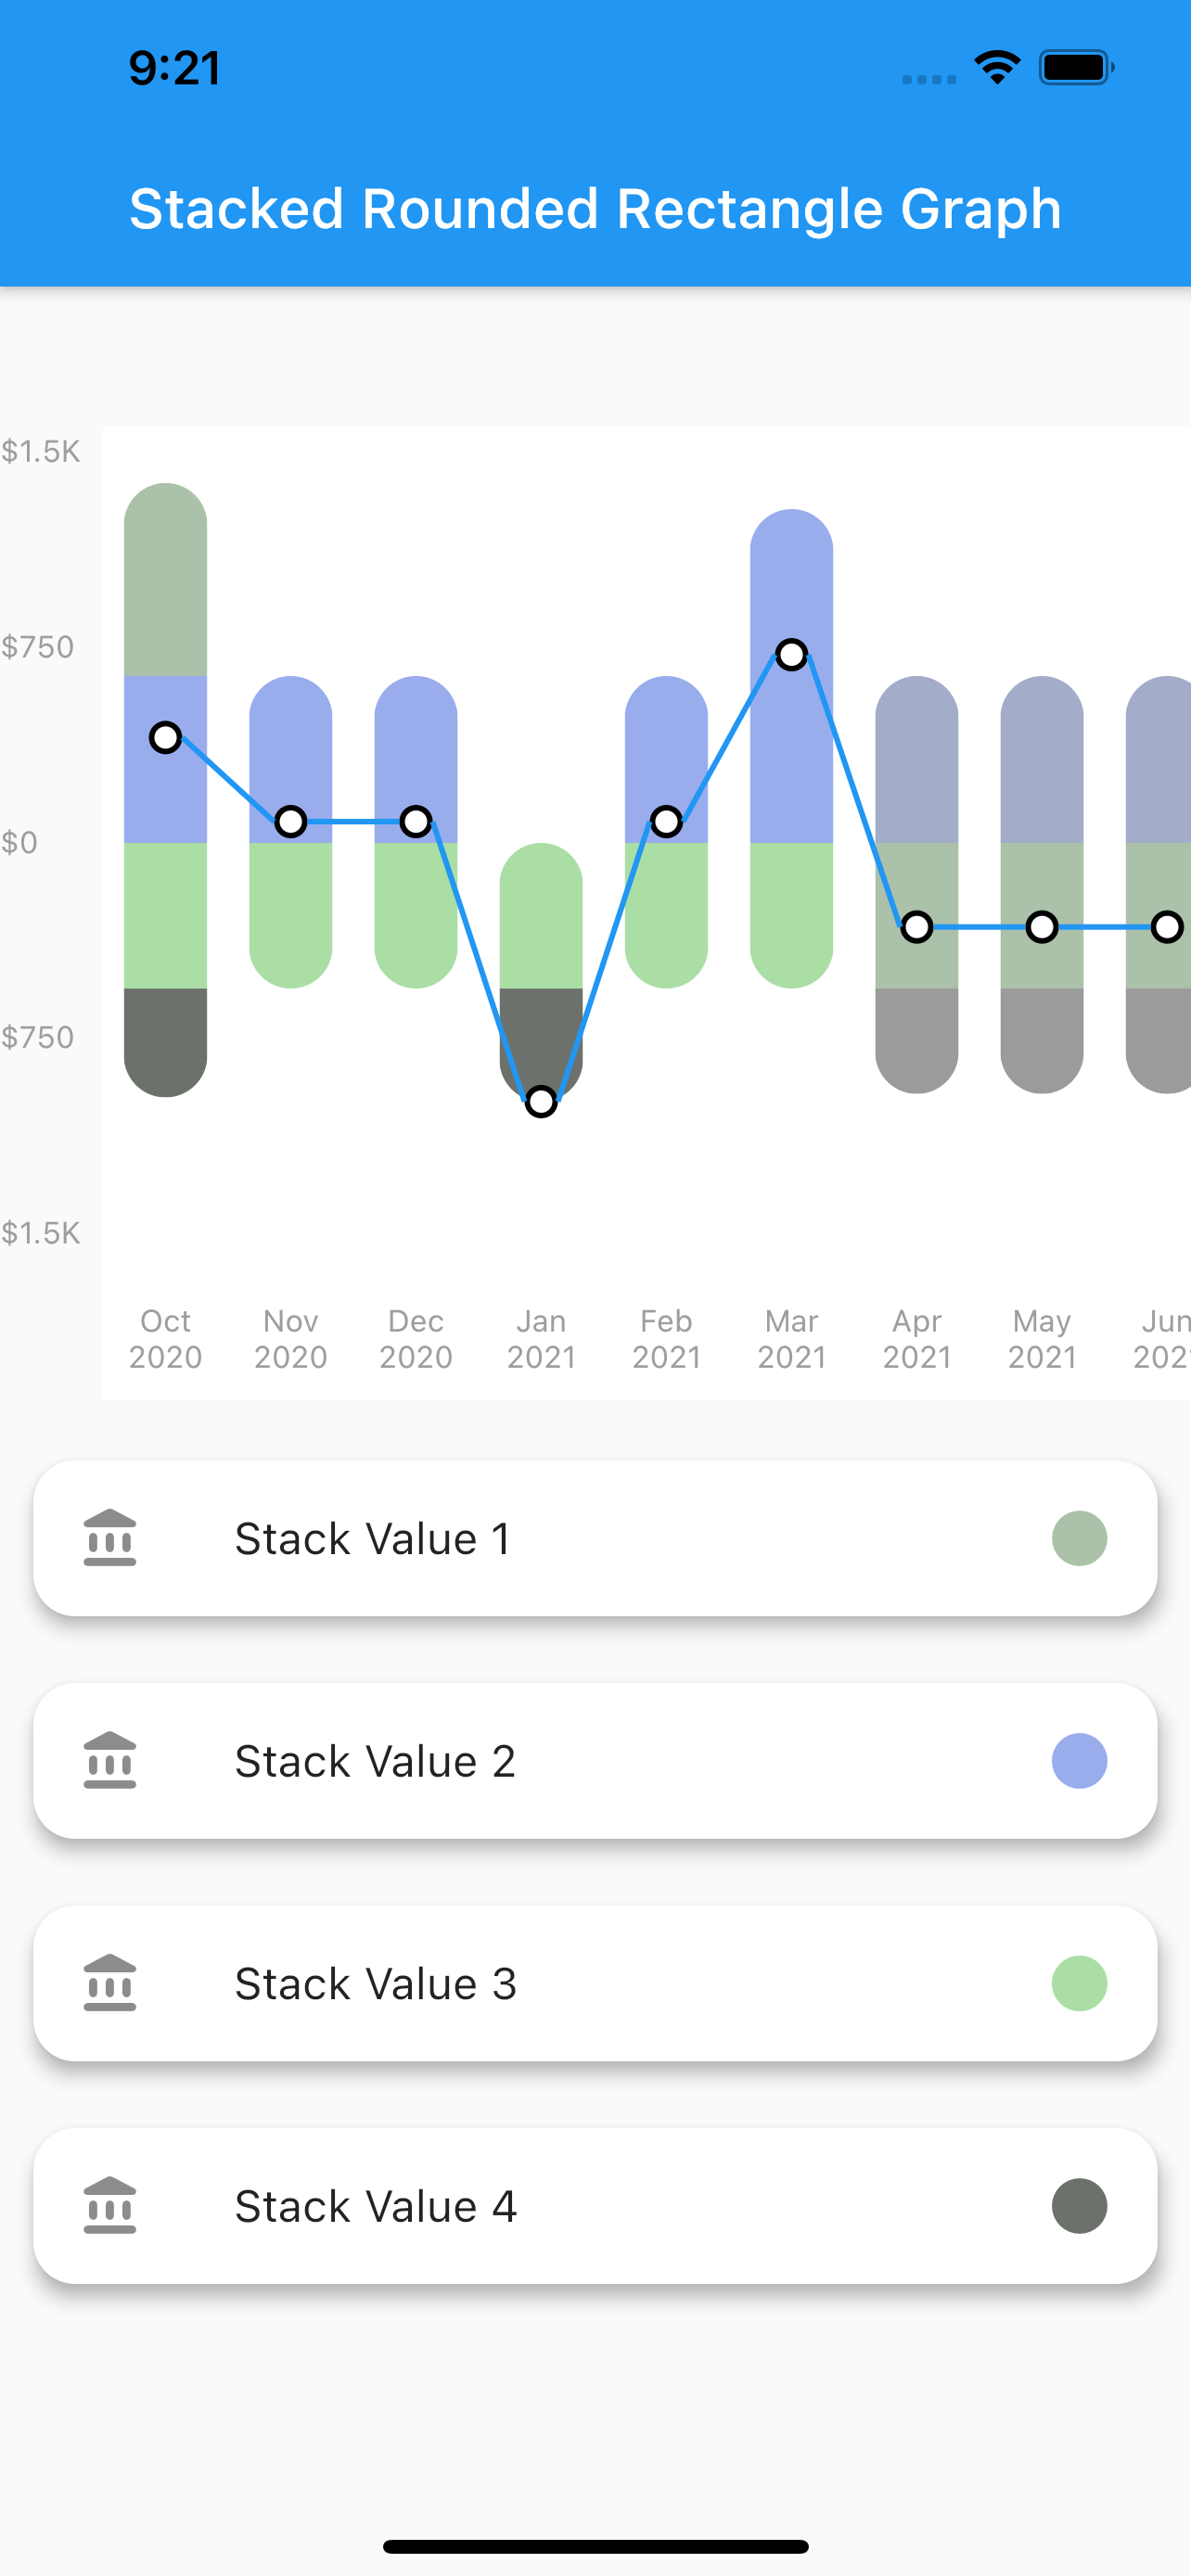
1. Stacked Rounded Rectangle Graph

  • A simple stacked bar graph with rounded borders.

img

  • To plot this graph pass the GraphType.StackedRounded in graphType. as shown below
graphType: GraphType.StackedRounded

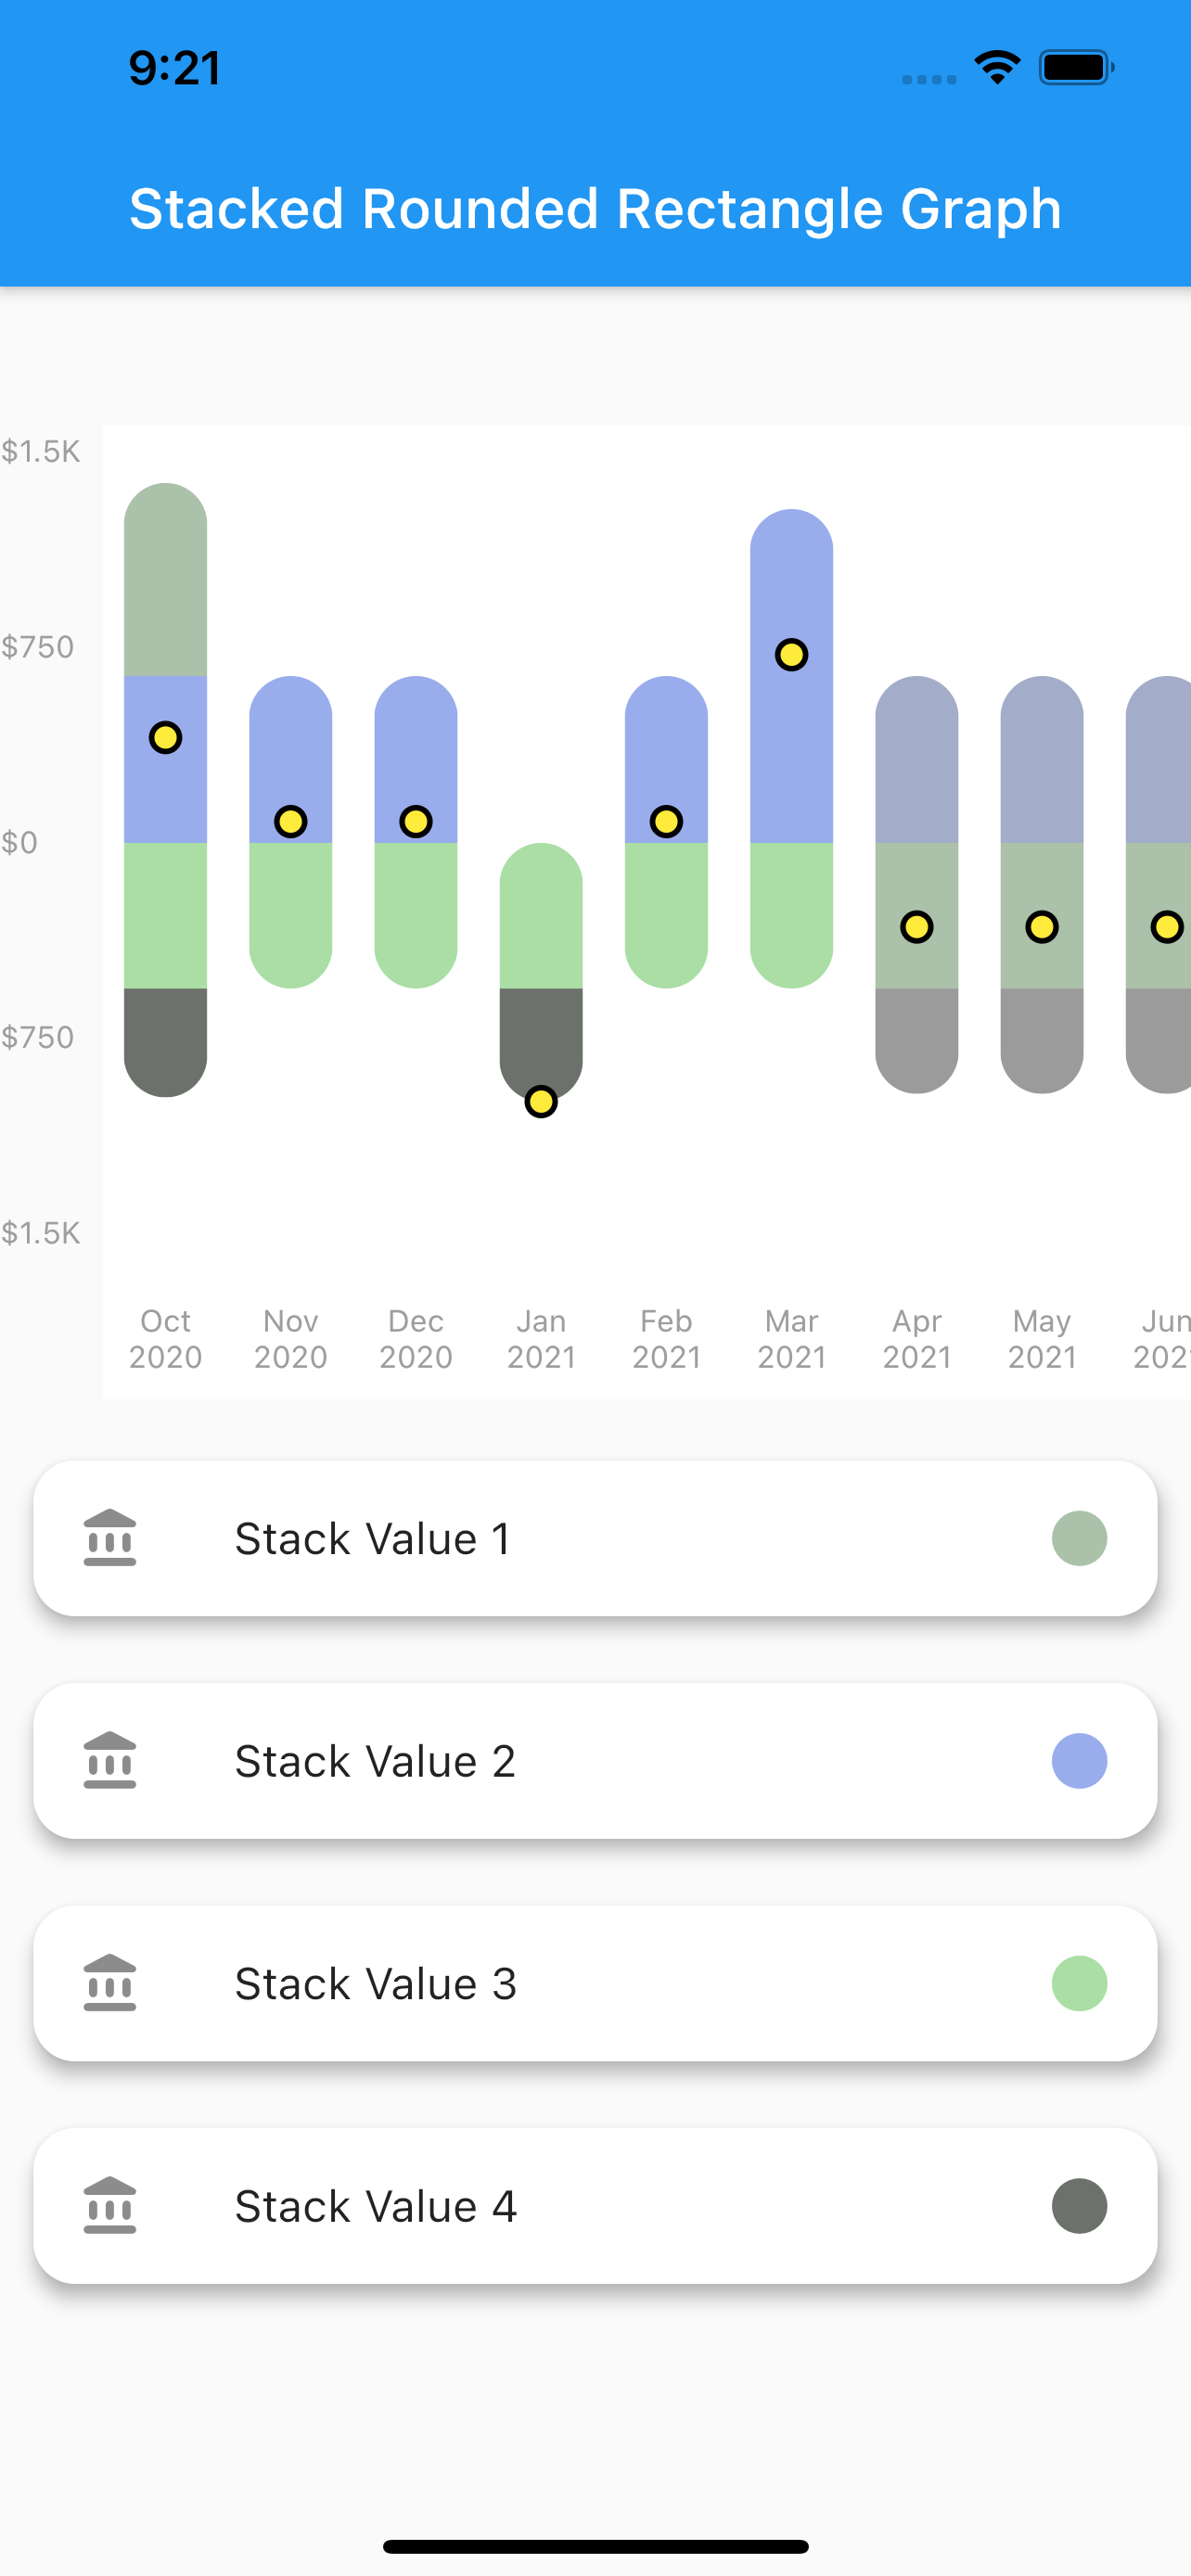
You can also change the styling of the line and point plotted.The color,width etc. can be changed using the netLine parameter as :

netLine: NetLine(
                showPointOnly: false,
                showLine: true,
                lineColor: Colors.blue,
                pointBorderColor: Colors.black,
                coreColor: Colors.white,
              ),

img img img

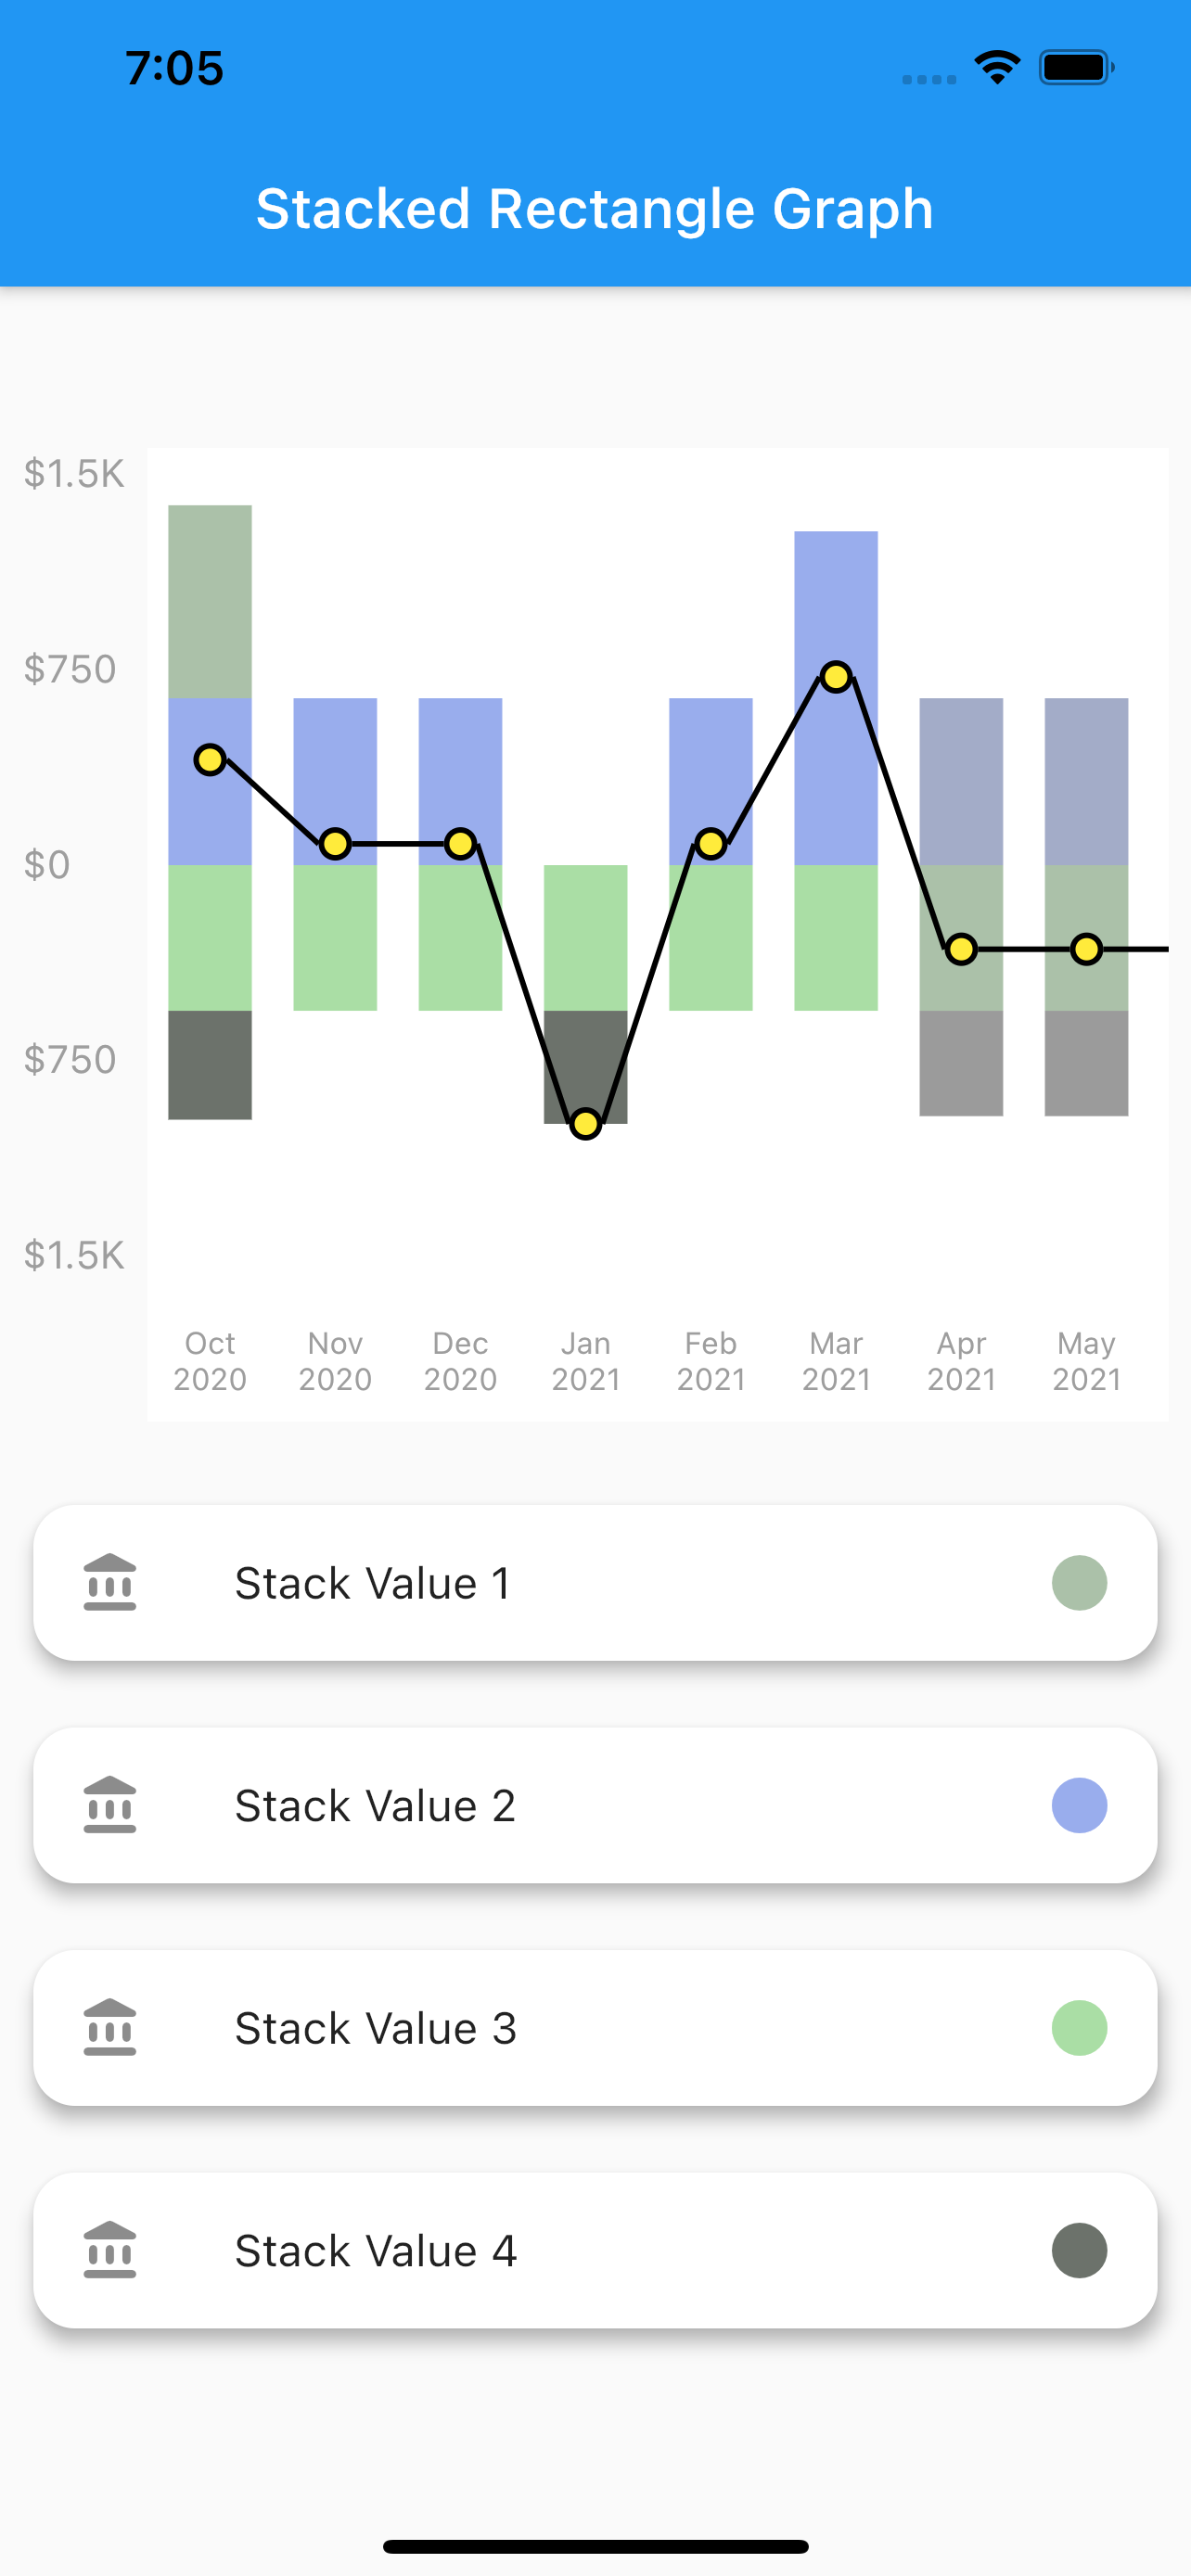
2. Stacked Rectangle Graph

  • A simple stacked bar graph with no rounded borders. You can customize it in the same way as the stacked rounded rectangle graph.

  • To plot this graph pass the GraphType.StackedRect in graphType. as shown below

graphType: GraphType.StackedRect

img img img

3. Net Line Graph

  • A simple line graph plotted with the net values of the data provided. The net values of a particular data is calculated and plotted.It can also be customized in the same way as stacked rounded rectangle graph.

  • To plot this graph pass the GraphType.StackedRect in graphType. as shown below

graphType: GraphType.LineGraph

img

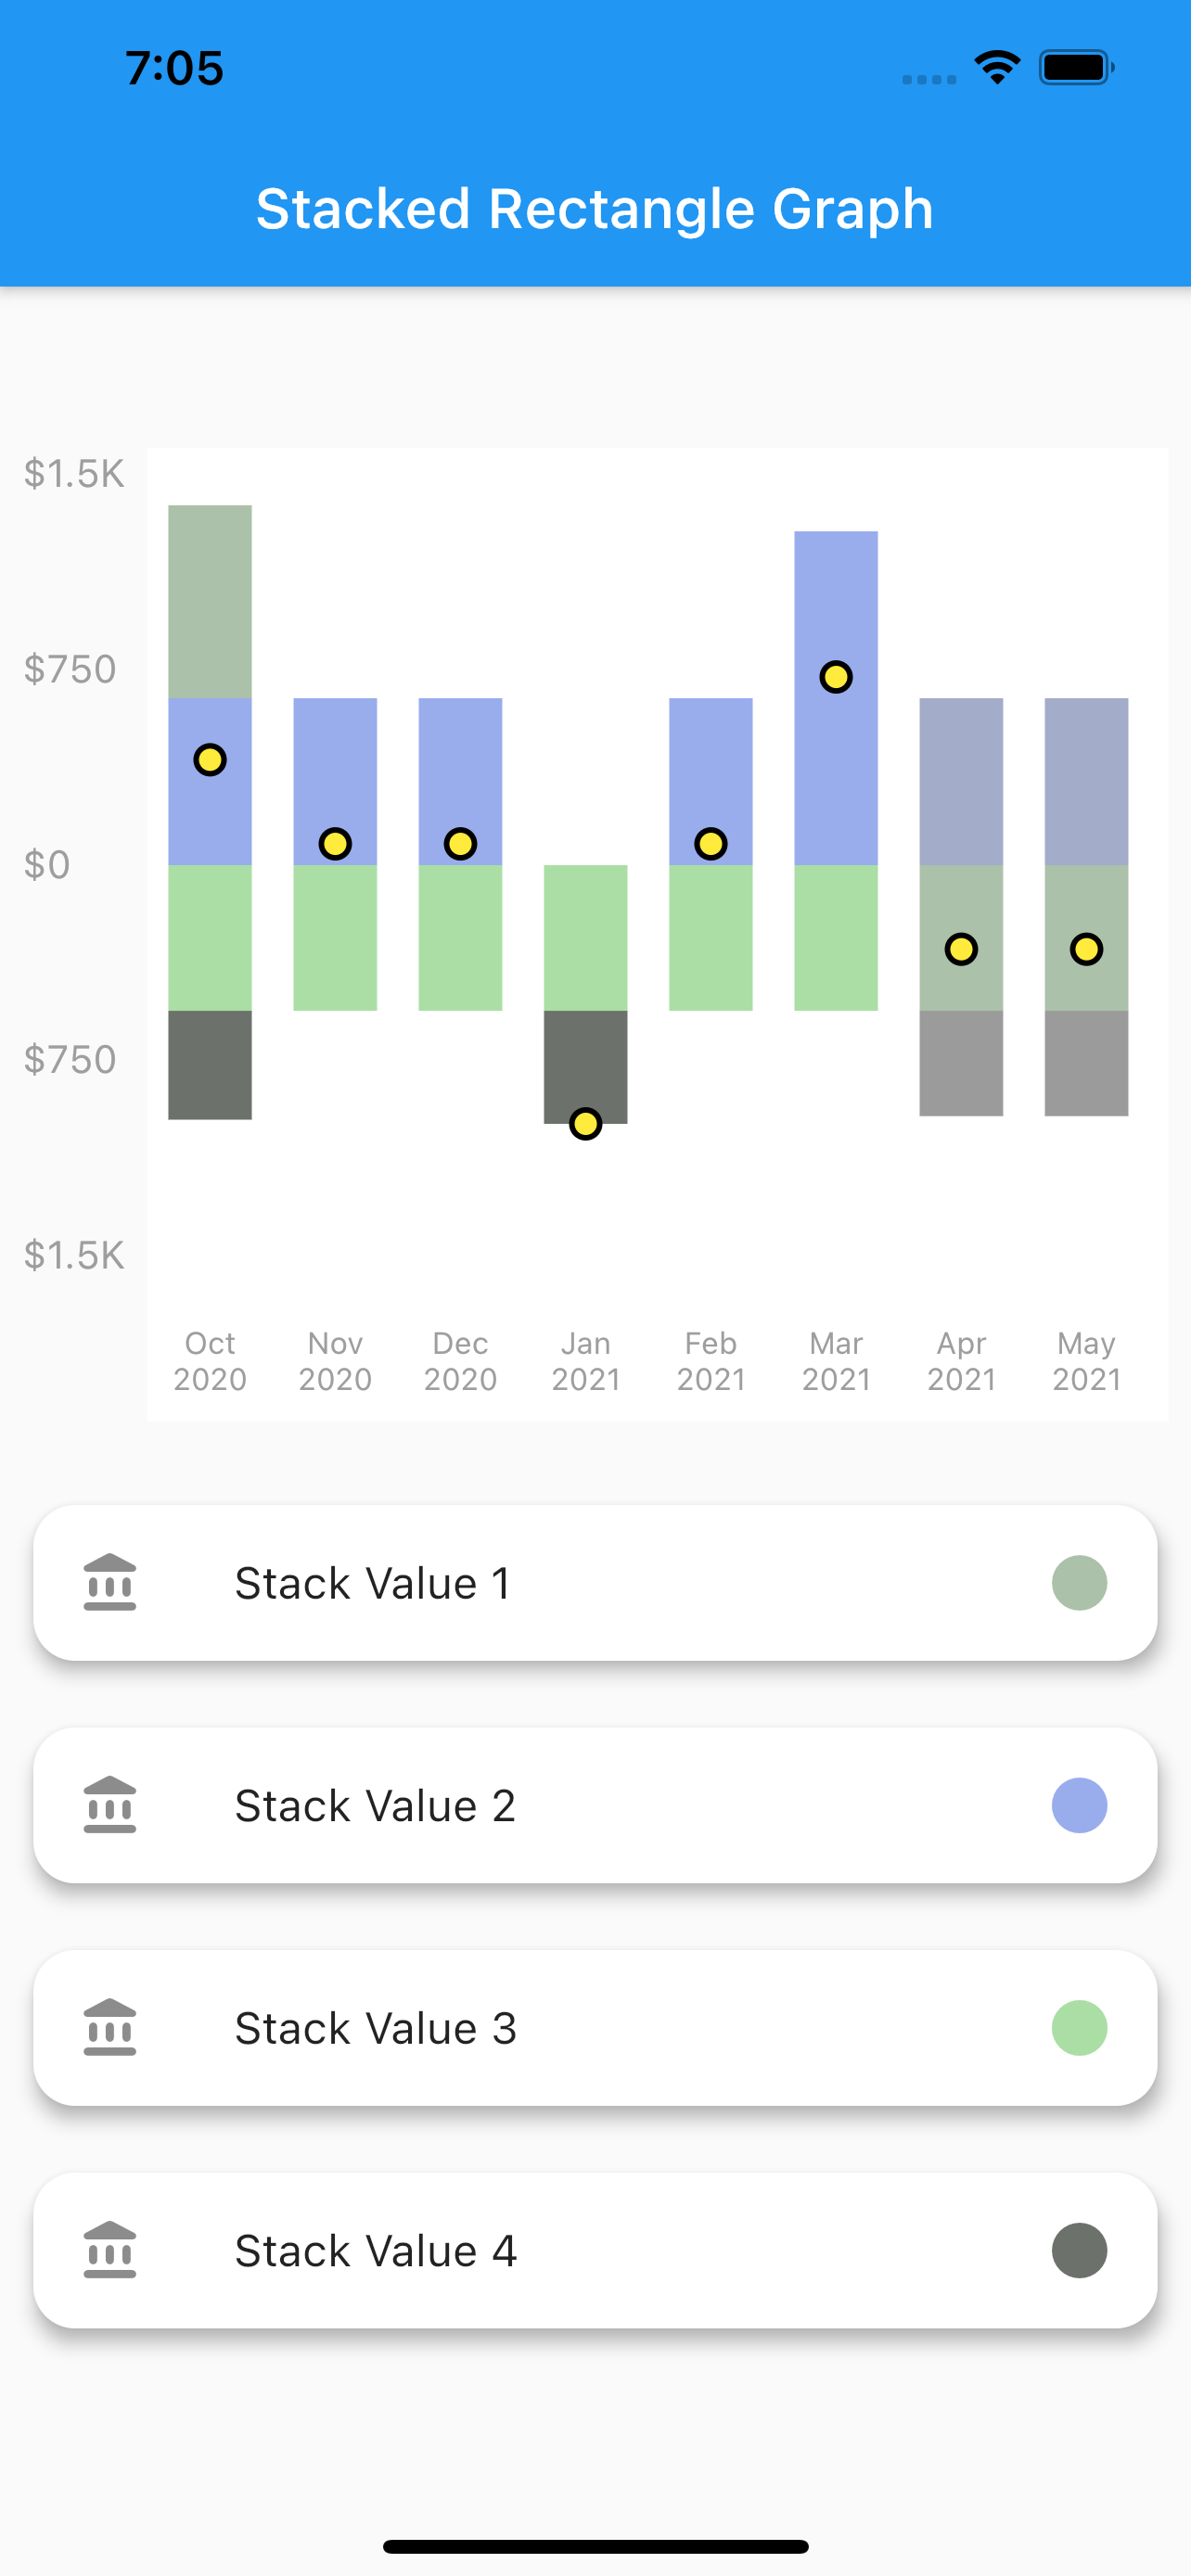
4. Net Point Graph

  • A simple plot of the net values of the data.You can customize the point core and it's outer border using the netPoint parameter.

  • To plot this graph pass the GraphType.StackedRect in graphType. and then pass parameters in netLine to remove the line as shown below

graphType: GraphType.LineGraph
netLine: NetLine(
                showPointOnly: true,
                showLine: false,
                lineColor: Colors.blue,
                pointBorderColor: Colors.black,
                coreColor: Colors.white,
              ),

img

USAGE

class StackedBarGraph extends StatefulWidget {
  StackedBarGraph({Key key}) : super(key: key);

  @override
  _StackedBarGraphState createState() => _StackedBarGraphState();
}

class _StackedBarGraphState extends State<StackedBarGraph> {
  @override
  Widget build(BuildContext context) {
    return Scaffold(
      appBar: AppBar(
        title: Text("Stacked Rounded Rectangle Graph"),
      ),
      body: Column(
        children: [
          SizedBox(
            height: 50,
          ),
          Graph(
            yLabelConfiguration: YLabelConfiguration(
              yLabelStyle: TextStyle(
                color: Colors.grey,
                fontSize: 11,
              ),
              interval: 500,
              labelCount: 5,
              yLabelMapper: (num value) {
                return NumberFormat.compactCurrency(
                        locale: "en", decimalDigits: 0, symbol: "\$")
                    .format(value);
              },
            ),
            xLabelConfiguration: XLabelConfiguration(
              xLabelStyle: TextStyle(
                color: Colors.grey,
                fontSize: 11,
              ),
              xLabelMapper: (DateTime date) {
                return DateFormat("MMM yyyy").format(date);
              },
            ),
            netLine: NetLine(
              showLine: true,
              lineColor: Colors.black,
              pointBorderColor: Colors.black,
              coreColor: Colors.yellow,
            ),
            graphType: GraphType.StackedRounded,
            data: GraphData(
              backgroundColor: Colors.white,
              name: "ThePension",
              bars: [
                GraphBar(
                  month: DateTime(2020, 01),
                  sections: [
                    GraphBarSection(value: 200, color: Colors.pink),
                    GraphBarSection(value: 900, color: Colors.blue),
                    GraphBarSection(value: -200, color: Colors.amber),
                    GraphBarSection(value: -700, color: Colors.purple),
                  ],
                ),
                GraphBar(
                  month: DateTime(2020, 2),
                  sections: [
                    GraphBarSection(value: 300, color: Colors.pink),
                    GraphBarSection(value: 700, color: Colors.blue),
                    GraphBarSection(value: -400, color: Colors.amber),
                    GraphBarSection(value: -600, color: Colors.purple),
                  ],
                ),
                GraphBar(
                  month: DateTime(2020, 3),
                  sections: [
                    GraphBarSection(value: 400, color: Colors.pink),
                    GraphBarSection(value: 700, color: Colors.blue),
                    GraphBarSection(value: -100, color: Colors.amber),
                    GraphBarSection(value: -900, color: Colors.purple),
                  ],
                ),
                GraphBar(
                  month: DateTime(2020, 4),
                  sections: [
                    GraphBarSection(value: 400, color: Colors.pink),
                    GraphBarSection(value: 0, color: Colors.blue),
                    GraphBarSection(value: -800, color: Colors.amber),
                    GraphBarSection(value: -400, color: Colors.purple),
                  ],
                ),
                GraphBar(
                  month: DateTime(2020, 5),
                  sections: [
                    GraphBarSection(value: 700, color: Colors.pink),
                    GraphBarSection(value: 900, color: Colors.blue),
                    GraphBarSection(value: -200, color: Colors.amber),
                    GraphBarSection(value: -100, color: Colors.purple),
                  ],
                ),
                GraphBar(
                  month: DateTime(2020, 6),
                  sections: [
                    GraphBarSection(value: 900, color: Colors.pink),
                    GraphBarSection(value: 900, color: Colors.blue),
                    GraphBarSection(value: -200, color: Colors.amber),
                    GraphBarSection(value: -100, color: Colors.purple),
                  ],
                ),
                GraphBar(
                  month: DateTime(2020, 7),
                  sections: [
                    GraphBarSection(value: 300, color: Colors.pink),
                    GraphBarSection(value: 800, color: Colors.blue),
                    GraphBarSection(value: -200, color: Colors.amber),
                    GraphBarSection(value: -1100, color: Colors.purple),
                  ],
                ),
                GraphBar(
                  month: DateTime(2020, 8),
                  sections: [
                    GraphBarSection(value: 250, color: Colors.pink),
                    GraphBarSection(value: 980, color: Colors.blue),
                    GraphBarSection(value: -210, color: Colors.amber),
                    GraphBarSection(value: -720, color: Colors.purple),
                  ],
                ),
                GraphBar(
                  month: DateTime(2020, 9),
                  sections: [
                    GraphBarSection(value: 300, color: Colors.pink),
                    GraphBarSection(value: 200, color: Colors.blue),
                    GraphBarSection(value: -200, color: Colors.amber),
                    GraphBarSection(value: -400, color: Colors.purple),
                  ],
                ),
                GraphBar(
                  month: DateTime(2020, 10),
                  sections: [
                    GraphBarSection(value: 200, color: Colors.pink),
                    GraphBarSection(value: 900, color: Colors.blue),
                    GraphBarSection(value: -200, color: Colors.amber),
                    GraphBarSection(value: -700, color: Colors.purple),
                  ],
                ),
              ],
            ),
            onBarTapped: (GraphBar bar) {
              print(bar.month);
            },
          ),
        ],
      ),
    );
  }
}

Categorias

Dependências

Lista de dependências 2 itens

Repositório-fonte

Projetos que usam este pacote

Ainda não há dados.