
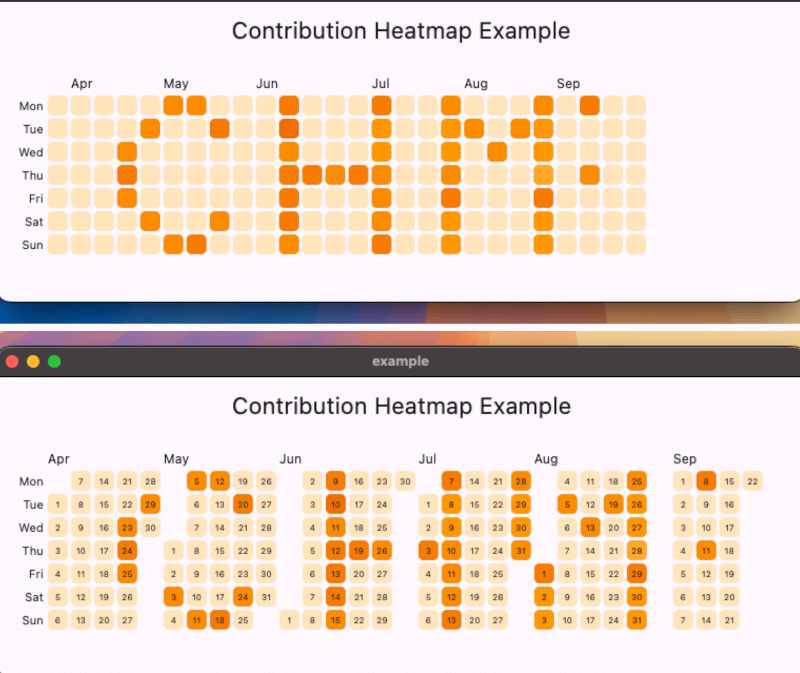
套件概覽
一個高效率的、類似 GitHub 的貢獻熱力圖日曆小工具,適用於 Flutter。使用自訂 RenderBox 建構,以達到最佳效能與流暢的渲染,讓開發者能透過完整的自訂選項來視覺化使用者隨時間的活動。非常適合儀表板、分析應用程式或個人生產力工具,此元件支援動態資料更新,並在所有平台實現響應式設計。它模擬了 GitHub 廣受歡迎的貢獻圖表,提供熟悉且直覺的介面來追蹤進度。
適用情境
- 使用者活動追蹤
- 生產力儀表板
- 開發者分析
- 進度可視化
- 團隊績效監控
主要特色
- 用於高效率的自訂 RenderBox
- 完整的主題和樣式自訂
- 跨平台的響應式佈局
- 動態資料更新
- 支援多種色彩方案
- 流暢的動畫
適合對象
- 分析應用程式
- 開發者工具
- 個人習慣追蹤器
- 儀表板小部件
- 跨平台應用
使用建議
- 需要手動資料對應貢獻
- 有限的內建互動功能
- 最適合靜態或週期性資料
- 可能需要額外的樣式來支援複雜主題
- 未針對非常大的資料集進行優化