[!WARNING]
This package is no longer under active development. Please see this comment. The official analysis_server_plugin is now the recommended approach for building custom lints.
Lint rules are a powerful way to improve the maintainability of a project.
The more, the merrier!
But while Dart offers a wide variety of lint rules by default, it cannot
reasonably include every possible lint. For example, Dart does not
include lints related to third-party packages.
Custom_lint fixes that by allowing package authors to write custom lint rules.
Custom_lint is similar to analyzer_plugin, but goes deeper by trying to
provide a better developer experience.
That includes:
A command-line to obtain the list of lints in your CI
without having to write a command line yourself.
A simplified project setup:
No need to deal with the analyzer server or error handling. Custom_lint
takes care of that for you, so that you can focus on writing lints.
Debugger support.
Inspect your lints using the Dart debugger and place breakpoints.
Supports hot-reload/hot-restart:
Updating the source code of a linter plugin will dynamically restart it,
without having to restart your IDE/analyzer server.
Built-in support for // ignore: and // ignore_for_file:.
Support for print(...) and exceptions:
If your plugin somehow throws or print debug messages, custom_lint
will generate a log file with the messages/errors.
Usage
Using custom_lint is split in two parts:
how to define a custom_lint package
how users can install our package in their application to see our newly defined lints
Creating a custom lint package
To create a custom lint, you will need two things:
updating your pubspec.yaml to include custom_lint_builder as a dependency:
# pubspec.yamlname:my_custom_lint_packageenvironment:sdk:">=3.0.0 <4.0.0"dependencies:# we will use analyzer for inspecting Dart filesanalyzer:analyzer_plugin:# custom_lint_builder will give us tools for writing lintscustom_lint_builder:
create a lib/<my_package_name>.dart file in your project with the following:
import'package:analyzer/error/listener.dart';
import'package:custom_lint_builder/custom_lint_builder.dart';
// This is the entrypoint of our custom linterPluginBasecreatePlugin() => _ExampleLinter();
/// A plugin class is used to list all the assists/lints defined by a plugin.class_ExampleLinterextendsPluginBase{
/// We list all the custom warnings/infos/errors@overrideList<LintRule> getLintRules(CustomLintConfigs configs) => [
MyCustomLintCode(),
];
}
classMyCustomLintCodeextendsDartLintRule{
MyCustomLintCode() : super(code: _code);
/// Metadata about the warning that will show-up in the IDE./// This is used for `// ignore: code` and enabling/disabling the lintstaticconst _code = LintCode(
name: 'my_custom_lint_code',
problemMessage: 'This is the description of our custom lint',
);
@overridevoidrun(
CustomLintResolver resolver,
ErrorReporter reporter,
CustomLintContext context,
) {
// Our lint will highlight all variable declarations with our custom warning.
context.registry.addVariableDeclaration((node) {
// "node" exposes metadata about the variable declaration. We could// check "node" to show the lint only in some conditions.// This line tells custom_lint to render a warning at the location of "node".// And the warning shown will use our `code` variable defined above as description.
reporter.atNode(node, code);
});
}
}
That's it for defining a custom lint package!
If you're looking for a more advanced example, see the example.
This example implements:
a lint appearing on all variables of a specific type
a quick fix for that lint
an "assist" for providing refactoring options.
Let's now use it in an application.
Using our custom lint package in an application
For users to run custom_lint packages, there are a few steps:
The application must contain an analysis_options.yaml with the following:
analyzer:plugins:-custom_lint
The application also needs to add custom_lint and our package(s) as dev
dependency in their application:
# The pubspec.yaml of an application using our lintsname:example_appenvironment:sdk:">=3.0.0 <4.0.0"dev_dependencies:custom_lint:my_custom_lint_package:
That's all!
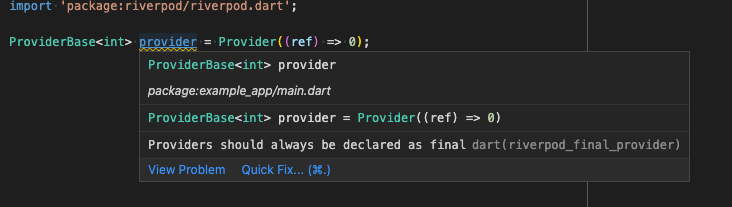
After running pub get (and possibly restarting their IDE), users should now
see our custom lints in their Dart files:
Enabling/disabling and configuring lints
By default, custom_lint enables all installed lints.
But chances are you may want to disable one specific lint,
or alternatively, disable all lints besides a few.
This configuration is done in your analysis_options.yaml,
but in a slightly different manner.
Configurations are placed within a custom_lint object, as
followed:
analyzer:plugins:-custom_lintcustom_lint:rules:-my_lint_rule:false# disable this rule
As mentioned before, all lints are enabled by default.
custom_lint:# Disable all lints by defaultenable_all_lint_rules:falserules:-my_lint_rule# only enable my_lint_rule
If you want to change this, you can optionally disable
all lints by default:
Last but not least, some lint rules may be configurable.
When a lint is configurable, you can configure it in the same place with:
Unfortunately, running dart analyze does not pick up our newly defined lints.
We need a separate command for this.
To do that, users of our custom lint package can run the following inside their terminal:
$ dart run custom_lint
  lib/main.dart:0:0 • This is the description of our custom lint • my_custom_lint_code
If you are working on a Flutter project, run flutter pub run custom_lint instead.
Using the Dart debugger and enabling hot-reload
By default, custom_lint does enable hot-reload or give you the necessary
information to start the debugger. This is because most users don't need those,
and only lint authors do.
If you wish to debug lints, you'll have to update your analysis_options.yaml as followed:
analyzer:plugins:-custom_lintcustom_lint:debug:true# Optional, will cause custom_lint to log its internal debug informationverbose:true
Then, to debug plugins in custom_lint, you need to connect to plugins using "attach"
mode in your IDE (cmd+shift+p + Debug: attach to Dart process in VSCode).
When using this command, you will need a VM service URI provided by custom_lint.
There are two possible ways to obtain one:
if you started your plugin using custom_lint --watch, it should be visible
in the console output.
if your plugin is started by your IDE, you can open the custom_lint.log file
that custom_lint created next to the pubspec.yaml of your analyzed projects.
In both cases, what you're looking for is logs similar to:
TheDart VM service is listening on http://127.0.0.1:60671/9DS43lRMY90=/TheDartDevTools debugger and profiler is available at: http://127.0.0.1:60671/9DS43lRMY90=/devtools/#/?uri=ws%3A%2F%2F127.0.0.1%3A60671%2F9DS43lRMY90%3D%2Fws
What you'll want is the first URI. In this example, that is http://127.0.0.1:60671/9DS43lRMY90=/.
You can then pass this to your IDE, which should now be able to attach to the
plugin.
Testing your plugins
Testing lints
Custom_lint comes with an official testing mechanism for asserting that your
plugins correctly work.
Testing lints is straightforward: Simply write a file that should contain
lints from your plugin (such as the example folder). Then, using a syntax
similar to // ignore, write a // expect_lint: code in the line before
your lint:
The line after the expect_lint correctly contains the expected lint.
In that case, the lint is ignored (similarly to if we used // ignore)
The next line does not contain the lint.
In that case, the expect_lint comment will have an error.
This allows testing your plugins by simply running custom_lint on your test/example folder.
Then, if any expected lint is missing, the command will fail. But if your plugin correctly
emits the lint, the command will succeed.
Testing quick fixes and assists
Testing quick fixes and assists is also possible with regular tests by combining them with
pkg:analyzer to manually execute the assists or fixes. An example can be found in the
Riverpod repository.