Buscar pacotes, repositórios e categorias de apps

Capa de awesome_circular_chart
Detalhes do pacotev1.1.0

awesome_circular_chart

Gráficos radiais e de pizza animados para Flutter

AndroidiOSWebmacOSWindowsLinux
Downloads em 30 dias
6,4 mil
Curtidas
38
Pontos Pub
140

Instalar pacote

flutter pub add awesome_circular_chart

Visão geral do pacote

Orientação gerada a partir de informações públicas. Apenas para referência.

Um pacote Flutter para criar gráficos radiais e de pizza animados com transições suaves. Ele fornece gráficos circulares personalizáveis e visualmente atraentes ideais para painéis, visualização de dados e interfaces de relatórios. O pacote suporta múltiplas plataformas, incluindo Android, iOS, Web, macOS, Windows e Linux, garantindo desempenho consistente em dispositivos diferentes. Com APIs intuitivas, os desenvolvedores podem integrar facilmente gráficos dinâmicos que respondem em tempo real às mudanças nos dados.

Casos de uso

  • Widgets do painel
  • Interfaces de relatório de dados
  • Análise interativa
  • Visualização de dados em tempo real
  • Aplicativos educacionais

Principais recursos

  • Gráficos radiais e de pizza animados
  • Efeitos de transição suave
  • Cores e rótulos personalizáveis
  • design responsivo
  • Suporte multiplataforma
  • Integração fácil com o Flutter

Indicado para

  • Projetos de visualização de dados
  • Painéis móveis e web
  • Aplicativos que exigem gráficos interativos
  • Desenvolvedores procurando soluções simples de gráficos
  • Projetos com atualizações de dados em tempo real

Considerações

  • Limitado a tipos de gráfico circular
  • Pode afetar o desempenho com grandes conjuntos de dados
  • Requer um manuseio cuidadoso do tempo de animação
  • Não adequado para gráficos complexos com múltiplas séries
  • Melhor para visualizações simples e focadas

README original

Snapshot do README original do repositório-fonte vinculado. Consulte o repositório para o conteúdo mais recente.

pub package

Awesome Circular Chart

Fork from Flutter Circular Chart

A library for creating animated circular chart widgets with Flutter, inspired by Zero to One with Flutter.

Overview

Create easily animated pie charts and radial charts by providing them with data objects they can plot into charts and animate between.

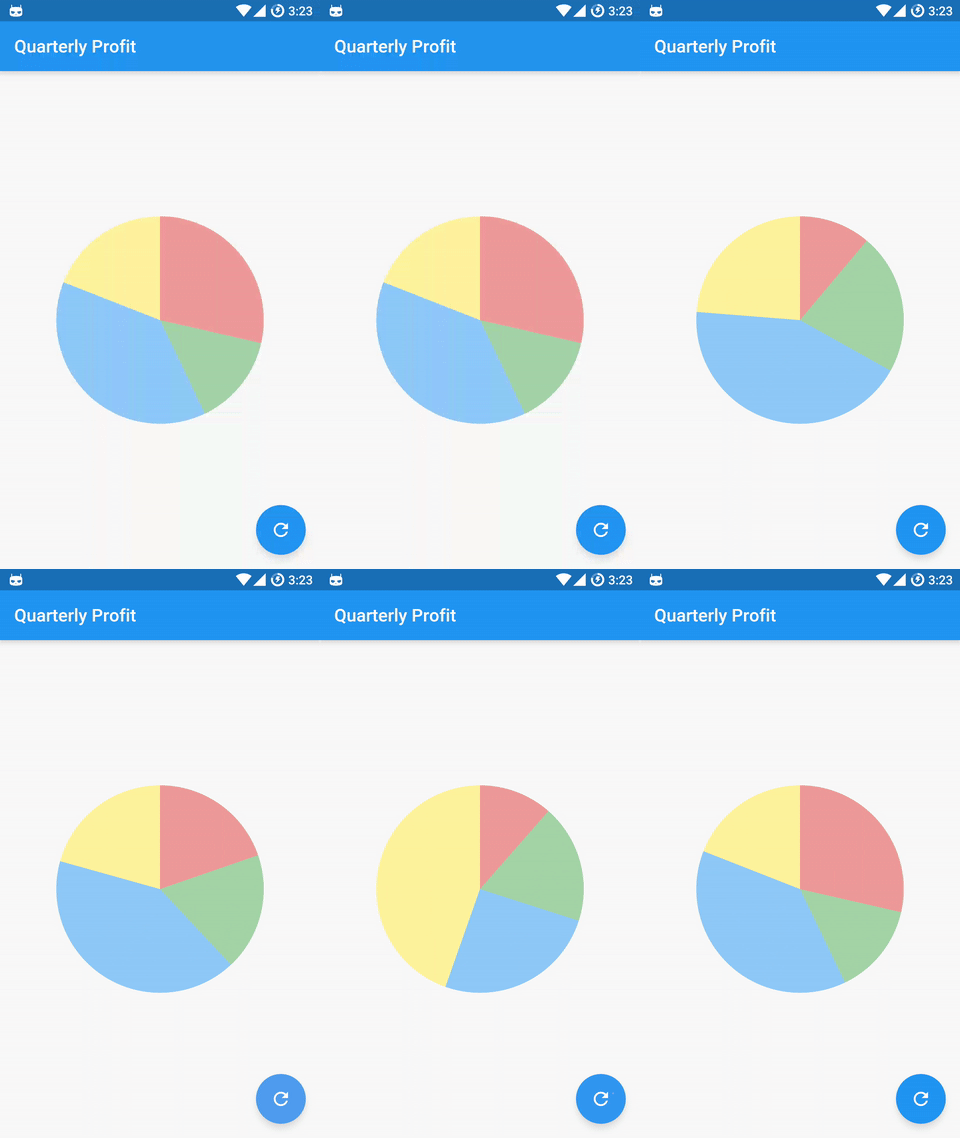
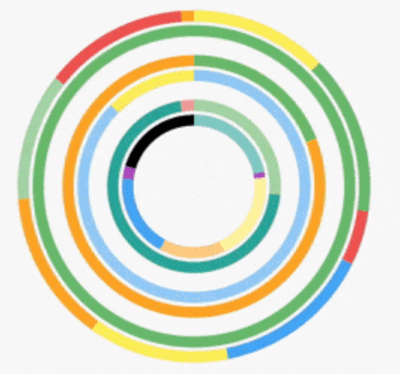
animated_random_radial_chart

animated pie chart animated radial chart

Check the examples folder for the source code for the above screenshots.

Contents:

Installation

Install the latest version from pub.

Getting Started

Import the package:

import 'package:awesome_circular_chart/awesome_circular_chart.dart';

Create a GlobalKey to be able to access the chart and update its data:

final GlobalKey<AnimatedCircularChartState> _chartKey = new GlobalKey<AnimatedCircularChartState>();

Create chart data entry objects:

List<CircularStackEntry> data = <CircularStackEntry>[
  new CircularStackEntry(
    <CircularSegmentEntry>[
      new CircularSegmentEntry(500.0, Colors.red[200], rankKey: 'Q1'),
      new CircularSegmentEntry(1000.0, Colors.green[200], rankKey: 'Q2'),
      new CircularSegmentEntry(2000.0, Colors.blue[200], rankKey: 'Q3'),
      new CircularSegmentEntry(1000.0, Colors.yellow[200], rankKey: 'Q4'),
    ],
    rankKey: 'Quarterly Profits',
  ),
];

Create an AnimatedCircularChart, passing it the _chartKey and initial data:

@override
Widget build(BuildContext context) {
  return new AnimatedCircularChart(
    key: _chartKey,
    size: const Size(300.0, 300.0),
    initialChartData: data,
    chartType: CircularChartType.Pie,
  );
}

Call updateData to animate the chart:

void _cycleSamples() {
  List<CircularStackEntry> nextData = <CircularStackEntry>[
    new CircularStackEntry(
      <CircularSegmentEntry>[
        new CircularSegmentEntry(1500.0, Colors.red[200], rankKey: 'Q1'),
        new CircularSegmentEntry(750.0, Colors.green[200], rankKey: 'Q2'),
        new CircularSegmentEntry(2000.0, Colors.blue[200], rankKey: 'Q3'),
        new CircularSegmentEntry(1000.0, Colors.yellow[200], rankKey: 'Q4'),
      ],
      rankKey: 'Quarterly Profits',
    ),
  ];
  setState(() {
    _chartKey.currentState.updateData(nextData);
  });
}

Customization

Hole Label:
Property Default
holeLabel null
labelStyle Theme.of(context).textTheme.body2

Example:

new AnimatedCircularChart(
  key: _chartKey,
  size: _chartSize,
  initialChartData: <CircularStackEntry>[
    new CircularStackEntry(
      <CircularSegmentEntry>[
        new CircularSegmentEntry(
          33.33,
          Colors.blue[400],
          rankKey: 'completed',
        ),
        new CircularSegmentEntry(
          66.67,
          Colors.blueGrey[600],
          rankKey: 'remaining',
        ),
      ],
      rankKey: 'progress',
    ),
  ],
  chartType: CircularChartType.Radial,
  percentageValues: true,
  holeLabel: '1/3',
  labelStyle: new TextStyle(
    color: Colors.blueGrey[600],
    fontWeight: FontWeight.bold,
    fontSize: 24.0,
  ),
)

hole label example screenshot


Segment Edge Style:
Property Default
edgeStyle SegmentEdgeStyle.flat
SegmentEdgeStyle Description
flat (default) Segments begin and end with a flat edge.
round Segments begin and end with a semi-circle.

Example:

new AnimatedCircularChart(
  key: _chartKey,
  size: _chartSize,
  initialChartData: <CircularStackEntry>[
    new CircularStackEntry(
      <CircularSegmentEntry>[
        new CircularSegmentEntry(
          33.33,
          Colors.blue[400],
          rankKey: 'completed',
        ),
        new CircularSegmentEntry(
          66.67,
          Colors.blueGrey[600],
          rankKey: 'remaining',
        ),
      ],
      rankKey: 'progress',
    ),
  ],
  chartType: CircularChartType.Radial,
  edgeStyle: SegmentEdgeStyle.round,
  percentageValues: true,
)

round segment edge example screenshot

Details

Chart data entries:

Charts expect a list of CircularStackEntry objects containing the data they need to be drawn.

Each CircularStackEntry corresponds to a complete circle in the chart. For radial charts that is one of the rings, for pie charts it is the whole pie.

Radial charts with multiple CircularStackEntrys will display them as concentric circles.

Each CircularStackEntry is composed of multiple CircularSegmentEntrys containing the value of a data point. In radial charts a segment corresponds to an arc segment of the current ring, for pie charts it is an individual slice.

Categorias

Repositório-fonte

Projetos que usam este pacote