Orientação gerada a partir de informações públicas. Apenas para referência.
fl_animated_linechart é um pacote Flutter para criar gráficos de linhas e áreas animados com desempenho suave mesmo em conjuntos de dados grandes. Ele suporta múltiplos eixos Y para comparar escalas de dados diferentes e possui um eixo X baseado em data/hora, ideal para visualizações de séries temporais. O pacote é otimizado para responsividade em várias plataformas, tornando-o adequado para exibições de dados em tempo real ou dinâmicas. Construído com o motor de renderização do Flutter, garante animações fluidas e atualizações eficientes sem comprometer a qualidade visual.
Casos de uso
Monitoramento de dados em tempo real
Análise de séries temporais
Painéis multi-métricos
Gráficos financeiros
Exploração interativa de dados
Principais recursos
Transições animadas
Suporte a múltiplos eixos Y
Eixo X de data/hora
Alto desempenho com grandes volumes de dados
Compatibilidade multiplataforma
Indicado para
Aplicativos de visualização de dados
Desenvolvedores de painel
Ferramentas de análise
Análise móvel e web
Interfaces de rastreamento em tempo real
Considerações
Requer um manuseio cuidadoso de grandes conjuntos de dados para manter a taxa de quadros
Personalização limitada além dos tipos principais de gráficos
Pode ser necessário estilização adicional para interfaces complexas
Mais adequado para padrões de dados lineares ou baseados no tempo
Depende de dependências externas para funcionalidades avançadas
README original
Snapshot do README original do repositório-fonte vinculado. Consulte o repositório para o conteúdo mais recente.
fl_animated_linechart
An animated chart library for flutter.
Support for datetime axis
Multiple y axis, supporting different units
Highlight selection
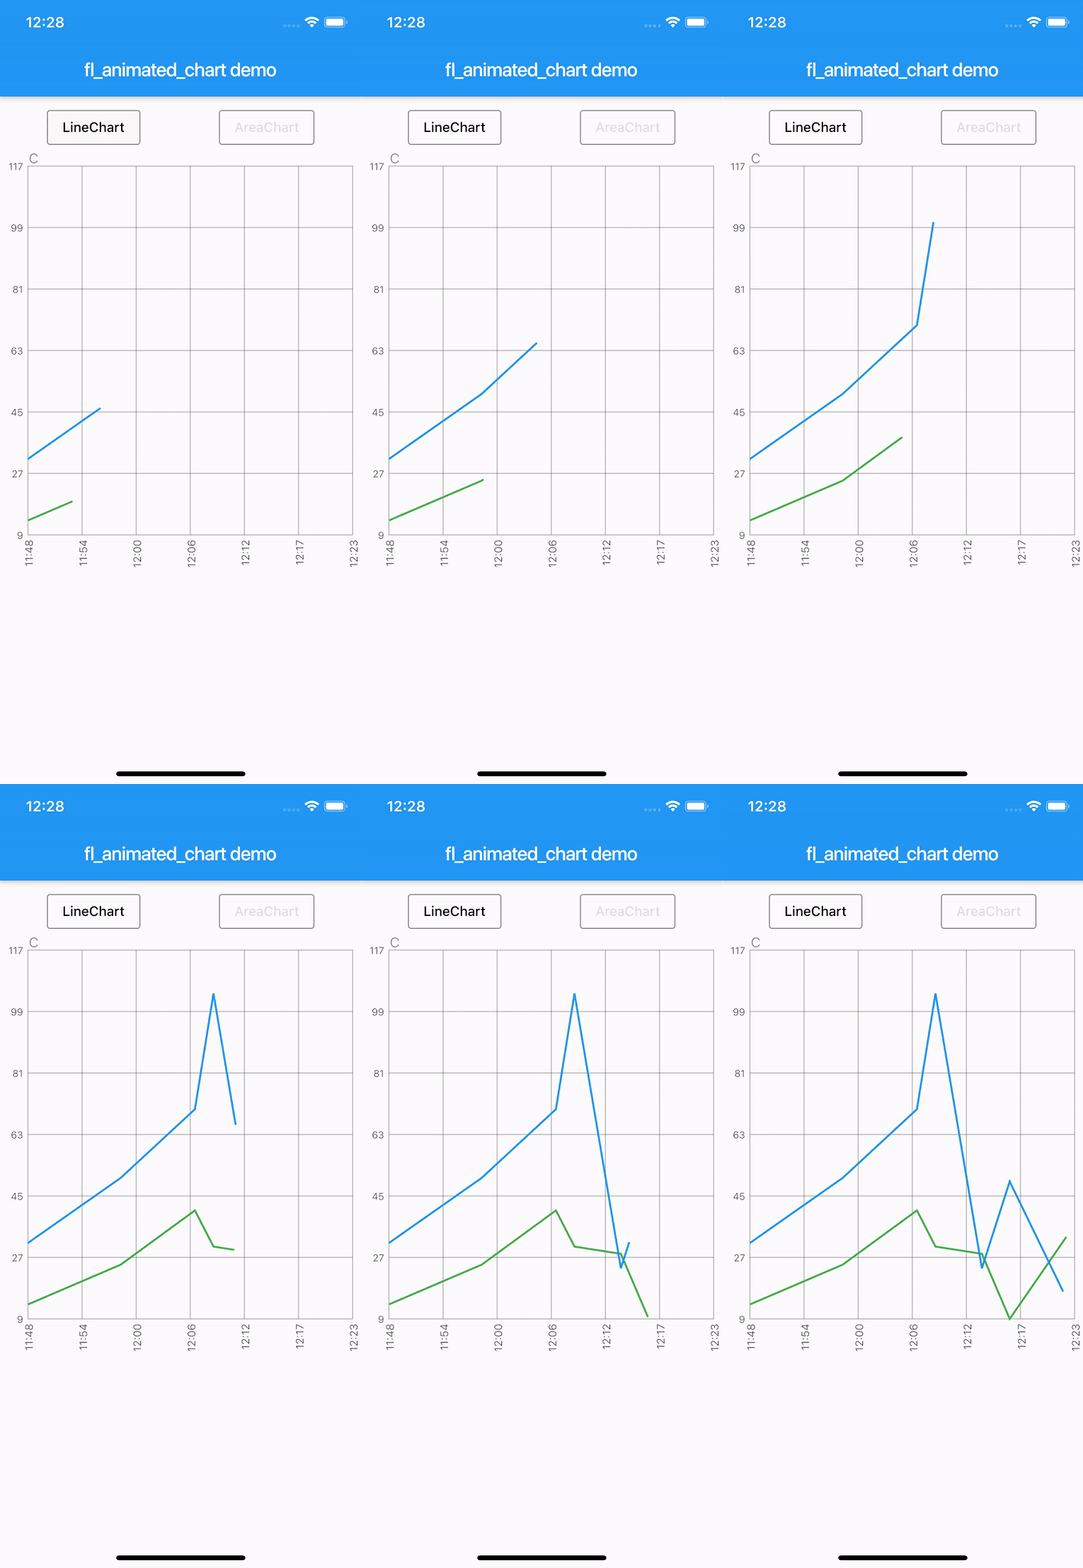
Animation of the chart
Possibility of adding legends
Support for both horizontal and vertical markerlines
Tested with more than 3000 points and still performing
There are currently two different charts:
line chart
area chart
Getting Started
Try the sample project or include in your project.
Highlight for the line chart:
Linechart with markerlines, icons, legends and "heat-map" shaded zones:
You can choose to either have a short line or an Icon as the first part of the legend before the title. It is possible set showLeadingLine to true, then a short line will be shown in the color you have defined.
You can change the Color of the line and Icon, and the TextStyle of the String title.
The length of the Legends list must to equal to the length of chartlines which have isMakerLine = true.
When orientation of the screen is in landscape mode, it is possible to have the legends drawn on the right hand side instead of below the graph.
Simply set legendsRightLandscapeMode: true
returnScaffold(
appBar: AppBar(
title: Text(widget.title),
),
body: Container(
child: Column(
mainAxisSize: MainAxisSize.max,
mainAxisAlignment: MainAxisAlignment.spaceBetween,
crossAxisAlignment: CrossAxisAlignment.stretch,
children: [
Expanded(
child: AnimatedLineChart(
lineChart,
toolTipColor: Colors.white,
gridColor: Colors.black54,
textStyle: TextStyle(fontSize: 10, color: Colors.black54),
showMarkerLines:
true, // If this value is not set to true, all defines lines will be filled lines and not dashed
legends: [
Legend(title: 'Critical', color: Colors.red, showLeadingLine: true),
Legend(title: 'Warning', color: Colors.yellow, Icon(Icons.report_problem_rounded, size: 17, color: Colors.yellow)),
],
legendsRightLandscapeMode: true,
),
),
],
),
),
);
Example code with horizontal and vertical markerlines along with icons on the chart and legends:
It is possible to define a maximum of two vertical markerlines.
The verticalMarker variable is a List<DateTime> and the length can be >= 2.
If two vertical markerlines are defined, the area between the two lines will be filled with a color that can be defined with verticalMarkerColor.
It is possible to add an Icon on the point where the vertical markerline crosses the y-axis value by defining the verticalMarkerIcon.
The verticalMarkerIcon variable takes a List<Icon> and the lenght must be equal to the length of the verticalMarker variable.
The possibility of adding a colored background to the icons have been added and can be defined with iconBackgroundColor which takes a Color.
returnScaffold(
appBar: AppBar(
title: Text(widget.title),
),
body: Container(
child: Column(
mainAxisSize: MainAxisSize.max,
mainAxisAlignment: MainAxisAlignment.spaceBetween,
crossAxisAlignment: CrossAxisAlignment.stretch,
children: [
Expanded(
child: AnimatedLineChart(
lineChart,
toolTipColor: Colors.white,
gridColor: Colors.black54,
textStyle: TextStyle(fontSize: 10, color: Colors.black54),
showMarkerLines:
true, // If this value is not set to true, all defines lines will be filled lines and not dashed
legends: [
Legend(title: 'Critical', color: Colors.red),
Legend(title: 'Warning', color: Colors.yellow),
],
verticalMarker:[
DateTime.parse('2012-02-27 12:54:00'),
DateTime.parse('2012-02-27 13:16:00')
],
verticalMarkerColor: Colors.yellow,
verticalMarkerIcon: [
Icon(
Icons.report_problem_rounded,
color: Colors.yellow,
),
Icon(
Icons.check_circle_rounded,
color: Colors.green,
),
],
iconBackgroundColor: Colors.white,
),
),
],
),
),
);
Example code with shaded area between markerlines:
It is possible to have shaded areas between the defined markerlines.
The shaded area will be in the same color as the markerline.
It is important that the order of enums in the List<MaxMin> filledMarkerLinesValues matches the order of defined markerlines to be shown in the graph.
Enums with the value MaxMin.MAX will draw to the top if there is only one markerline defined as MAX, otherwise it will draw from i - 1 where enum values are MAX.
If enum value is MaxMin.MIN the shaded area will draw downwards to i + 1, unless the index is the last in the list, then the shaded area will draw all the way to the bottom of the graph.