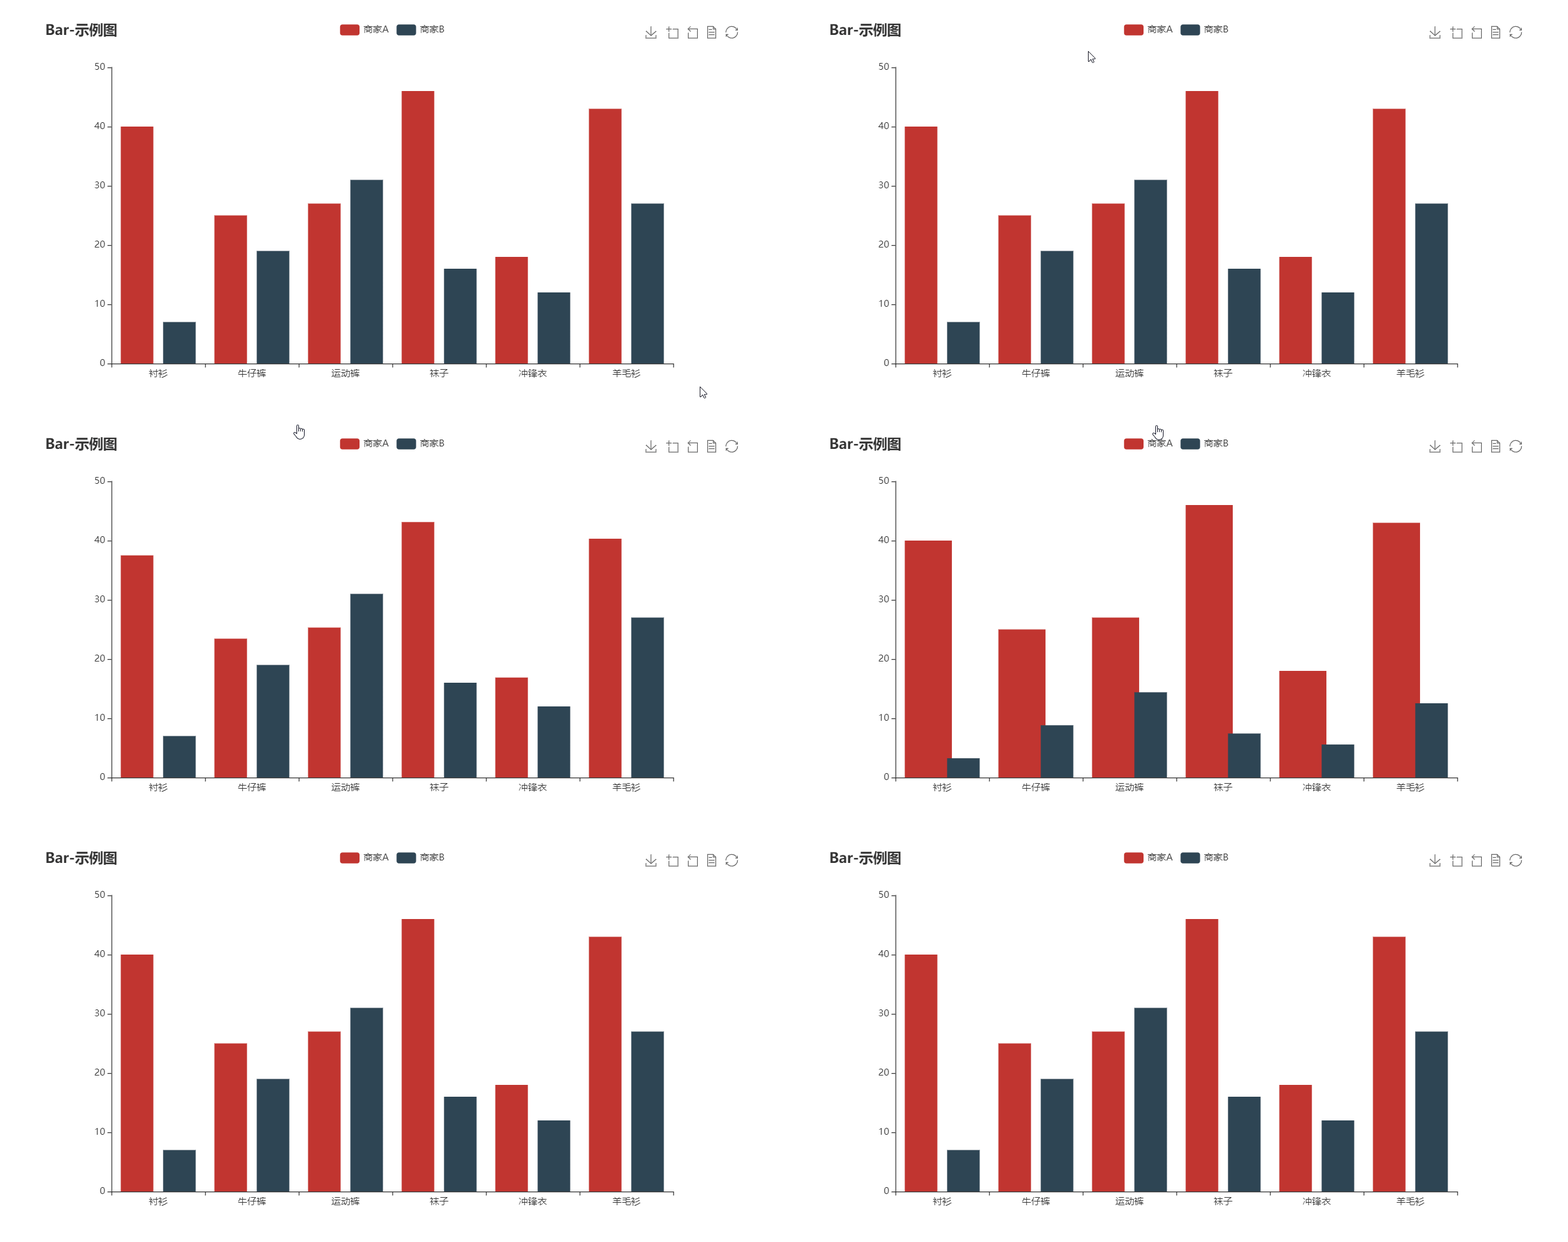
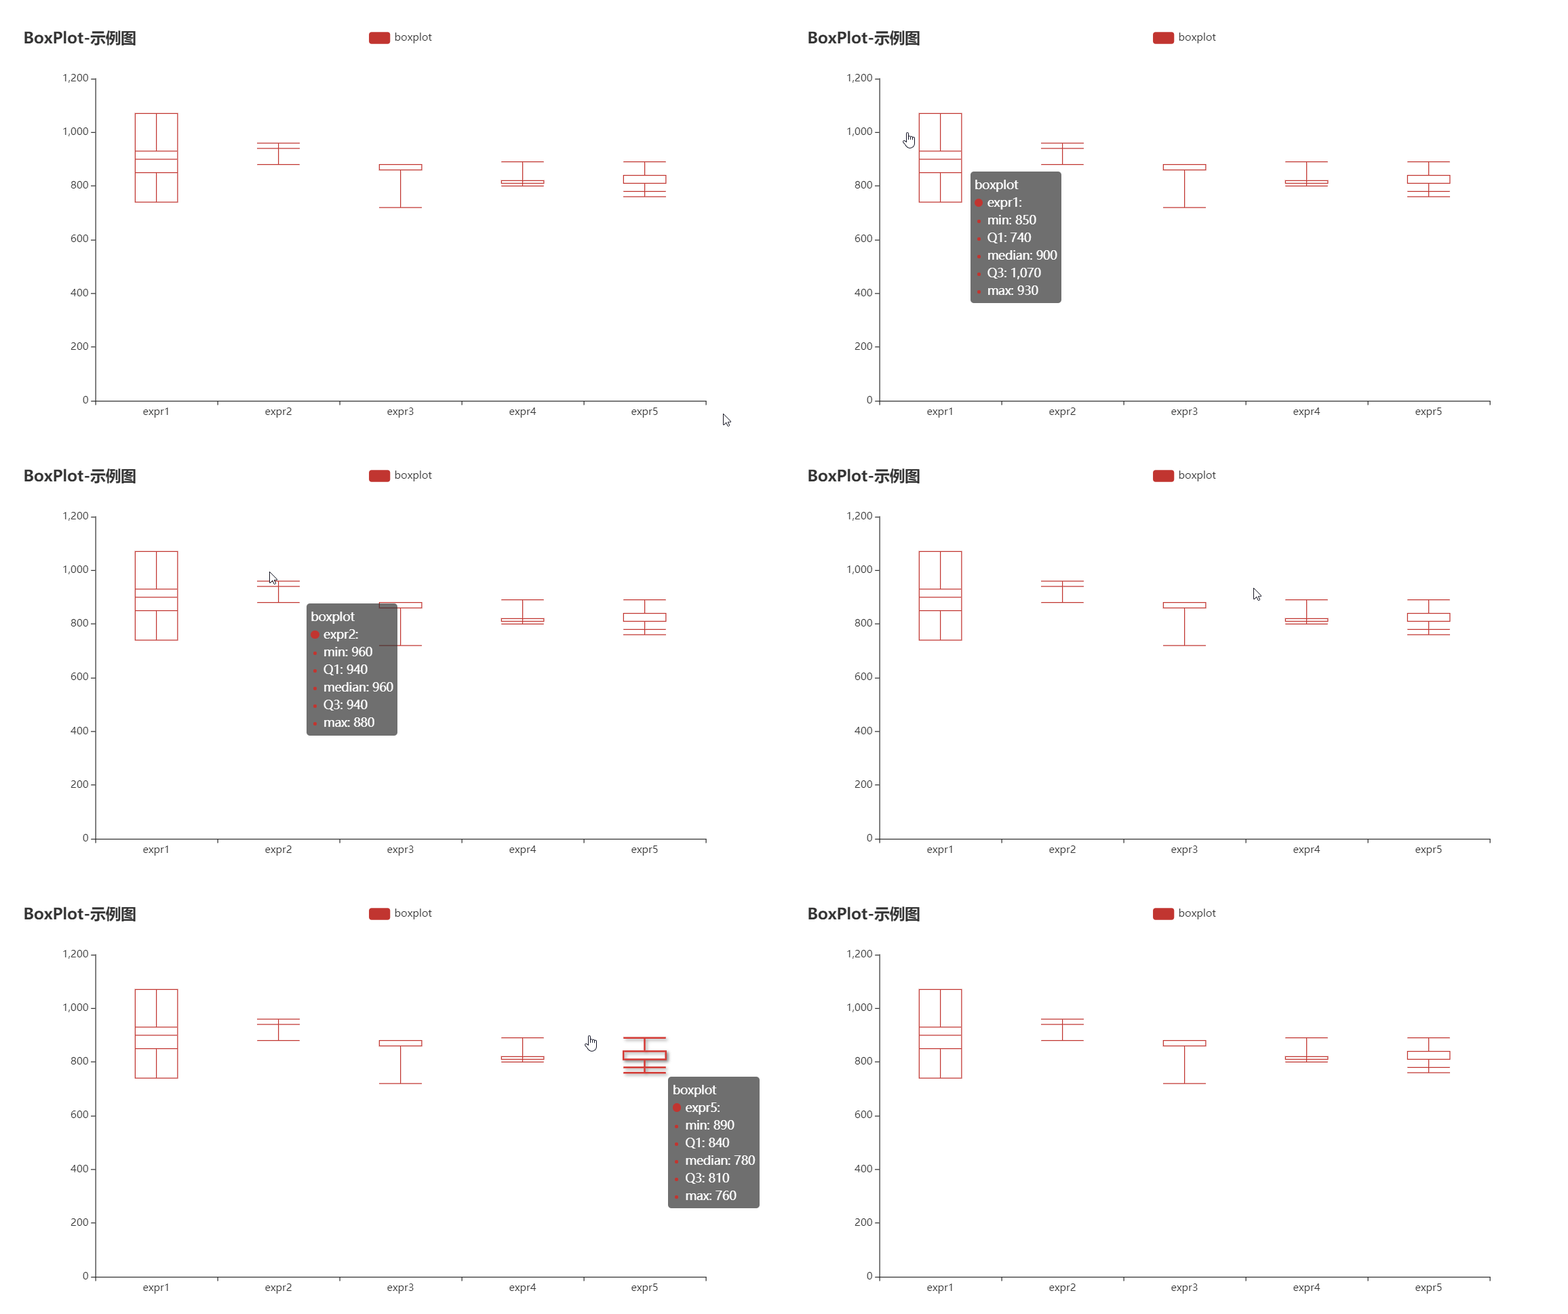
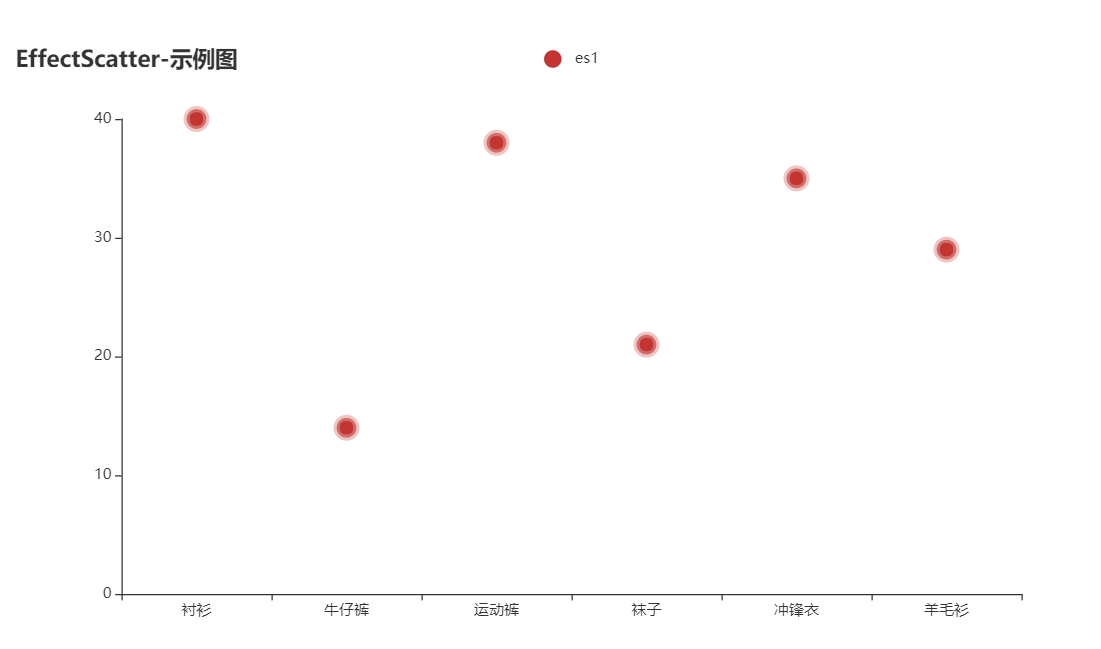
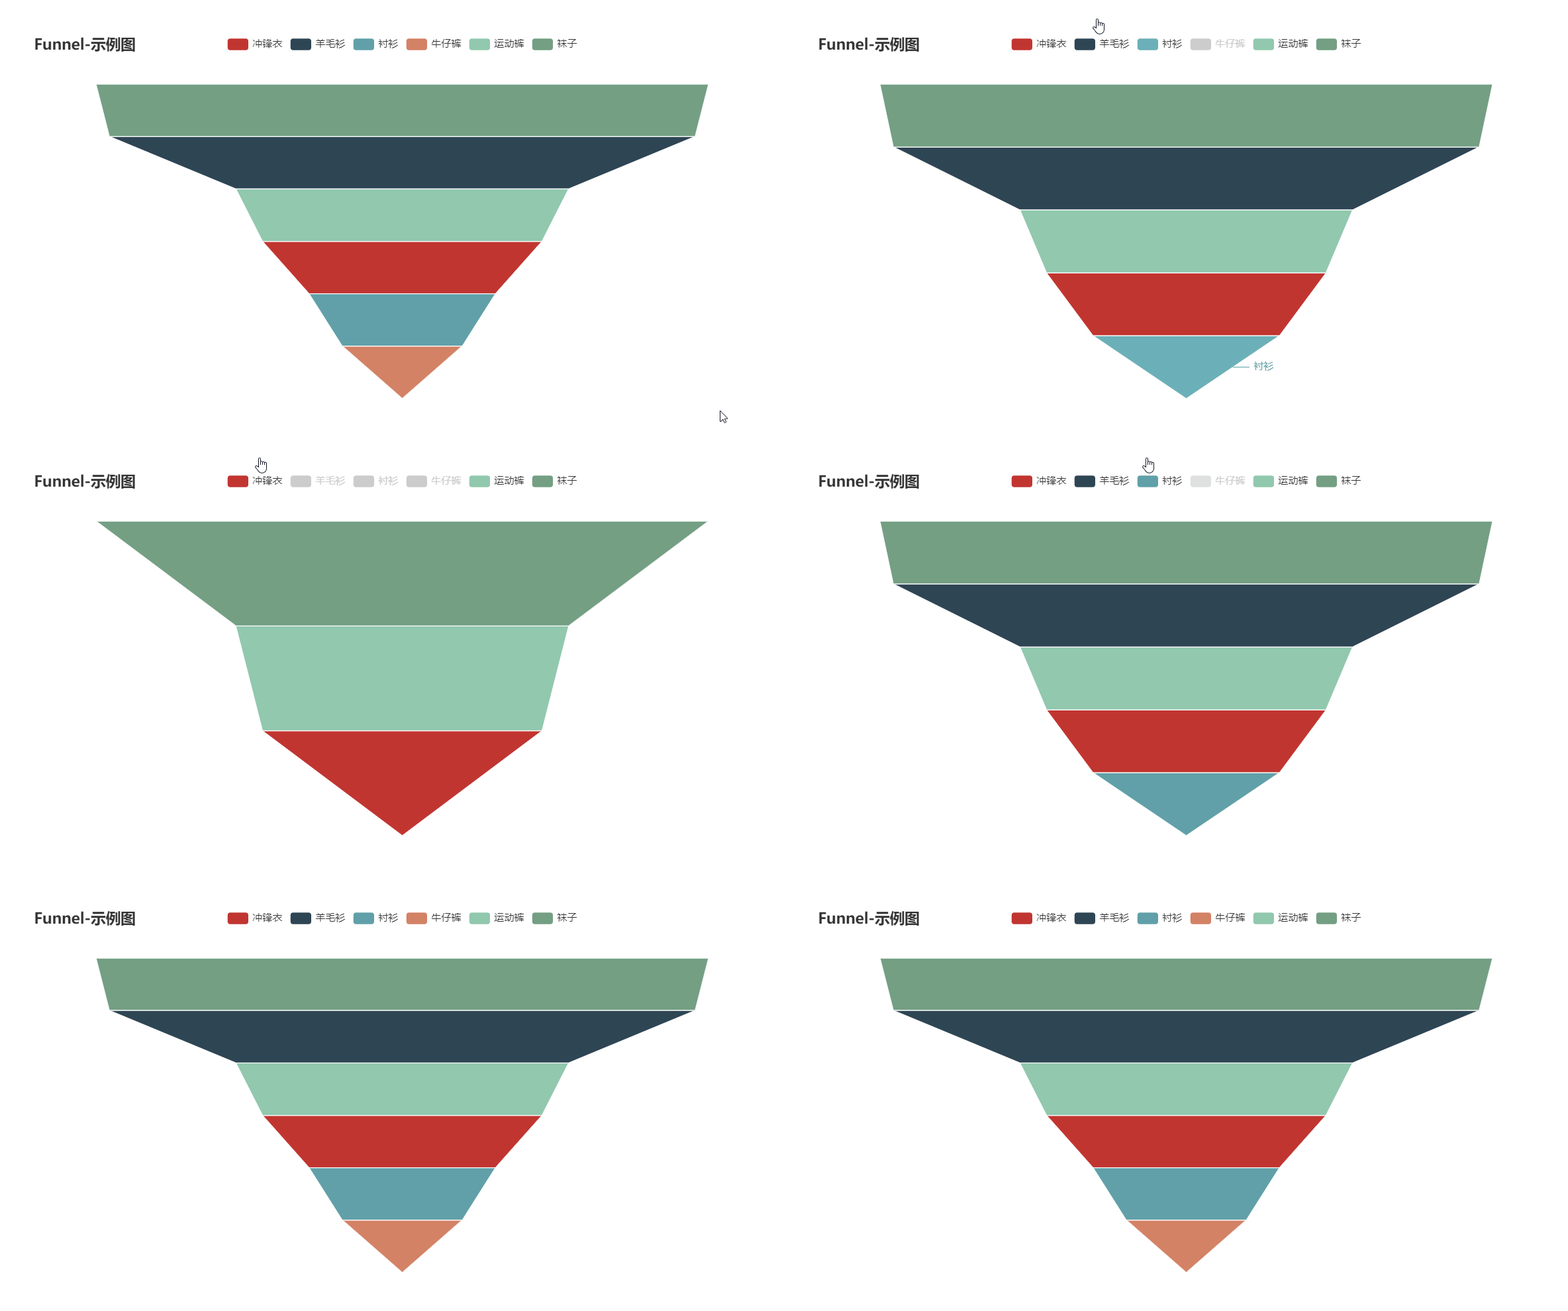
Orientação gerada a partir de informações públicas. Apenas para referência.
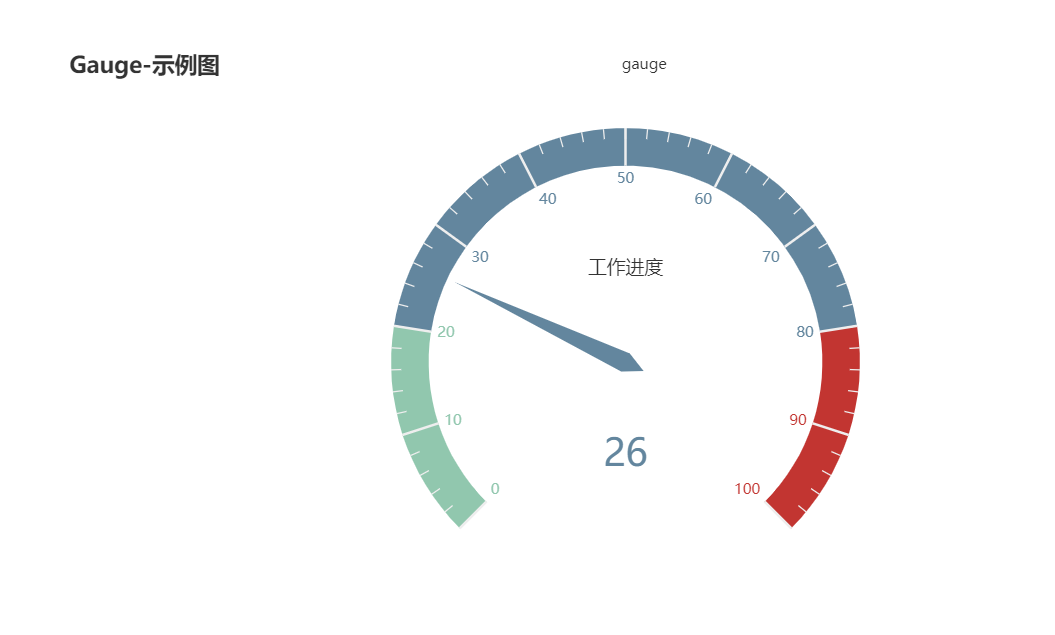
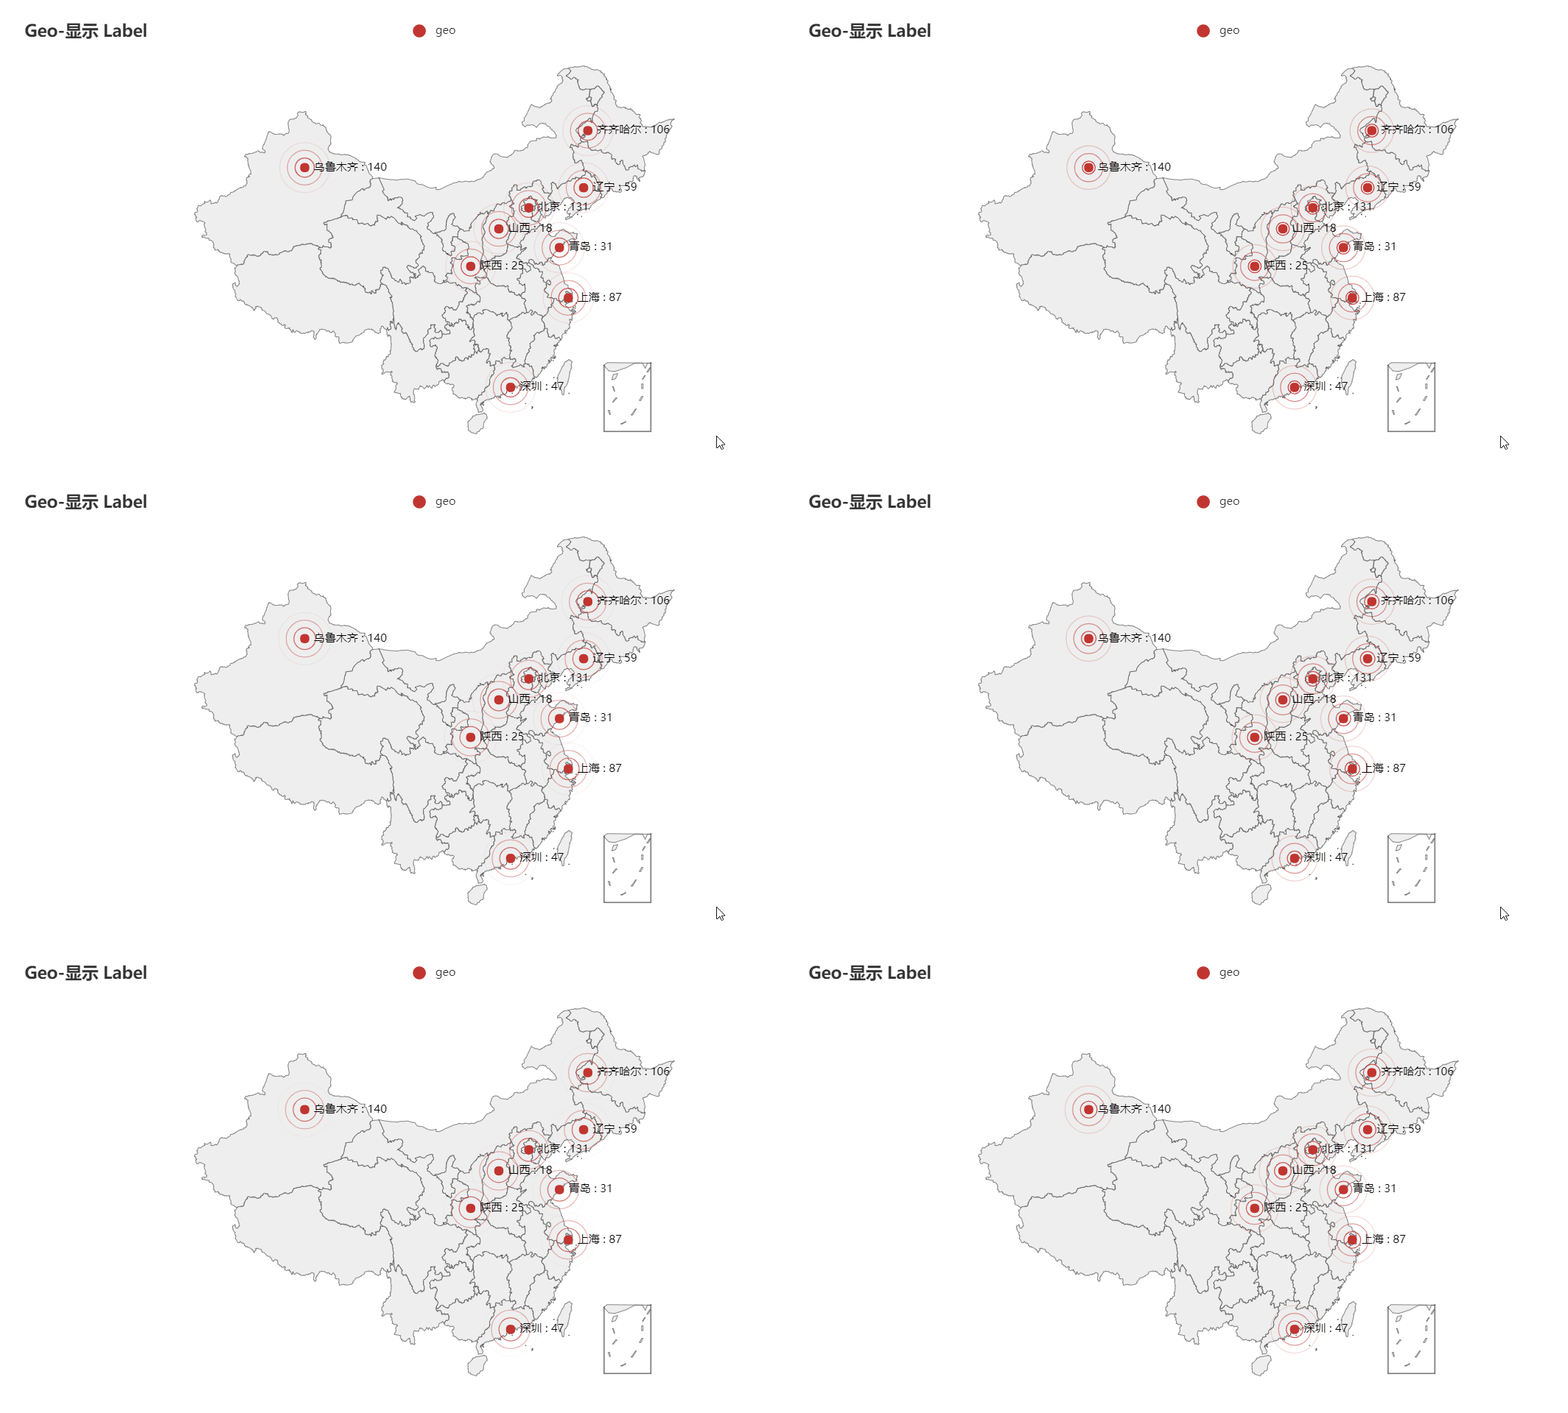
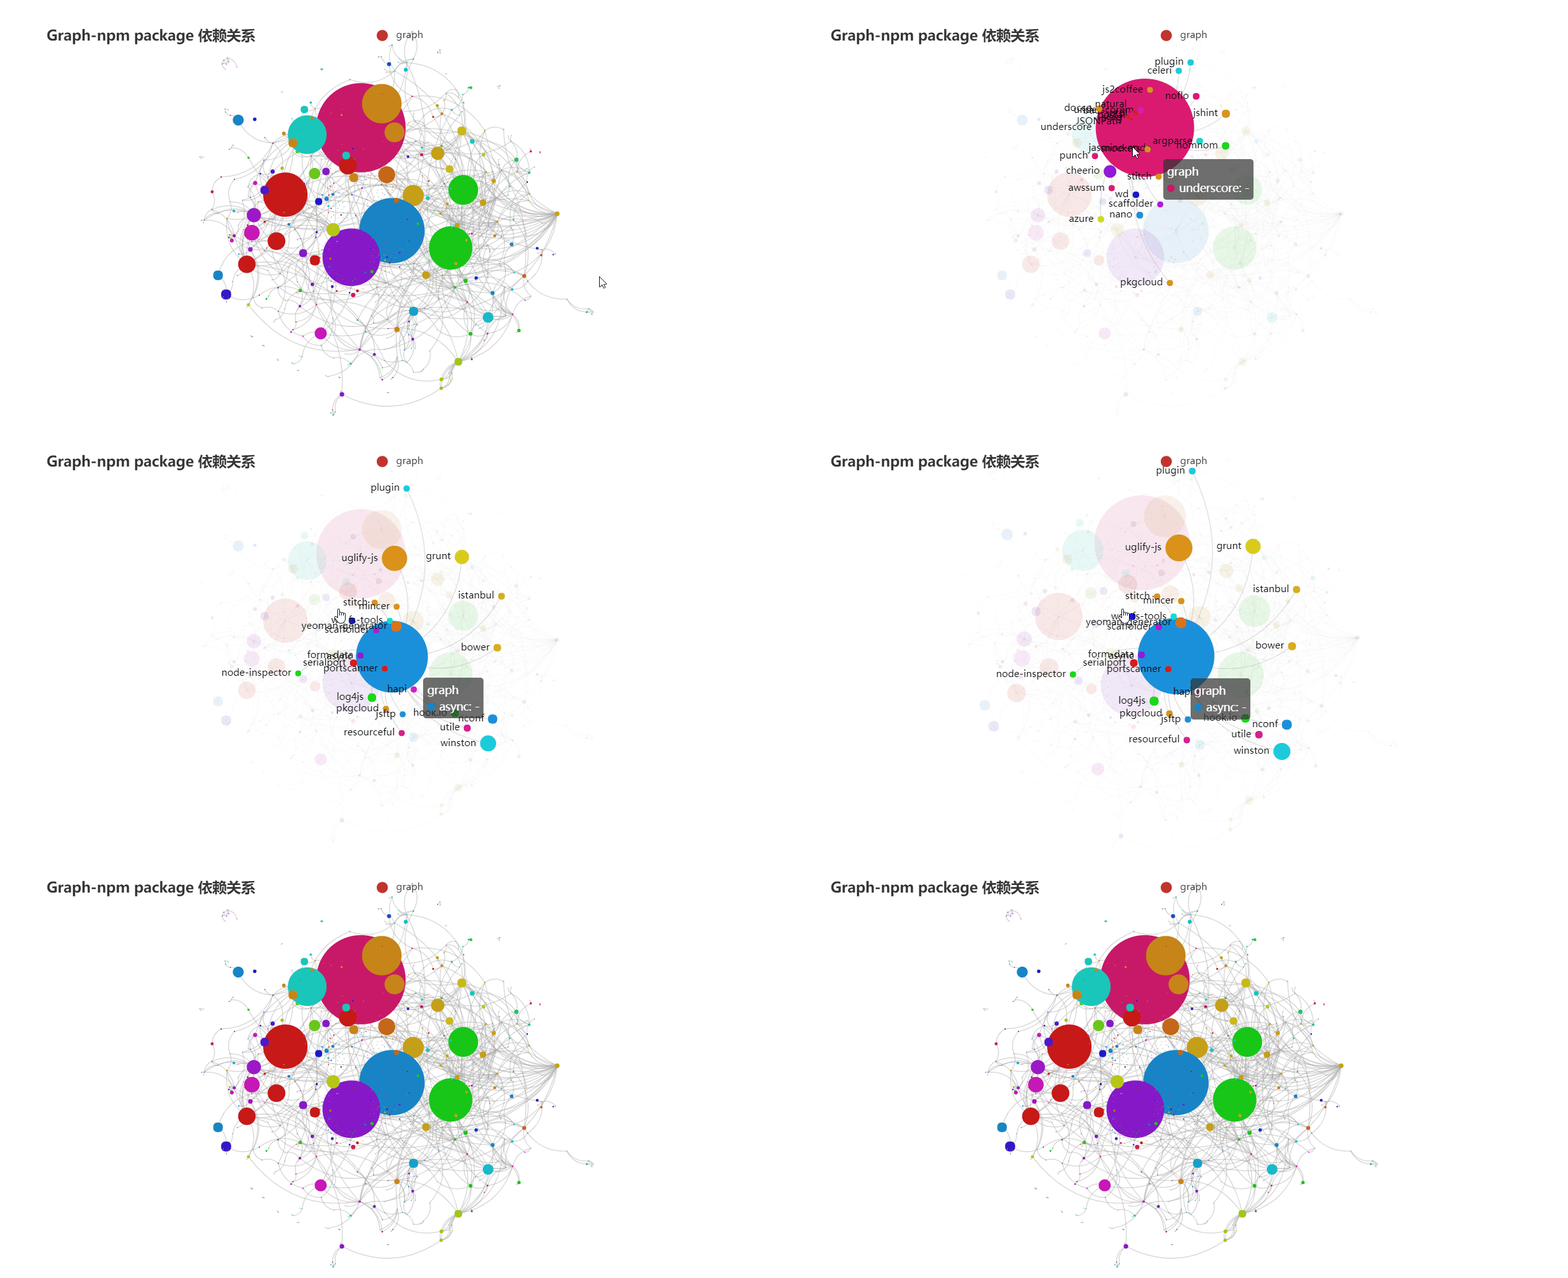
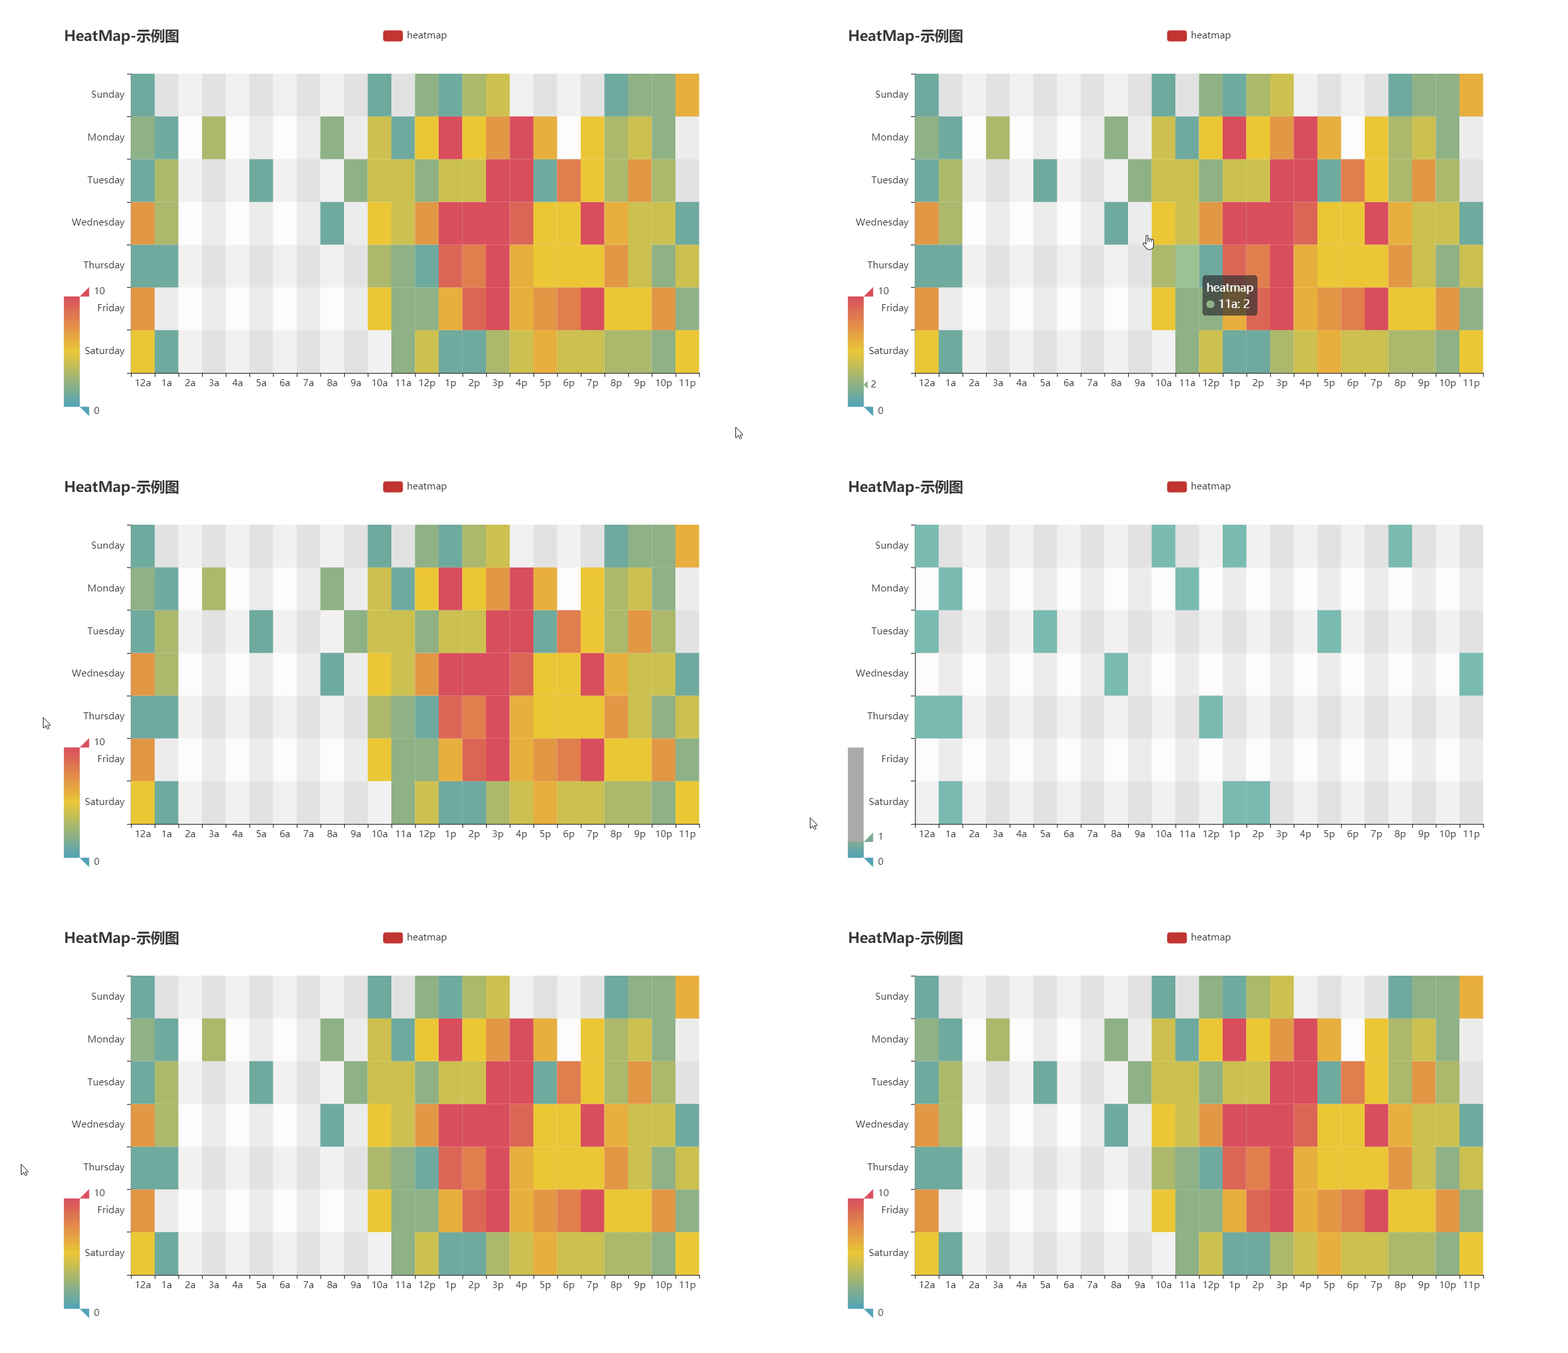
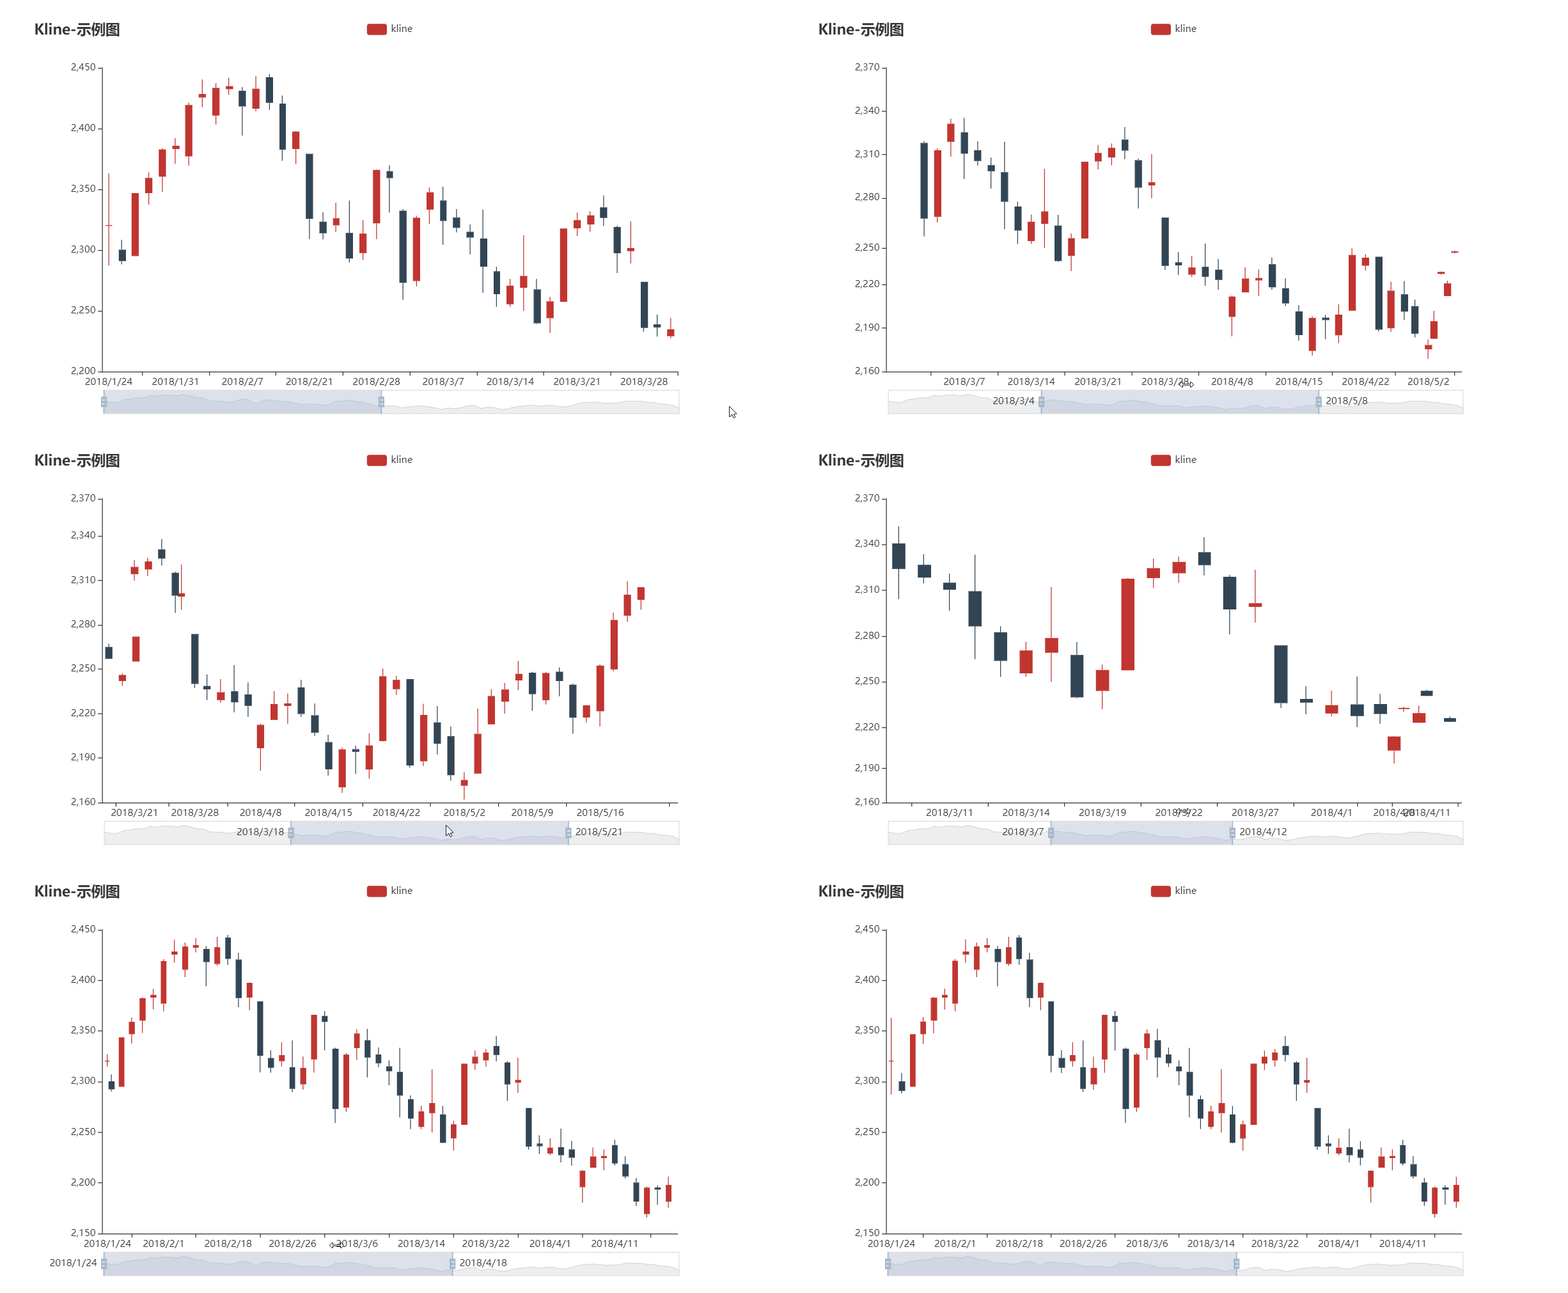
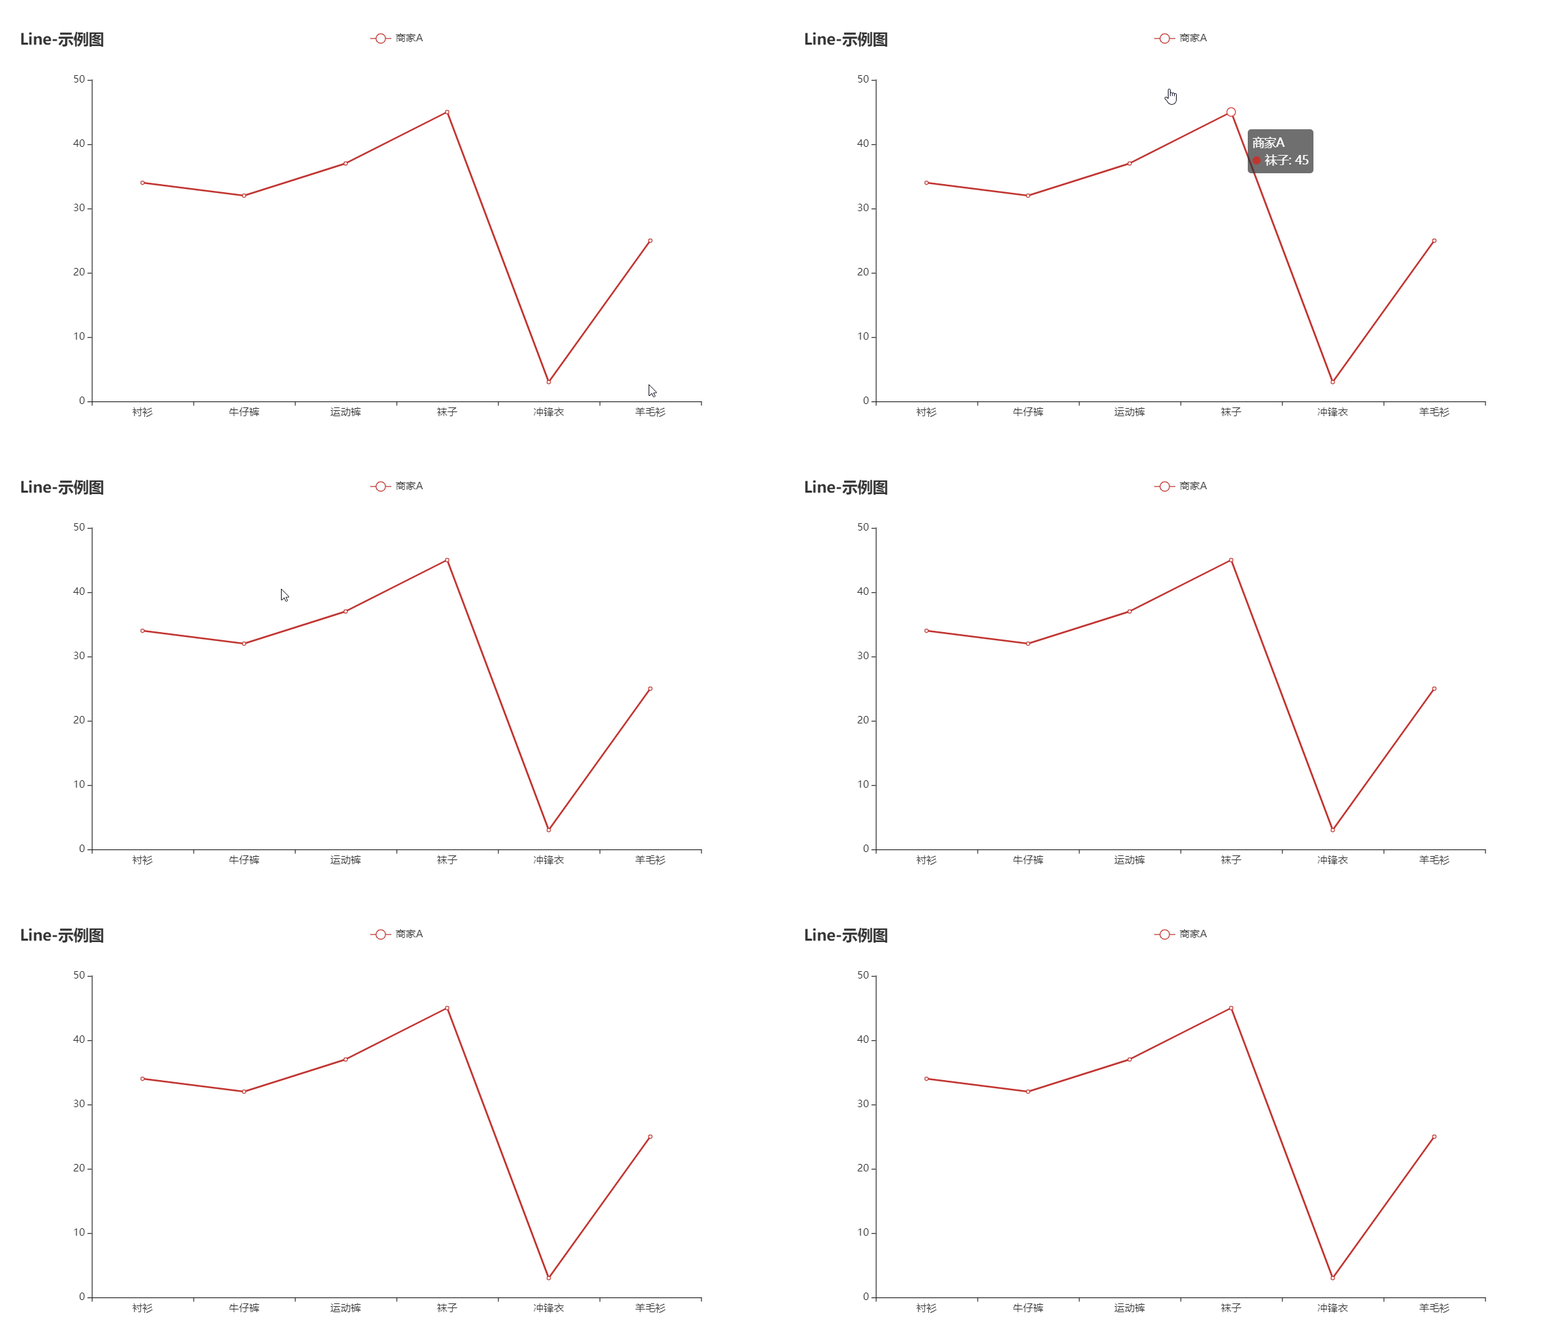
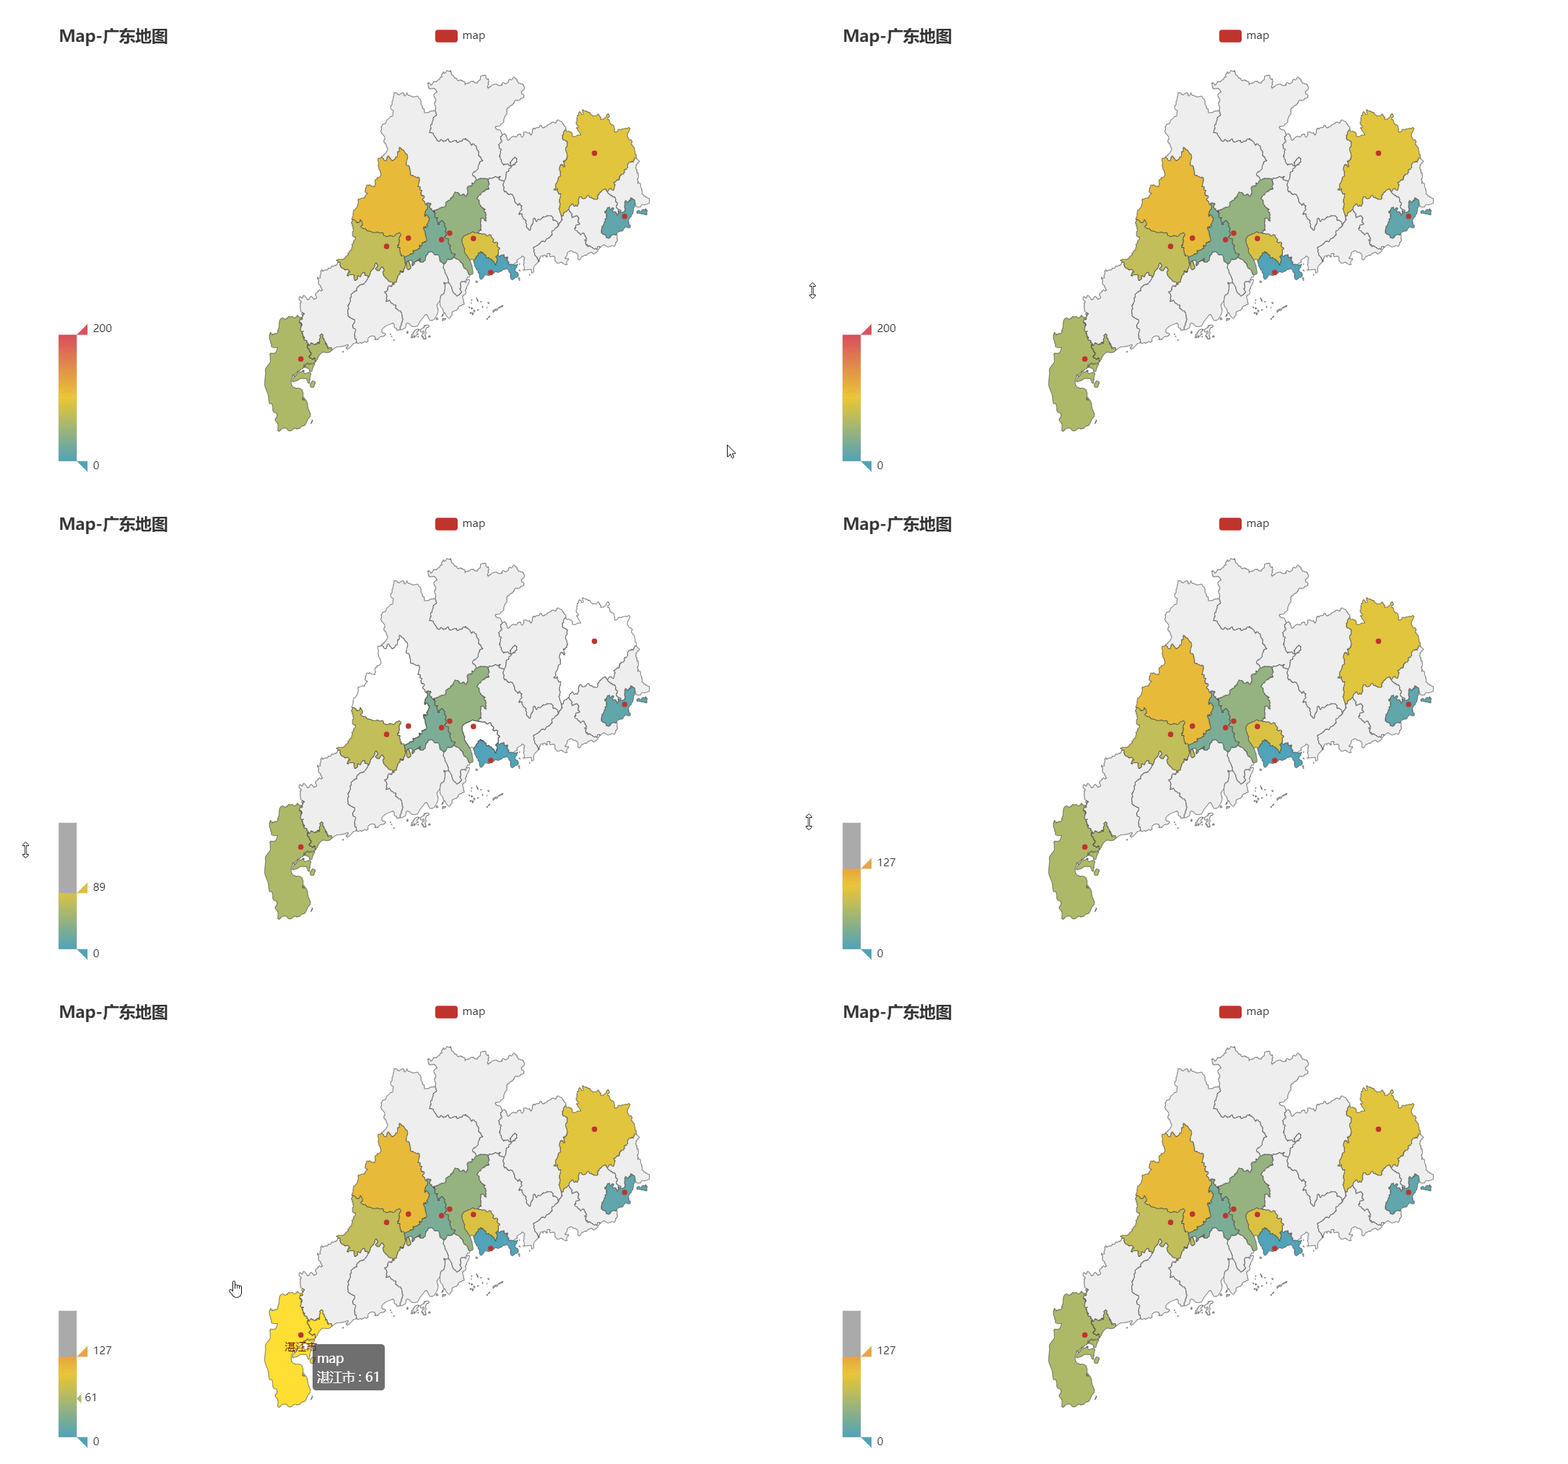
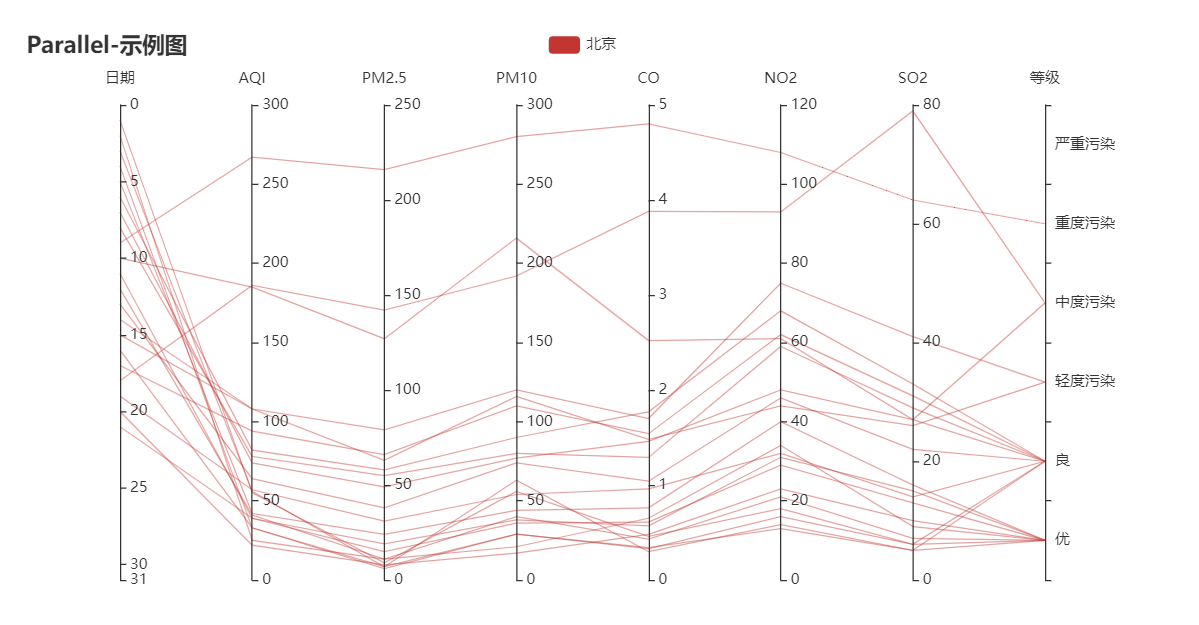
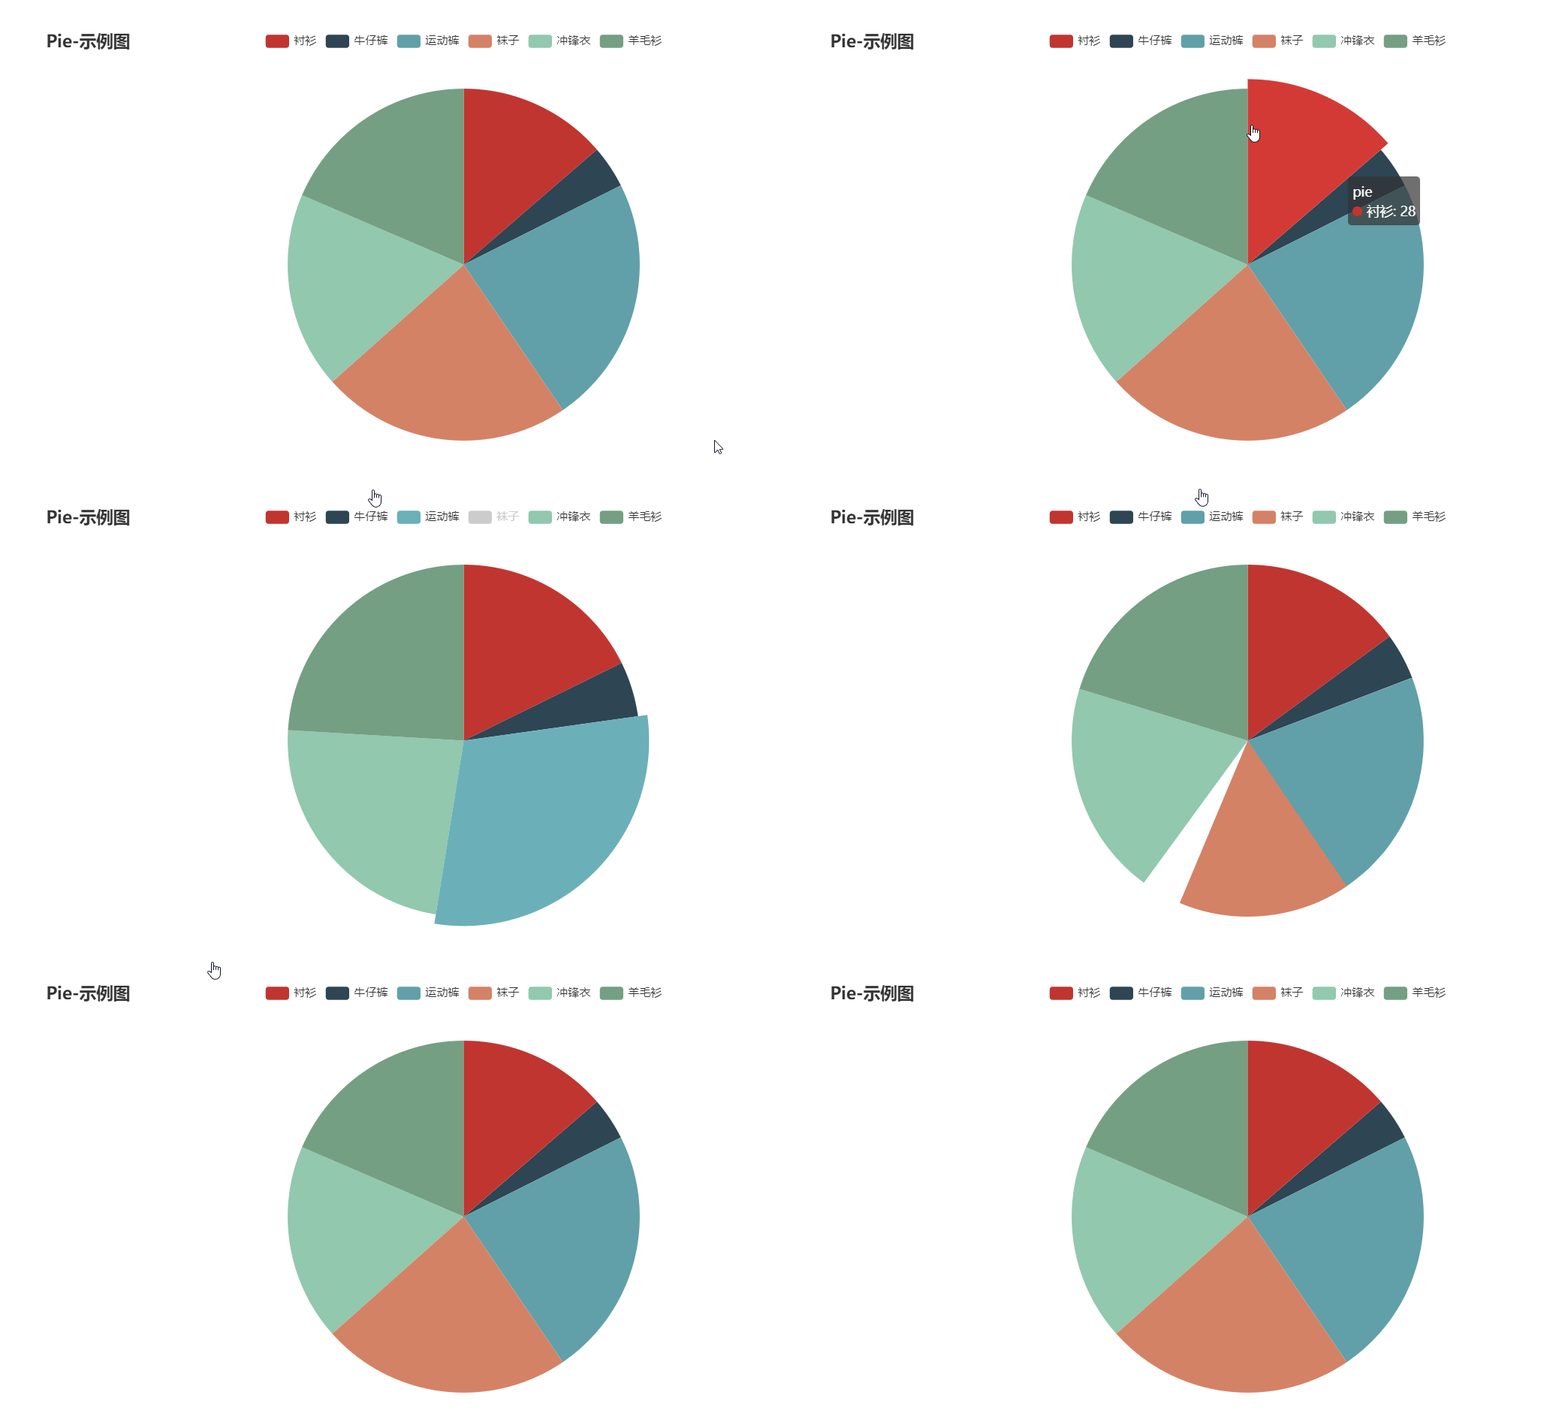
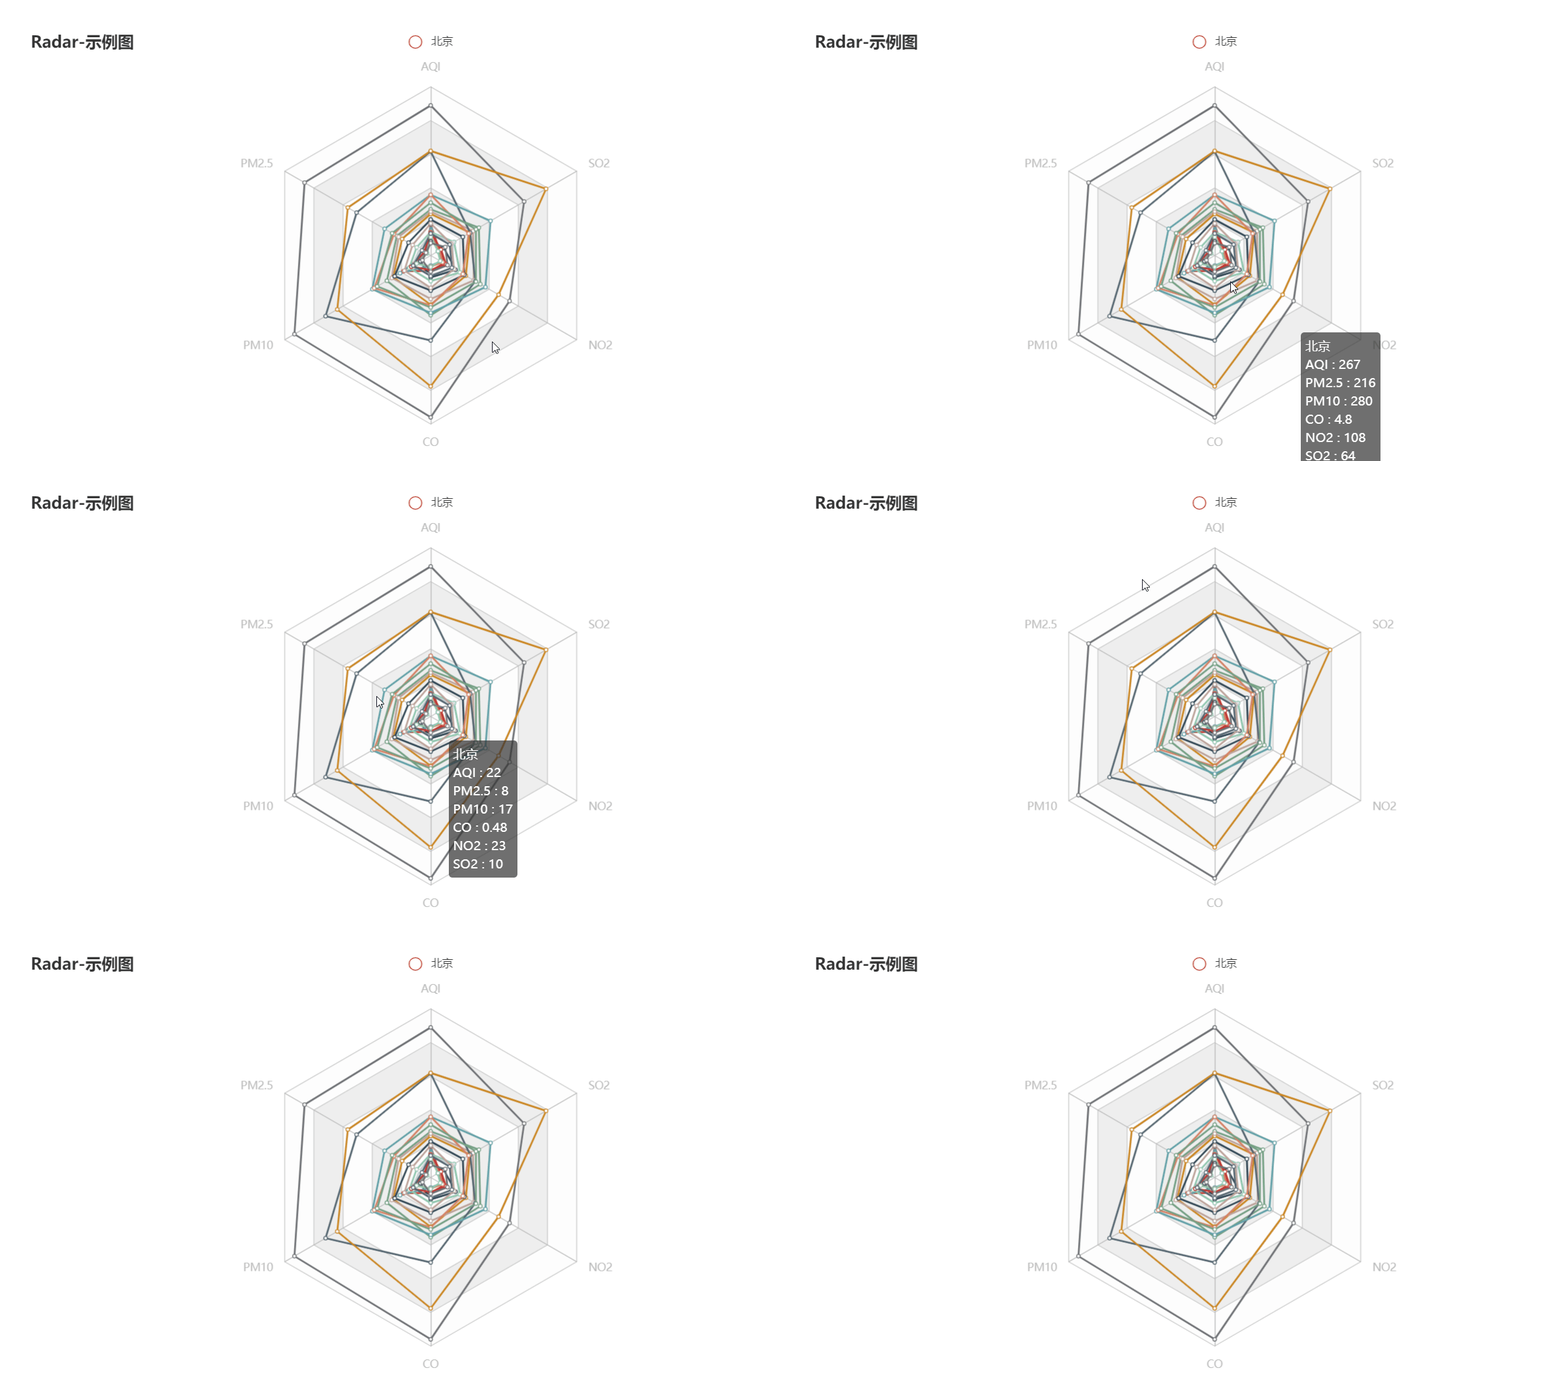
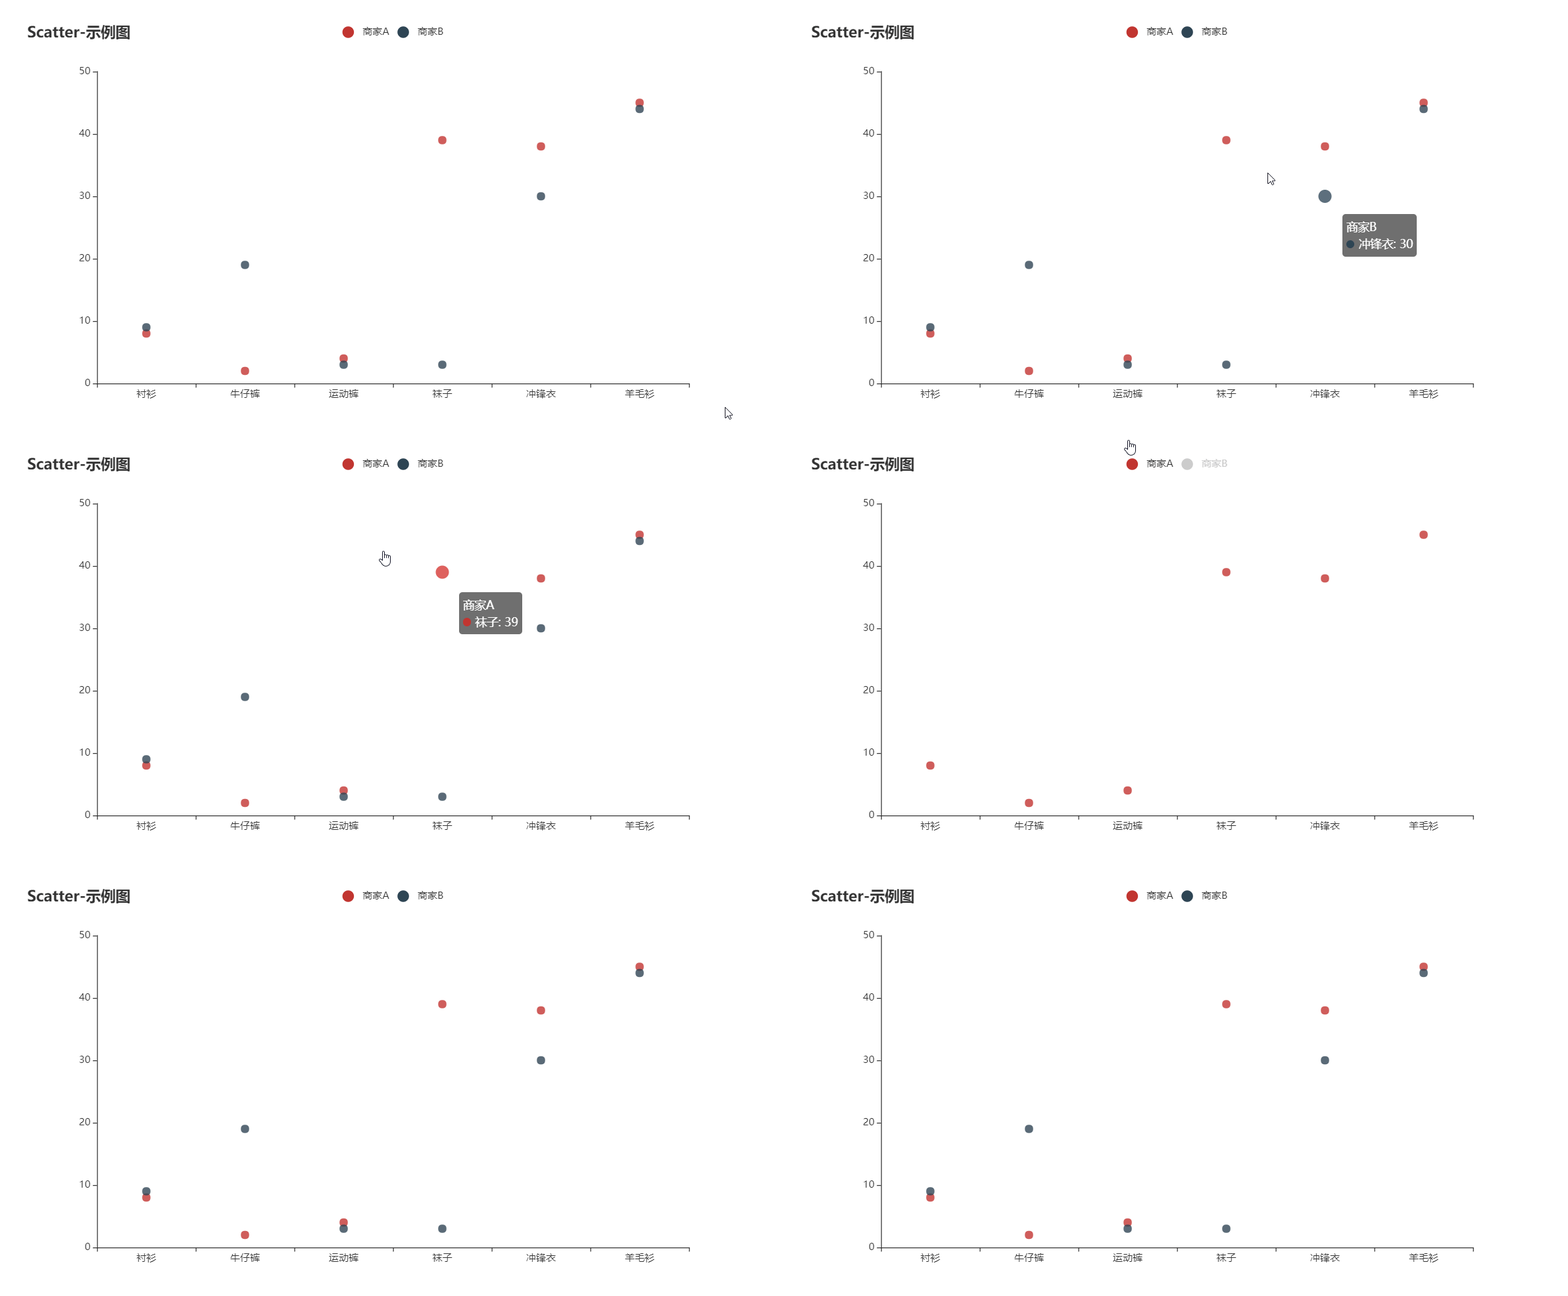
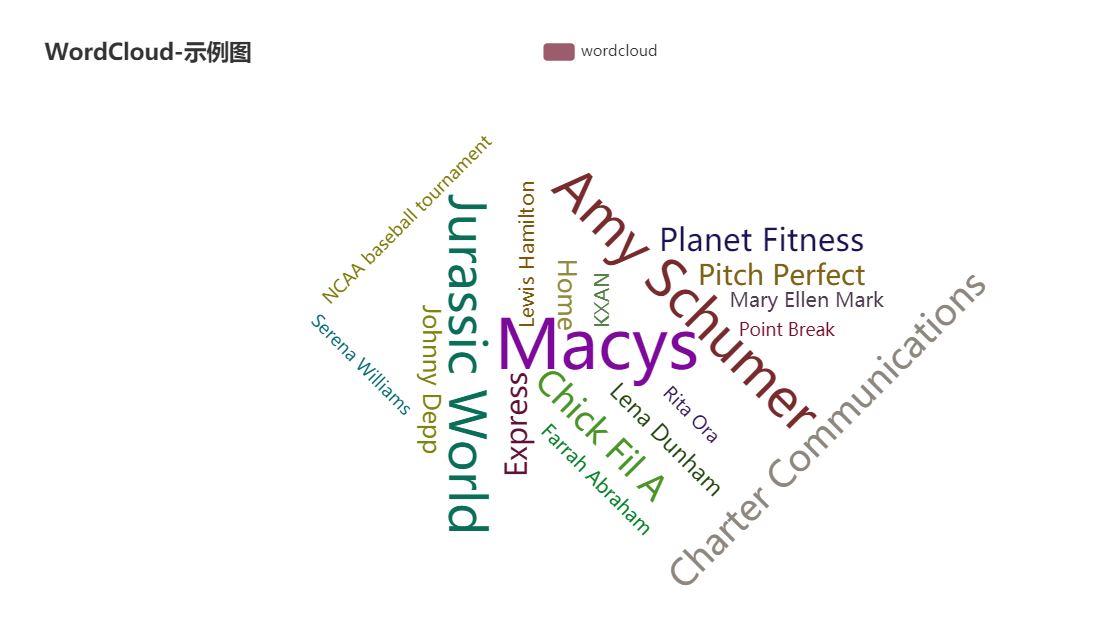
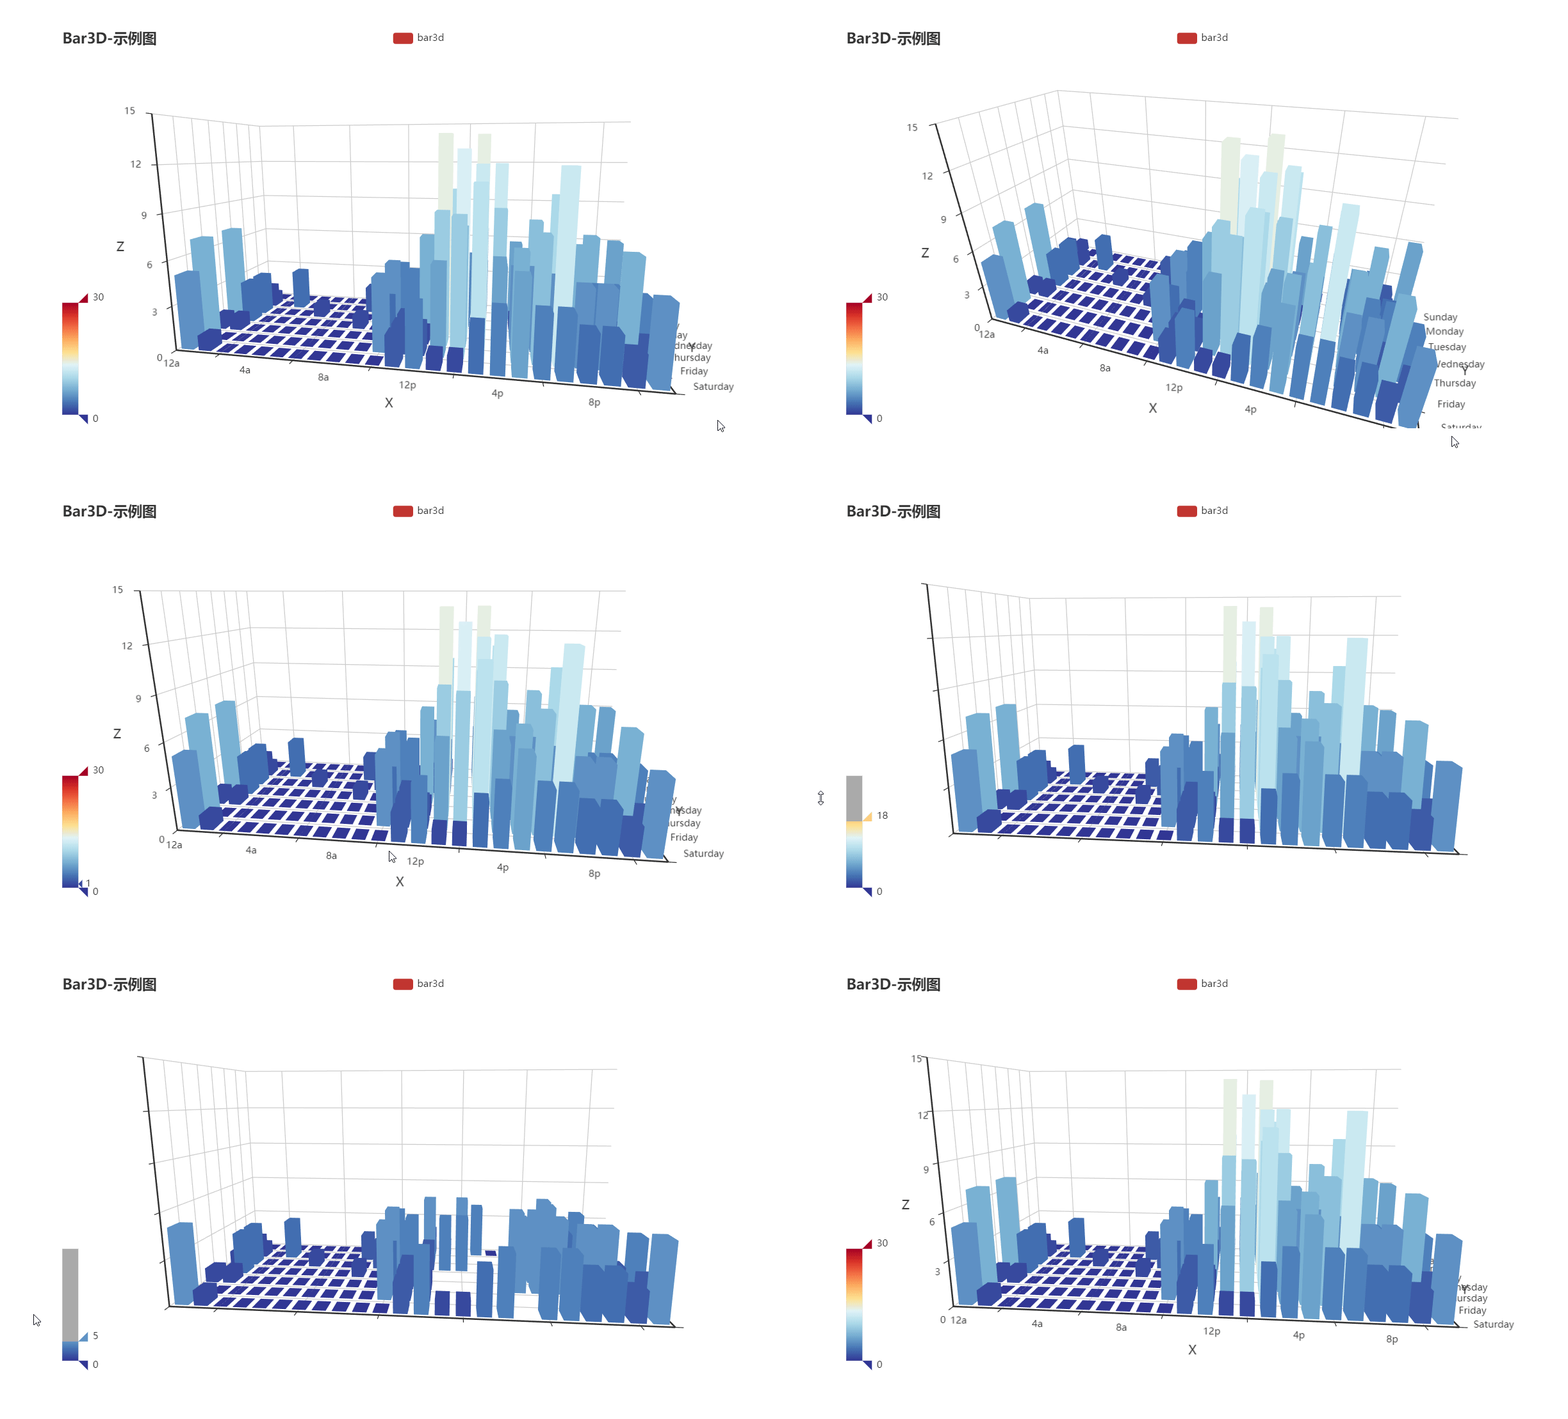
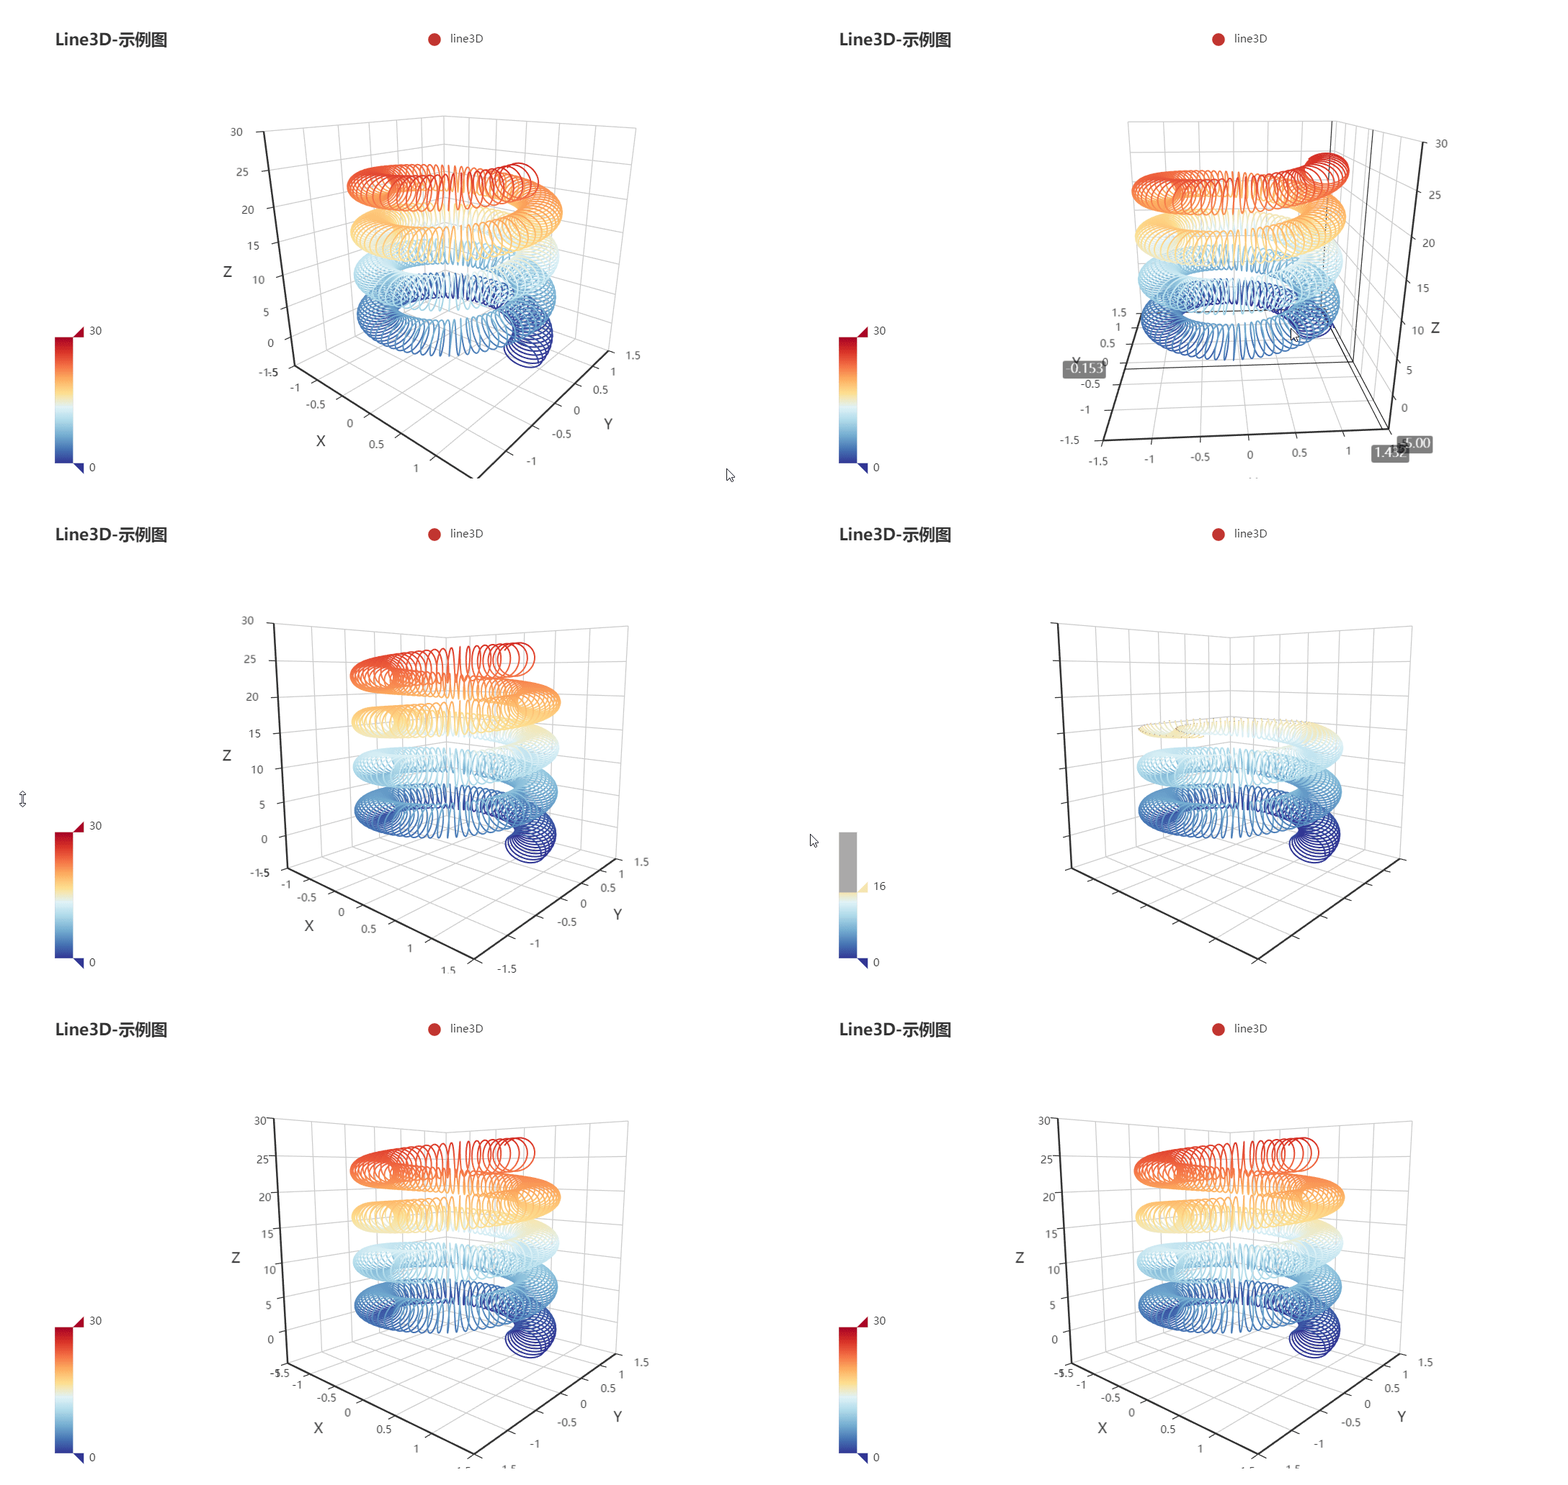
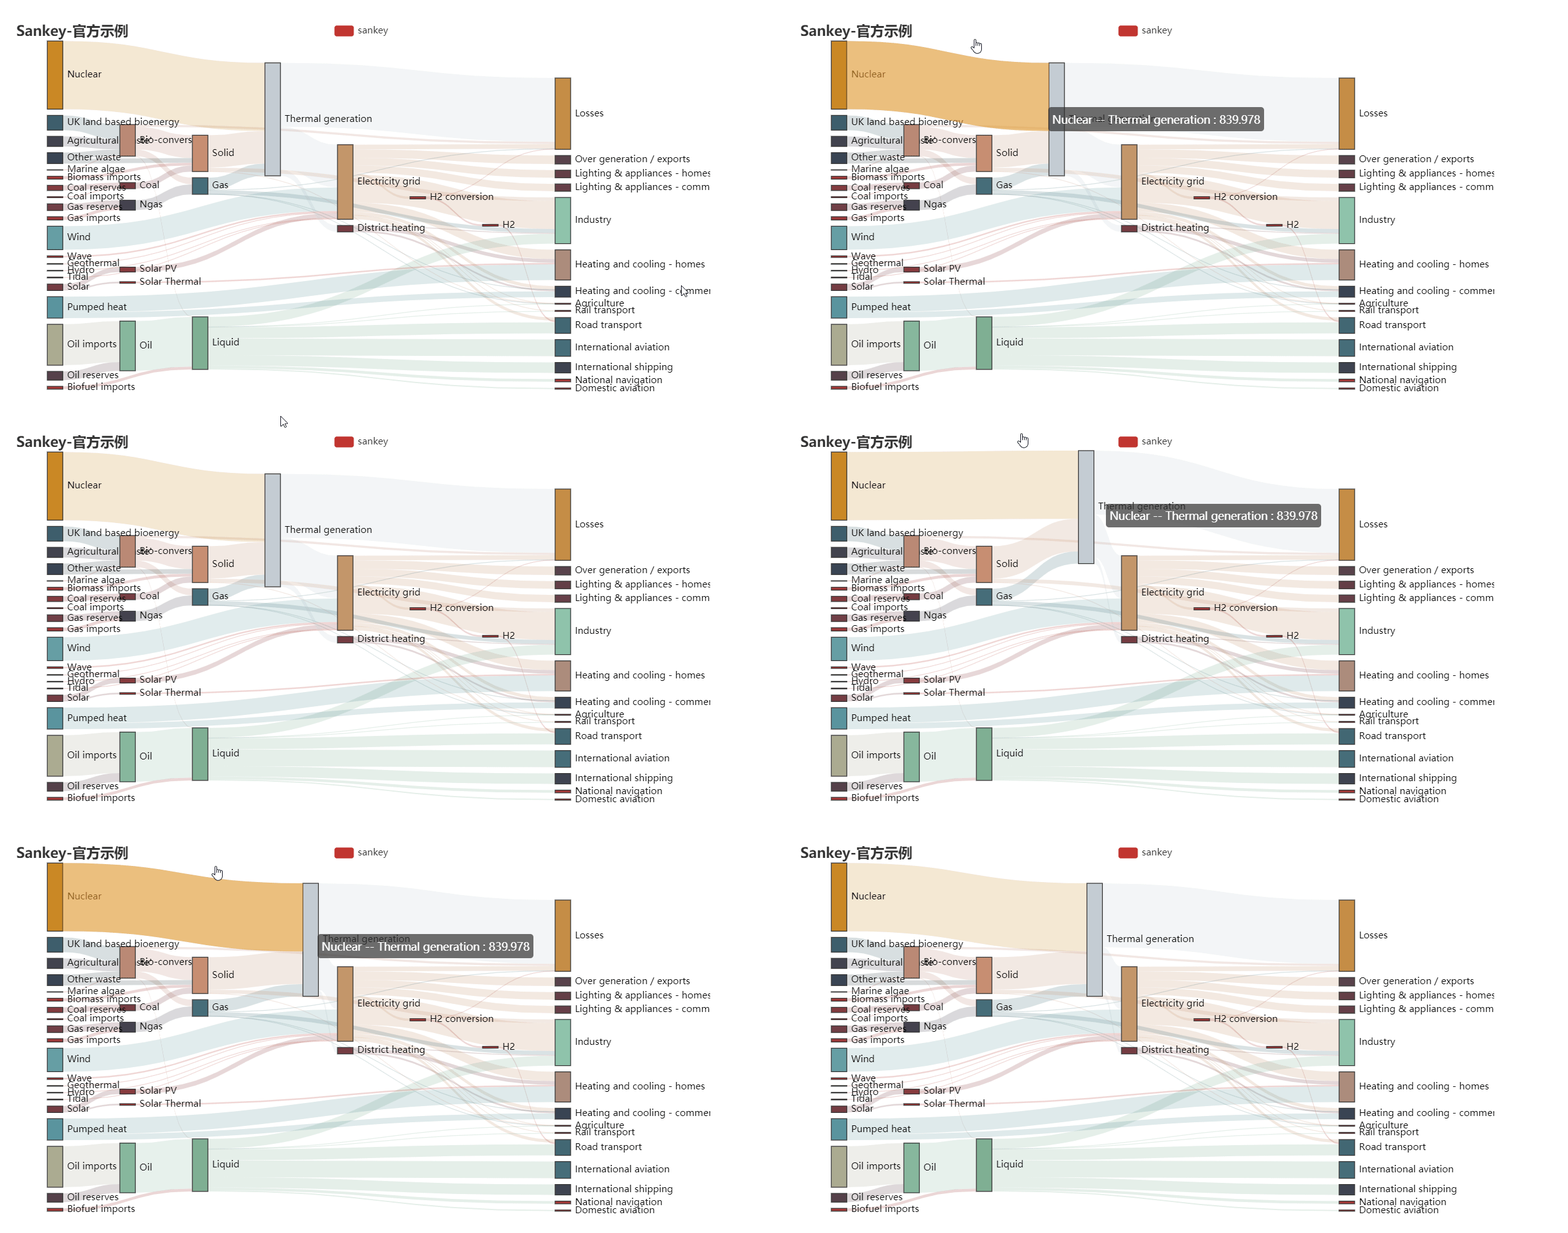
flutter_echarts é uma poderosa biblioteca de visualização de dados para Flutter, construída sobre o Apache ECharts. Permite que desenvolvedores criem gráficos avançados, como visualizações 3D com WebGL e mapas GIS interativos. O pacote suporta múltiplas plataformas, incluindo Android, iOS e macOS, oferecendo recursos ricos e dinâmicos de gráficos diretamente em aplicativos Flutter. Com integração perfeita por meio de um simples comando pub, é ideal para aplicações que exigem representação de dados com alto desempenho e funcionalidades completas.
Casos de uso
Painéis interativos
mapeamento de dados geoespaciais
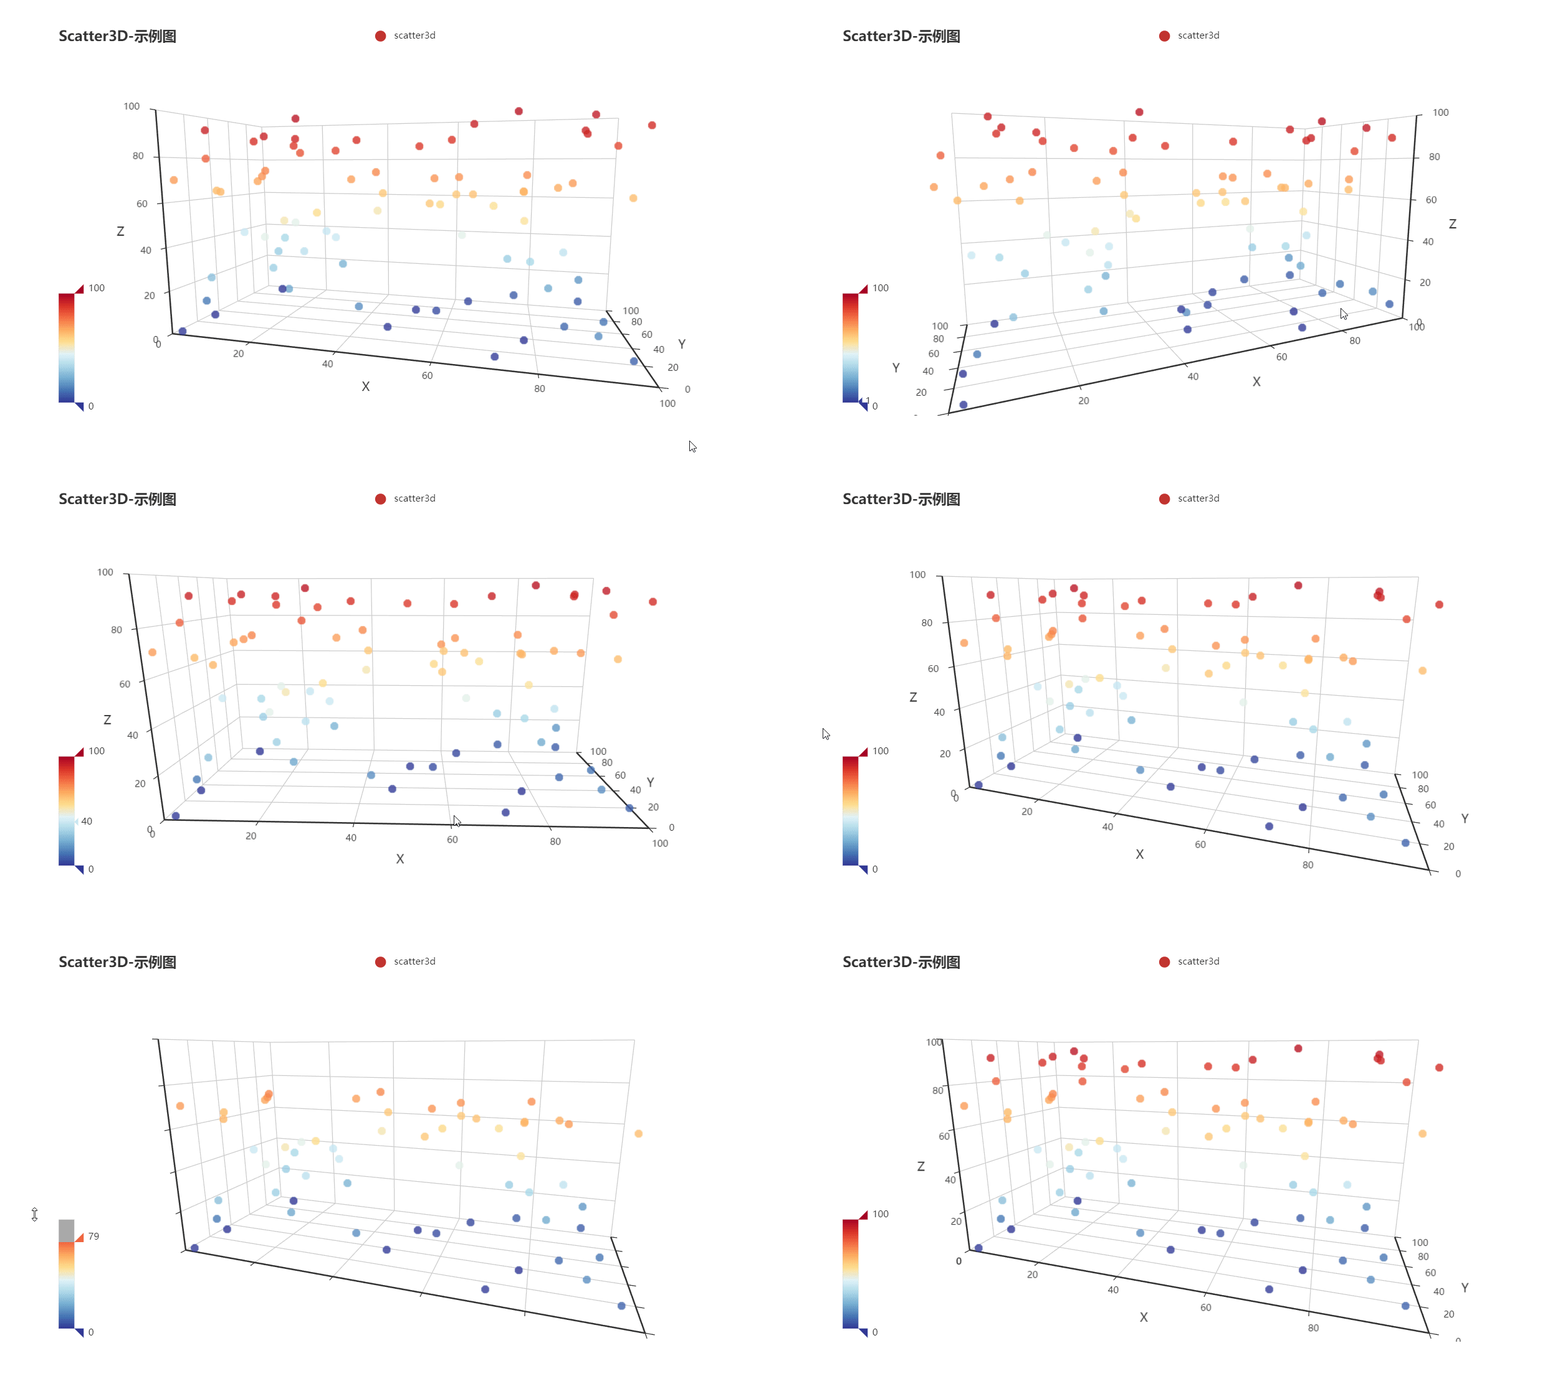
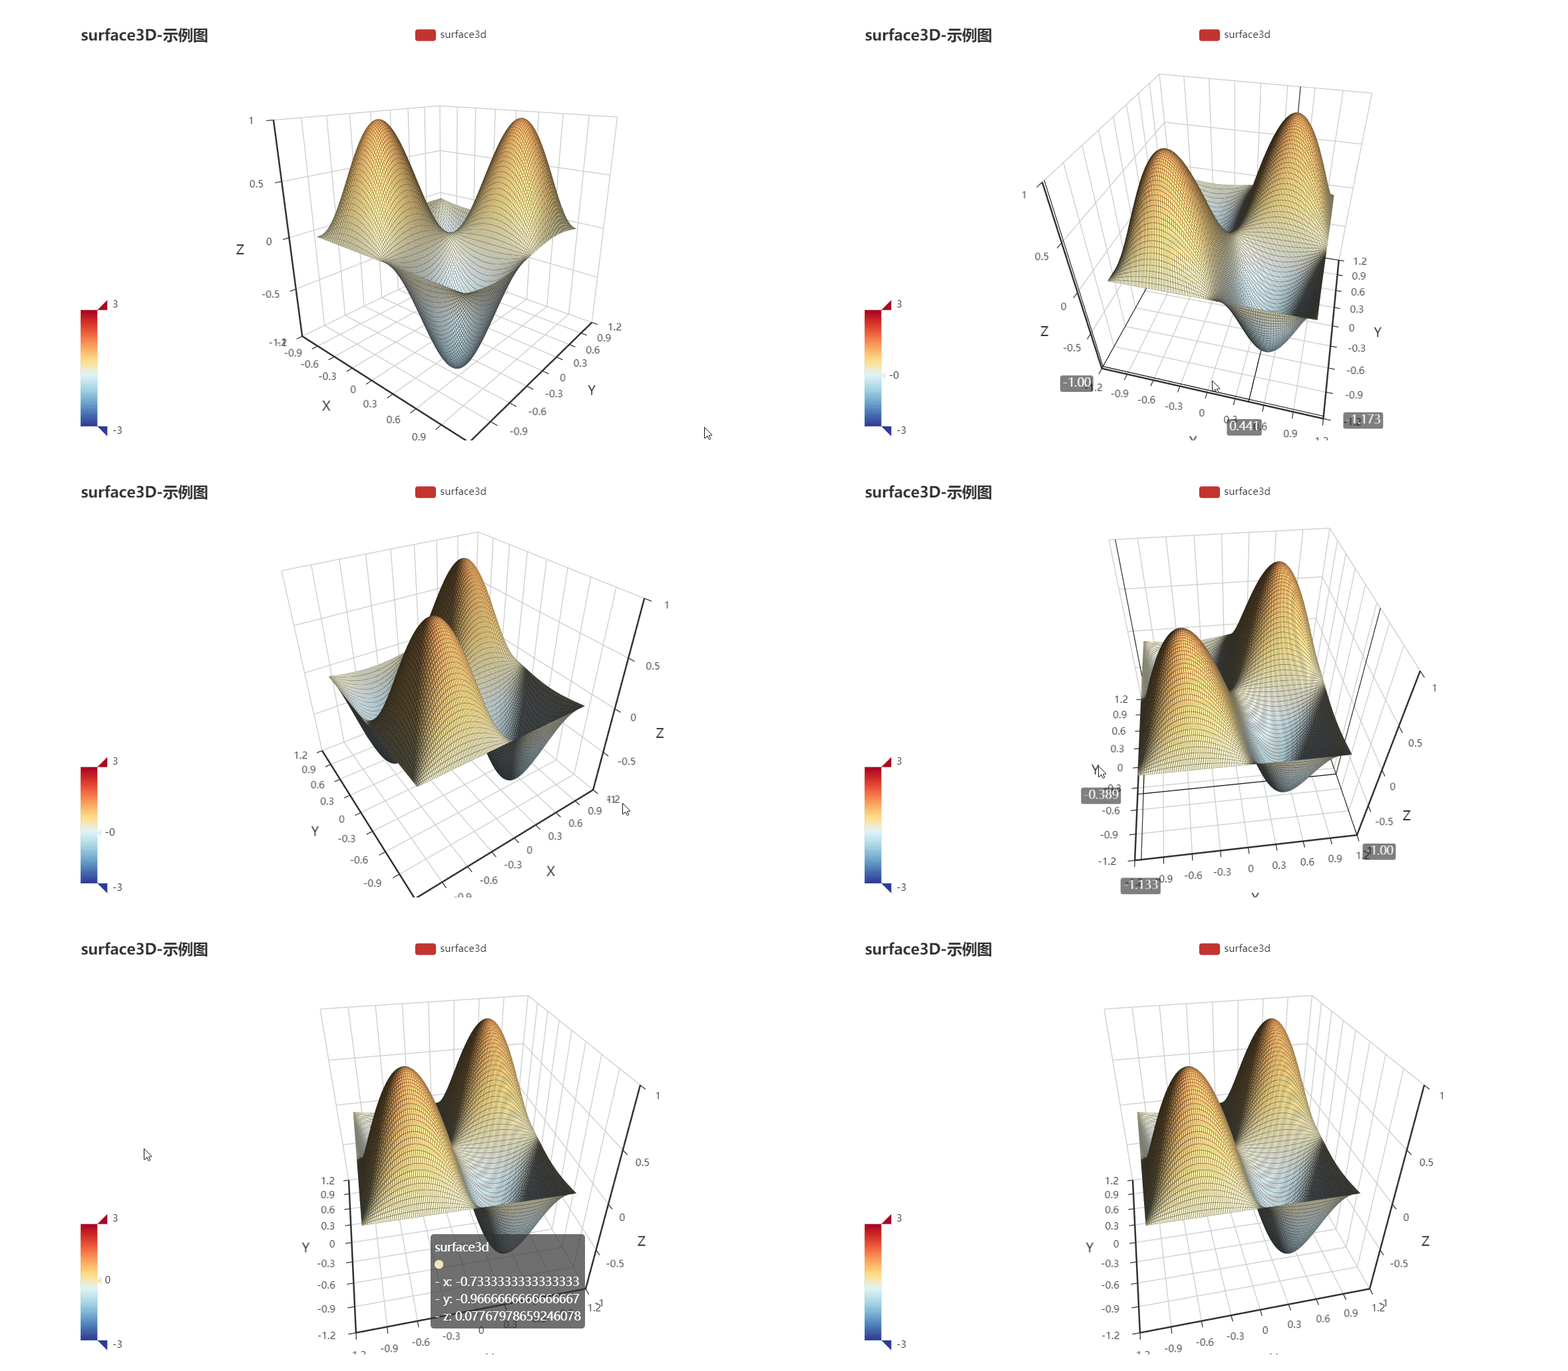
visualização de dados 3D
Exibição de análise em tempo real
Renderização de gráficos complexos em aplicativos móveis
Principais recursos
Suporta gráficos 3D WebGL
Integração de mapa GIS embutido
Renderização de alto desempenho
Compatibilidade multiplataforma
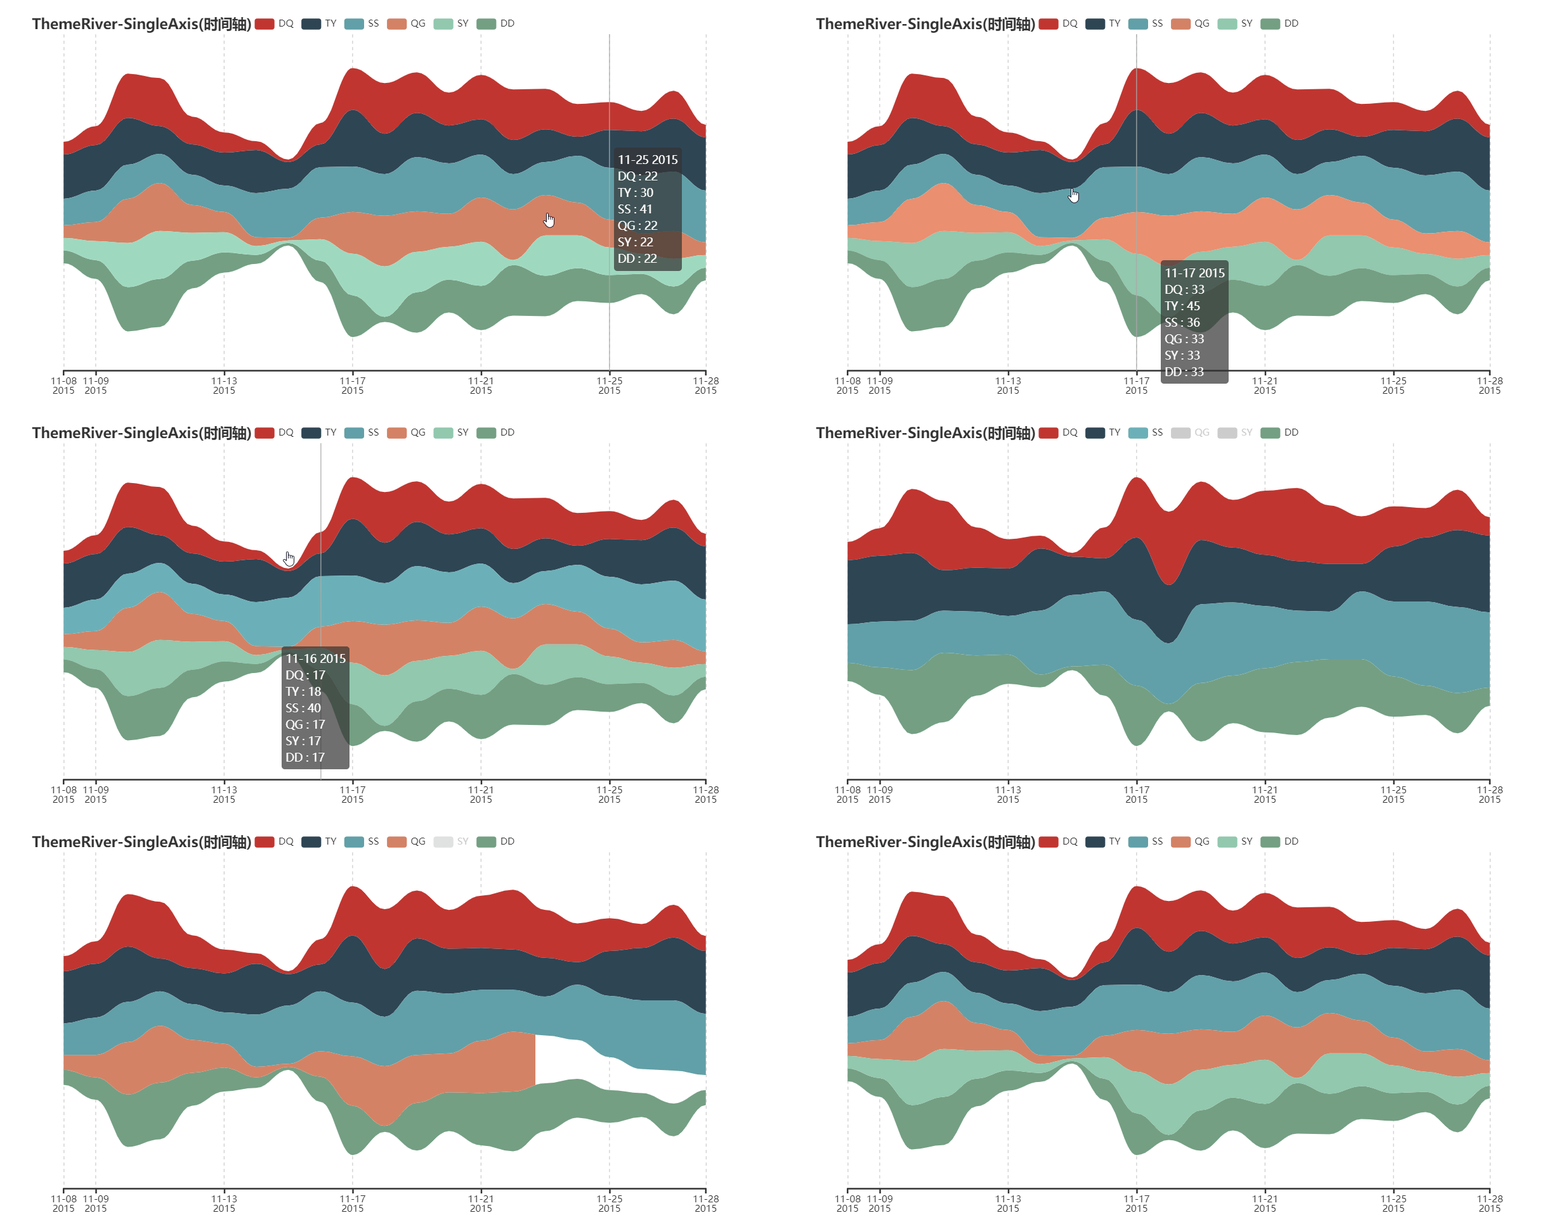
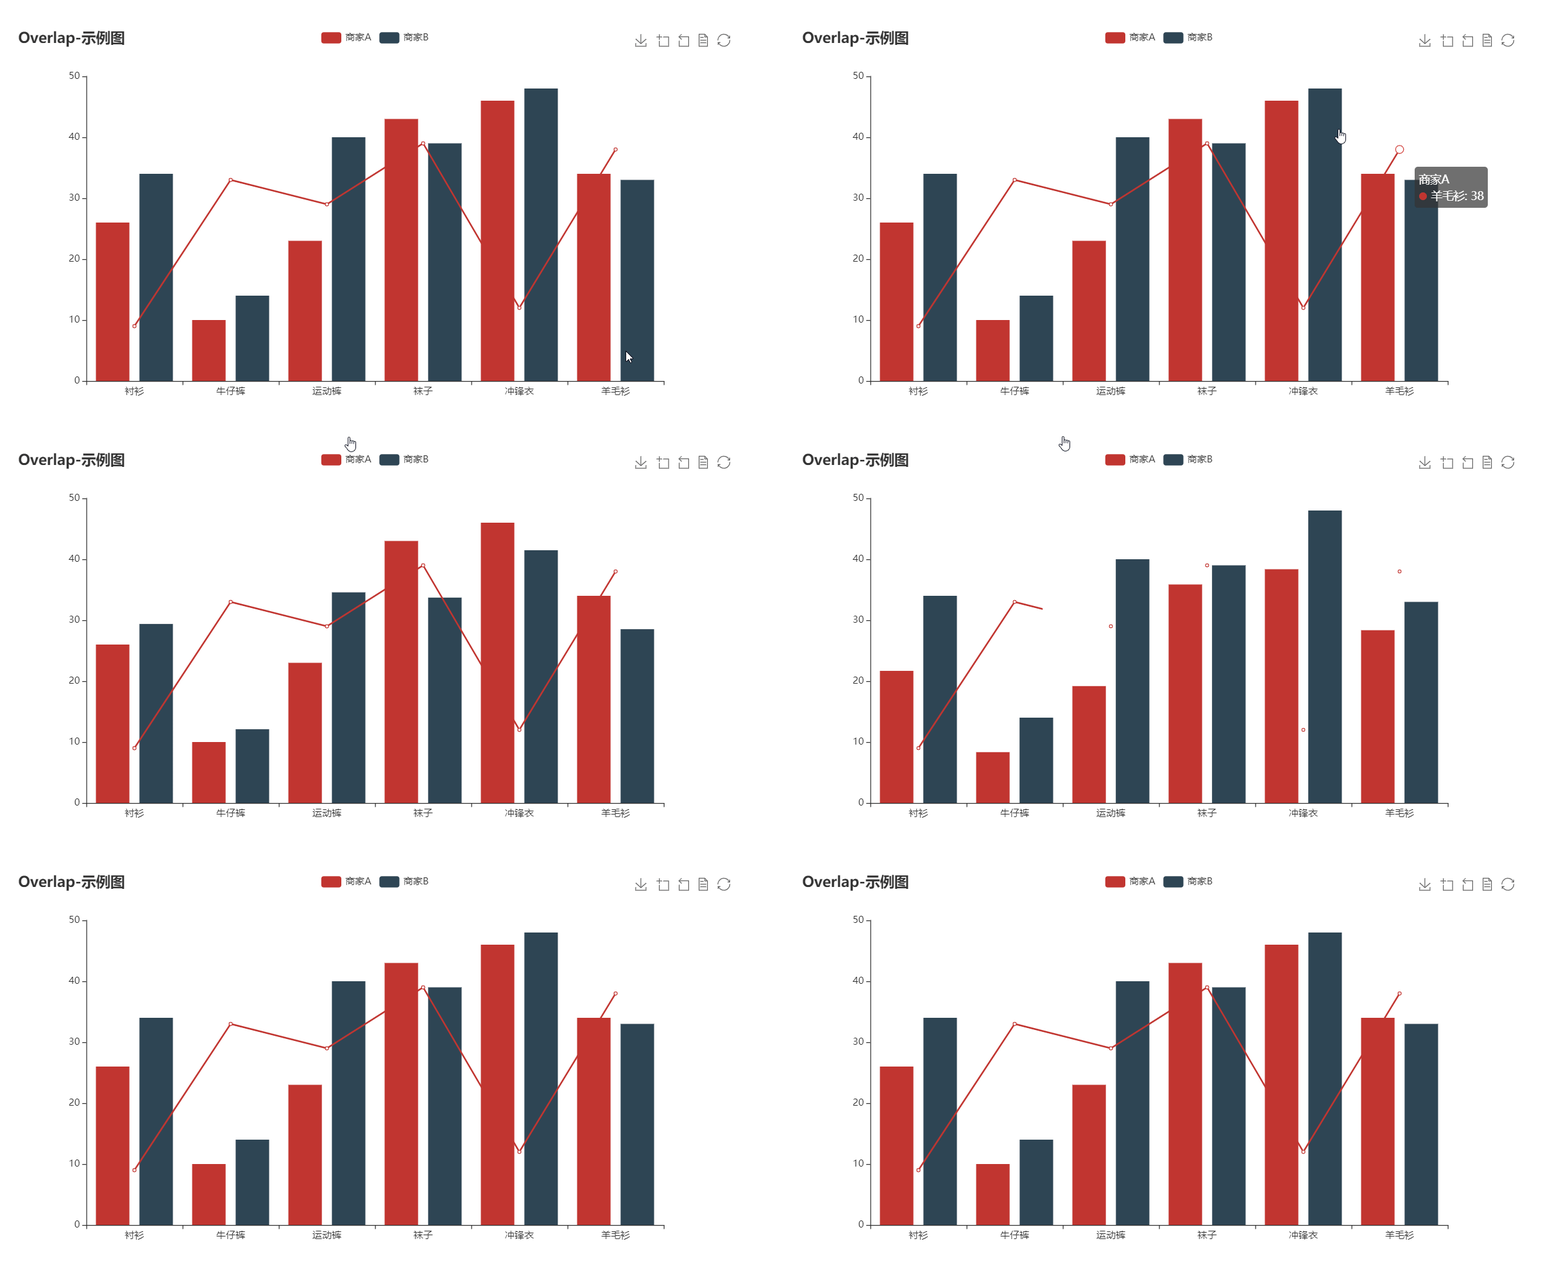
Tipos extensos de gráficos
Indicado para
Aplicações intensivas em dados
Plataformas de análise
Ferramentas de GIS móvel
Aplicativos de engenharia e ciência
Desenvolvimento de painel corporativo
Considerações
Requer conhecimento da configuração do ECharts
Pode aumentar o tamanho do aplicativo devido aos ativos embutidos
O desempenho depende do hardware do dispositivo
Integração limitada com widgets nativos do Flutter
Curva de aprendizado mais acentuada para iniciantes
README original
Snapshot do README original do repositório-fonte vinculado. Consulte o repositório para o conteúdo mais recente.
Archiving Note
After many years, this project, as a transitional solution using Webview, has completed its historical mission and is therefore being archived. We recommend Graphic or other native chart libraries as alternatives.
*A Flutter widget to use [Apache ECharts](https://github.com/apache/incubator-echarts) in a reactive way.*
Features
Reactive Updating
The most exciting feature of Flutter widgets and React components is that the view can update reactively when data changes. Thanks to ECharts' data driven architecture, flutter_echarts implements a reactive way to connect charts with data. The charts automatically re-render when data in the option property changes.
Two Way Communication
The onMessage and extraScript properties provide a way to set two-way event communication between Flutter and JavaScript.
Configurable Extensions
ECharts has a lot of extensions. The extensions property allows you to inject the extension scripts as raw strings. In this way, you can copy these scripts to your source code without being confusing by assets dirs.
ECharts is mainly configured by passing a string value to the JavaScript option property.
You can use jsonEncode() function in dart:convert to convert data in Dart object form:
source: ${jsonEncode(_data1)},
Because JavaScript don't have ''', you can use this operator to reduce some escape operators for quotas:
Echarts(
  option: '''

    // option string

  ''',
),
To use images in option properties, we suggest the Base64 Data URL :
image: 'data:image/png;base64,iVBORw0KG...',
extraScript
String
JavaScript which will execute after the Echarts.init() and before any chart.setOption(). The widget has a Javascript channel named Messager, so you can use this identifier to send messages from JavaScript to Flutter:
Function to handle the message sent by Messager.postMessage() in extraScript .
extensions
List<String>
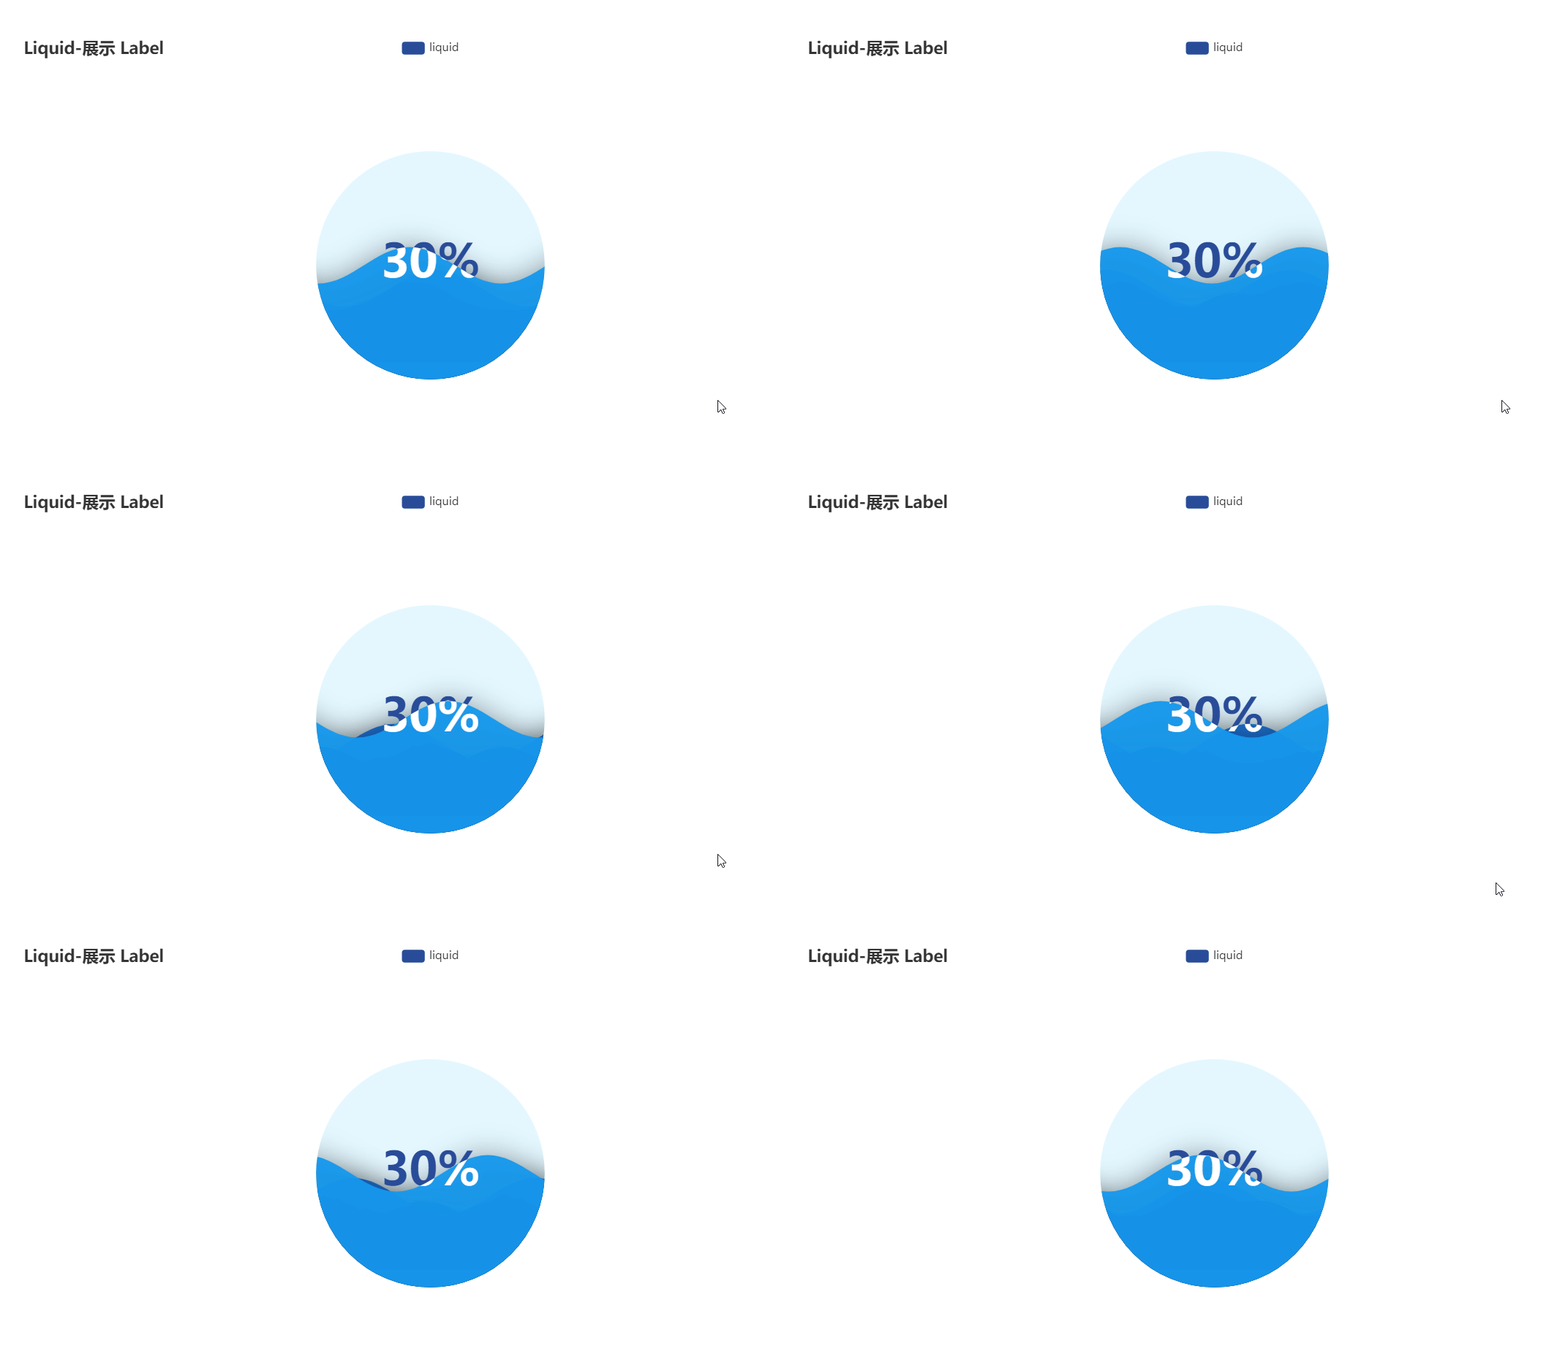
List of strings are from Echarts extensions, such as themes, components, WebGL, and languages. You can download them from the official ECharts extension list. Insert extensions as raw strings:
const liquidPlugin = r'''

  // copy from liquid.min.js

''';
Setting captureAllGestures to true is useful when handling 3D rotation and data zoom bars. Note that setting prevents containers like ListViews from reacting to gestures on the charts.
If true, captureHorizontalGestures and captureVerticalGestures are forced true.
captureHorizontalGestures
bool
( default: false )
Only capture horizontal gestures.
captureVerticalGestures
bool
( default: false )
Only capture vertical gestures.
onLoad
void Function(WebViewController)?
The callback when first time the chart is loaded and rendered. You can get the webview controller from this function to do your magic.
reloadAfterInit
bool
( default: false )
If you have trouble in rendering charts in "Movable Widgets"(ListView, SliverView, PageVIew...) on iOS, try setting reloadAfterInit to true .