Orientação gerada a partir de informações públicas. Apenas para referência.
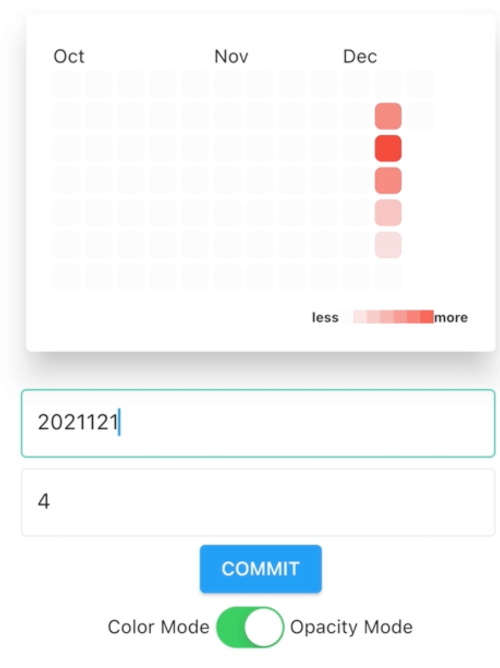
Um pacote Flutter que implementa um calendário de mapa de calor inspirado no gráfico de contribuições do GitHub, oferecendo visualizações tradicionais e de calendário. Ele visualiza dados ao longo das datas usando a intensidade da cor para representar níveis de atividade, sendo ideal para rastrear hábitos, produtividade ou engajamento do usuário ao longo do tempo. O pacote suporta múltiplas plataformas, incluindo Android, iOS, Web, macOS, Windows e Linux, garantindo ampla compatibilidade. Cores personalizáveis, intervalos de data e marcadores de eventos aumentam sua flexibilidade para diversos casos de uso.
Casos de uso
Rastrear hábitos diários
Visualizando o envolvimento do usuário
Monitorando tendências de produtividade
Exibindo histórico de atividades
Planejando eventos recorrentes
Principais recursos
Design de heatmap no estilo GitHub
Modos de visualização dupla (tradicional e calendário)
Intensidade da cor para níveis de atividade
Suporte multiplataforma
Intervalos de data personalizáveis
Integração de marcador de evento
Indicado para
Aplicativos de produtividade
Rastreadores de saúde e condicionamento físico
Painéis de desenvolvedor
análise de atividade do usuário
Ferramentas de rastreamento de hábitos
Considerações
Requer entrada de dados baseada em data
Limitado ao nível de data
Pode ser necessário otimização de desempenho para grandes conjuntos de dados
Não projetado para seleção interativa de datas
Depende da formatação precisa de carimbo de data/hora
README original
Snapshot do README original do repositório-fonte vinculado. Consulte o repositório para o conteúdo mais recente.
Flutter Heatmap Calendar
Flutter Heatmap Calendar inspired by github contribution chart.
Flutter Heatmap Calendar provides traditional contribution chart called HeatMap and calendar version of it called HeatMapCalendar.
Getting started
Depend on it.
flutter pub add flutter_heatmap_calendar
or
Add below line to your personal package's pubspec.yaml.
Sets of color values for its thresholds key value. At least one Color is required. Be aware that only first color will be used if ColorMode is ColorMode.opacity.
defaultColor
Color?
Color(0xFFF8F9FA)
Default color of every block.
textColor
Color?
Color(0xFF8A8A8A)
Color value of every text.
colorMode
ColorMode
ColorMode.opacity
ColorMode.opacity requires just one colorsets value and changes color dynamically based on hightest value of datasets. ColorMode.color changes colors based on colorsets thresholds key value.
size
double?
20
The size of every block.
fontSize
double?
null
The size of every text.
onClick
Function(DateTime)?
null
Callback function which will be called if user clicks the block.
margin
EdgeInsets?
EdgeInsets.all(2)
The margin value of block.
borderRadius
double?
5
Border radius value of block.
scrollable
bool
false
Make HeatMap scrollable if scrollable is true.
showText
bool?
false
Show day text in every block if showText is true.
showColorTip
bool?
true
Show color tip if showColorTip is true.
colorTipHelper
List<Widget?>?
null
Widgets which are shown at left and right side of colorTip. First value is the left side widget and second value is the right side widget. Give null value makes default 'less' and 'more' text.
colorTipCount
int?
7
Length of colorTip block.
colorTipSize
double?
10
The size of colorTip.
HeatMapCalendar
Props
Types
Default
Description
initDate
DateTime?
Today ( DateTime.now() )
Initialized Year/Month value of HeatMapCalendar.
datasets
Map<DateTime, int>?
null
Sets of data which to be displayed.
colorsets
Map<int, Color>
required
Sets of color values for its thresholds key value. At least one Color is required. Be aware that only first color will be used if ColorMode is ColorMode.opacity.
defaultColor
Color?
Color(0xFFF8F9FA)
Default color of every block.
textColor
Color?
Color(0xFF8A8A8A)
Color value of every text.
colorMode
ColorMode
ColorMode.opacity
ColorMode.opacity requires just one colorsets value and changes color dynamically based on hightest value of datasets. ColorMode.color changes colors based on colorsets thresholds key value.
size
double?
42
The size of every block.
fontSize
double?
null
The size of every text.
monthFontSize
double?
12
The size of month label.
weekFontSize
double?
12
The size of week label.
weekTextColor
Color?
Color(0xFF758EA1)
Default color of every block.
onClick
Function(DateTime)?
null
Callback function which will be called if user clicks the block.
margin
EdgeInsets
EdgeInsets.all(2)
The margin value of block.
borderRadius
double?
5
Border radius value of block.
flexible
bool?
false
Makes HeatMapCalendar's size dynamically fit on screen. If flexible is true then, size props will be ignored.
showColorTip
bool?
true
Show color tip if showColorTip is true.
colorTipHelper
List<Widget?>?
null
Widgets which are shown at left and right side of colorTip. First value is the left side widget and second value is the right side widget. Give null value makes default 'less' and 'more' text.
MIT LicenseCopyright (c) 2021KimSeungHwanPermissionis hereby granted, free of charge, to any person obtaining a copy
of this software and associated documentation files (the "Software"), to deal
in the Software without restriction, including without limitation the rights
to use, copy, modify, merge, publish, distribute, sublicense, and/or sell
copies of the Software, and to permit persons to whom the Softwareis
furnished to do so, subject to the following conditions:
The above copyright notice and this permission notice shall be included in all
copies or substantial portions of the Software.
THE SOFTWARE IS PROVIDED "AS IS", WITHOUT WARRANTY OF ANY KIND, EXPRESS OR
IMPLIED, INCLUDING BUT NOT LIMITED TO THE WARRANTIES OF MERCHANTABILITY,
FITNESS FOR A PARTICULAR PURPOSE AND NONINFRINGEMENT. IN NO EVENT SHALL THE
AUTHORS OR COPYRIGHT HOLDERS BE LIABLE FOR ANY CLAIM, DAMAGES OR OTHER
LIABILITY, WHETHER IN AN ACTION OF CONTRACT, TORT OR OTHERWISE, ARISING FROM,
OUT OF OR IN CONNECTION WITH THE SOFTWARE OR THE USE OR OTHER DEALINGS IN THE
SOFTWARE.