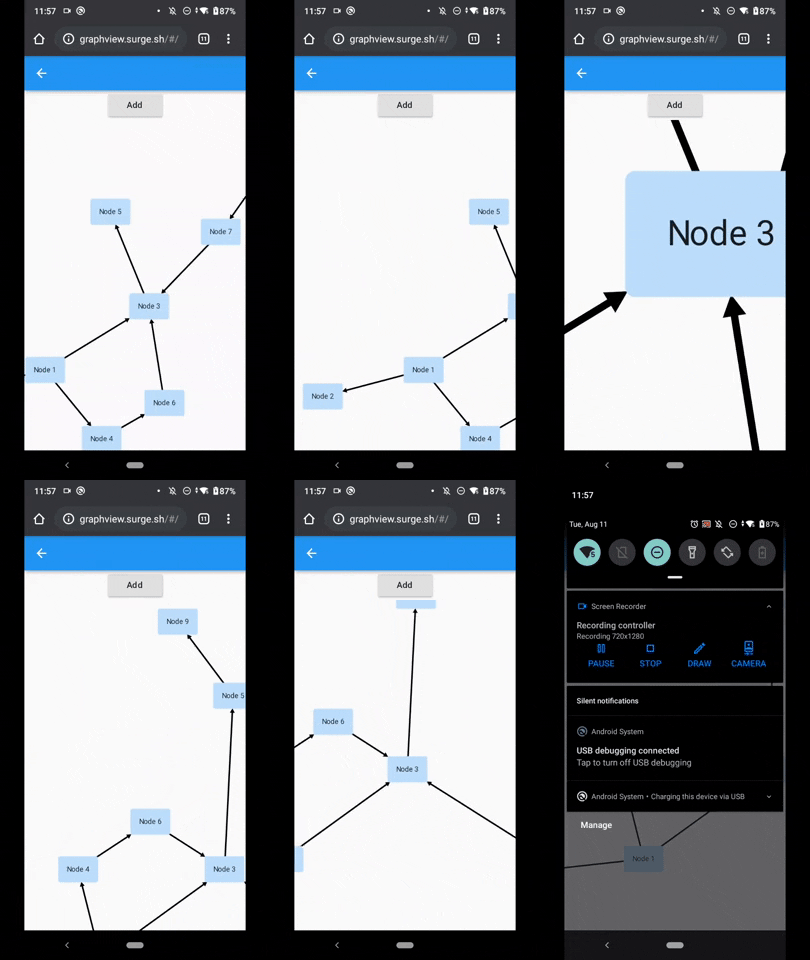
GraphView é usado para exibir dados em estruturas gráficas. Pode exibir layout de árvore, gráfico direcionado e em camadas. Útil para Árvore Genealógica, Visualização Hierárquica.
Orientação gerada a partir de informações públicas. Apenas para referência.
GraphView é um pacote Flutter para visualizar dados como estruturas gráficas interativas. Ele suporta layouts de árvore, grafos direcionados e diagramas em camadas, tornando-o ideal para exibir relações hierárquicas. O pacote permite que desenvolvedores criem representações intuitivas de dados complexos, como árvores genealógicas ou hierarquias organizacionais. Com compatibilidade entre plataformas em Android, iOS, Web, macOS, Windows e Linux, o GraphView garante desempenho e aparência consistentes. Sua API limpa simplifica a integração em aplicativos existentes.
Casos de uso
visualização da árvore familiar
Exibição da hierarquia organizacional
Mapeamento de dependência de dados
Representação de topologia de rede
Renderização de diagrama interativo
Principais recursos
Suporte para layout em árvore
renderização de gráfico direcionado e em camadas
Compatibilidade multiplataforma
Estilo de nó e aresta personalizável
Seleção e navegação de nós interativa
Indicado para
UIs que exigem visualização de dados hierárquicos
Aplicações com modelos de relacionamento complexos
Ferramentas educacionais para ensinar estruturas familiares ou organizacionais
Painéis com pontos de dados interconectados
Considerações
Pode exigir otimização para grandes conjuntos de dados
Efeitos de animação embutidos limitados
A personalização de estilo pode precisar de código adicional
Impacto no desempenho com gráficos profundamente aninhados
README original
Snapshot do README original do repositório-fonte vinculado. Consulte o repositório para o conteúdo mais recente.
GraphView
Get it from
Flutter GraphView is used to display data in graph structures. It can display Tree layout, Directed and Layered graph. Useful for Family Tree, Hierarchy View.
Overview
The library is designed to support different graph layouts and currently works excellent with small graphs. It now includes advanced features like node animations, expand/collapse functionality, and automatic camera positioning.
You can have a look at the flutter web implementation here:
http://graphview.surge.sh/
Node Animations: Smooth expand/collapse animations with customizable duration
Interactive Navigation: Jump to nodes, zoom to fit, auto-centering capabilities
Node Expand/Collapse: Hierarchical node visibility control with animated transitions
Customizable Rendering: Custom edge renderers, paint styling, and node builders
Touch Interactions: Pan, zoom, and tap handling with InteractiveViewer integration
Layouts
Tree
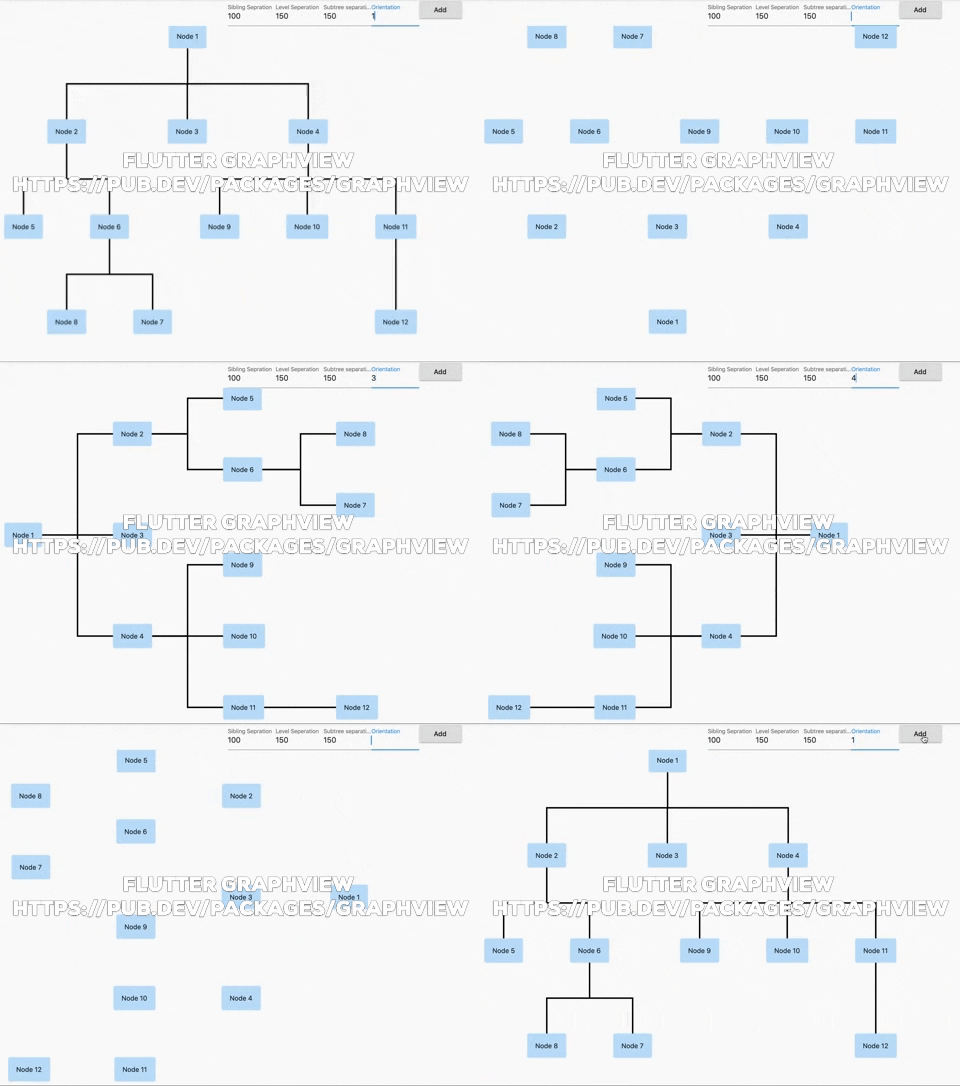
Uses Walker's algorithm with Buchheim's runtime improvements (BuchheimWalkerAlgorithm class). Supports different orientations. All you have to do is using the BuchheimWalkerConfiguration.orientation with either ORIENTATION_LEFT_RIGHT, ORIENTATION_RIGHT_LEFT, ORIENTATION_TOP_BOTTOM and
ORIENTATION_BOTTOM_TOP (default). Furthermore parameters like sibling-, level-, subtree separation can be set.
Useful for: Family Tree, Hierarchy View, Flutter Widget Tree
Tidier Tree
An improved tree layout algorithm (TidierTreeLayoutAlgorithm class) that provides better spacing and positioning for complex hierarchical structures. Supports all orientations and provides cleaner node arrangements.
Useful for: Complex hierarchies, Organizational charts, Decision trees
Directed graph
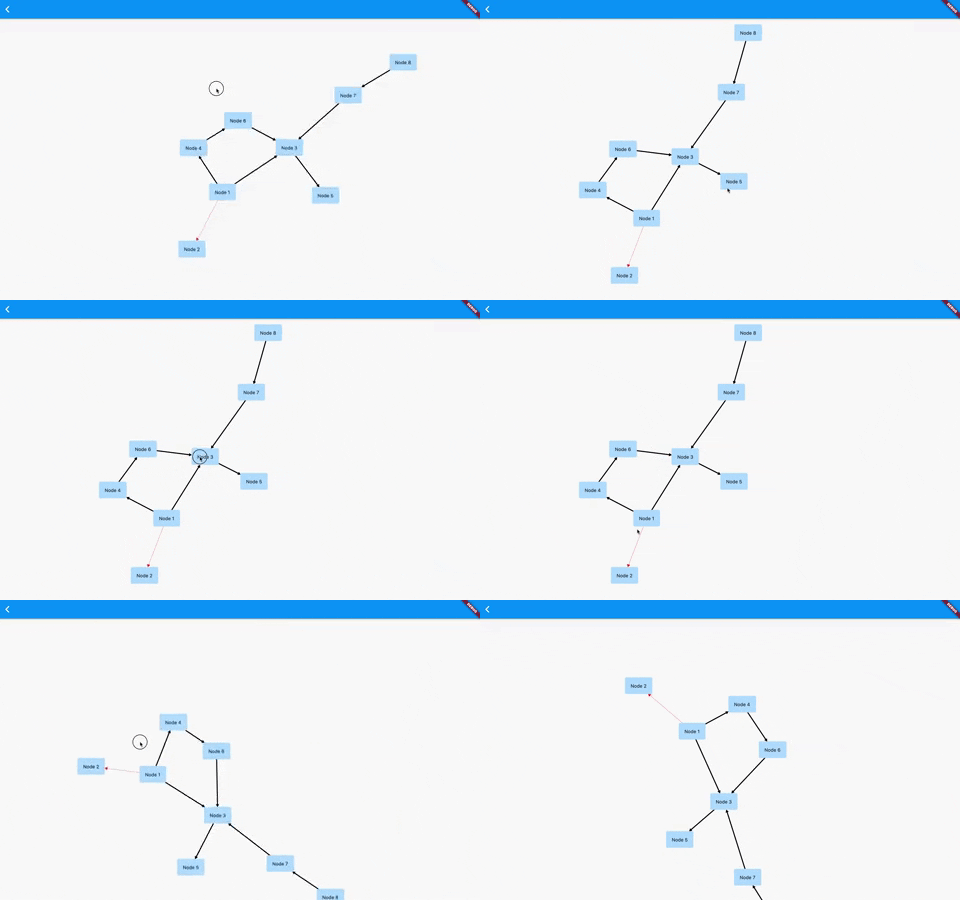
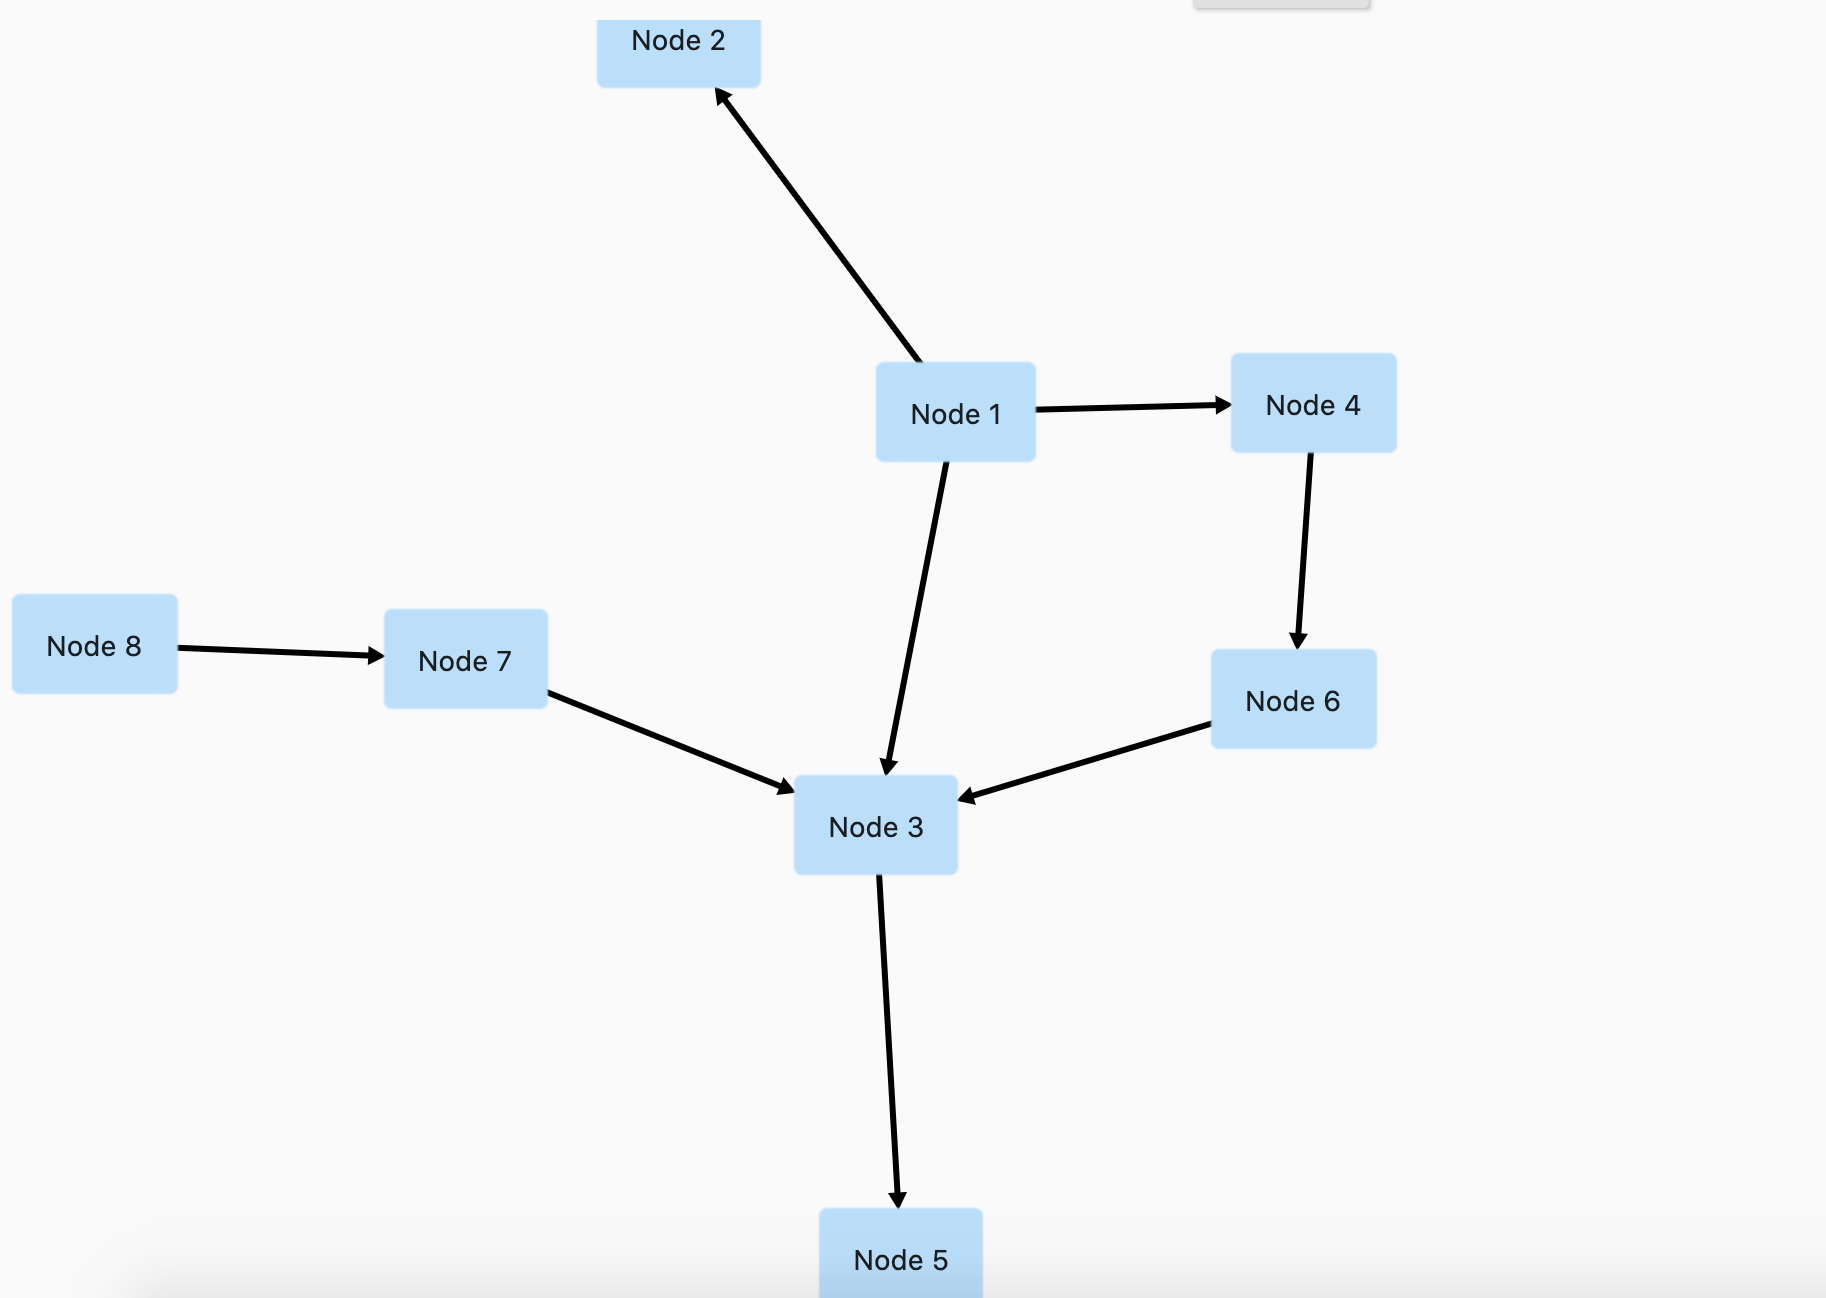
Directed graph drawing by simulating attraction/repulsion forces. For this the algorithm by Fruchterman and Reingold (FruchtermanReingoldAlgorithm class) was implemented.
Useful for: Social network, Mind Map, Cluster, Graphs, Intercity Road Network
Layered graph
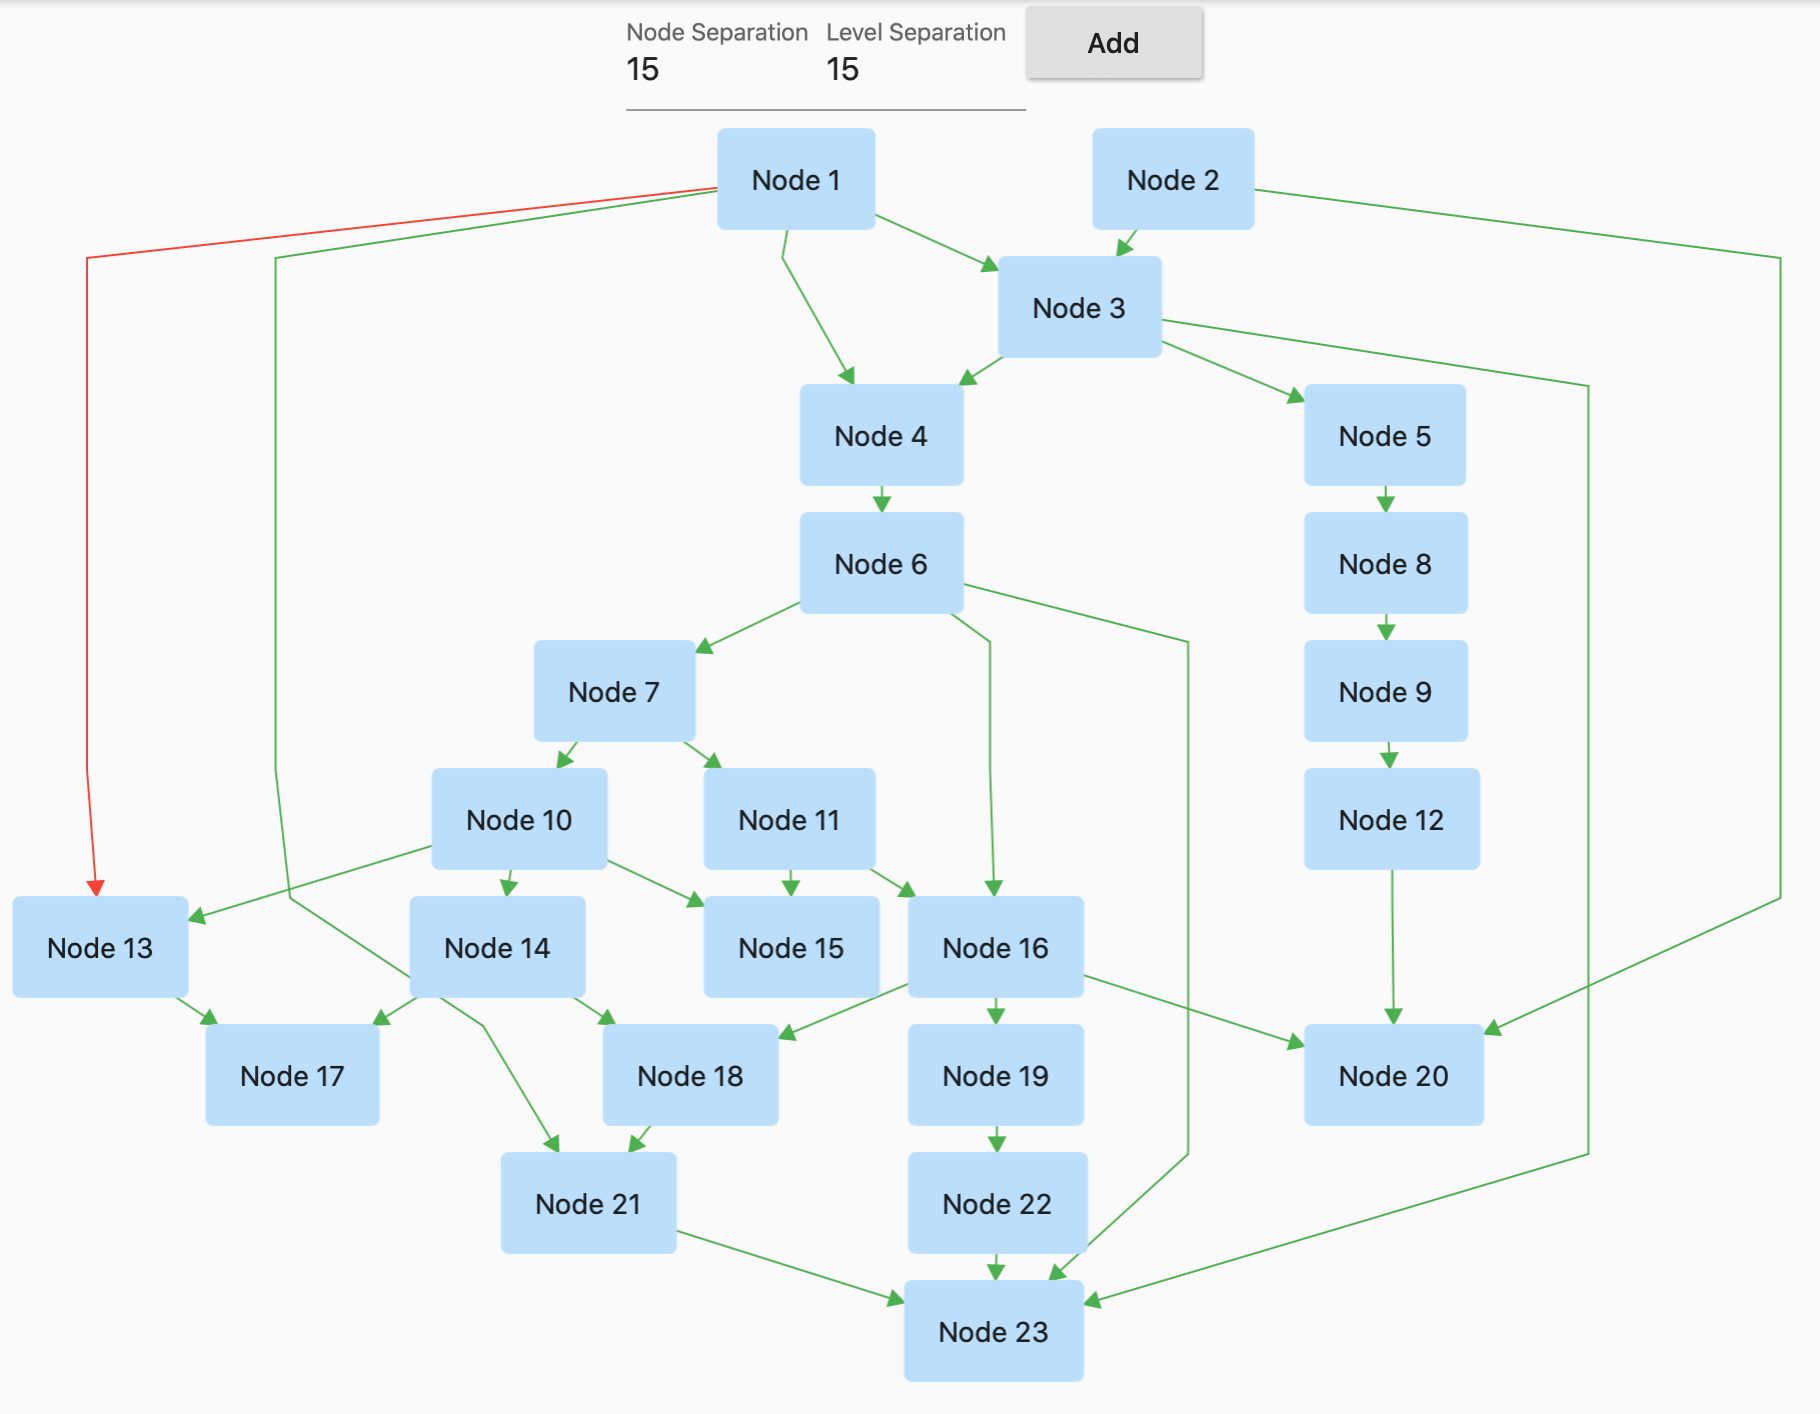
Algorithm from Sugiyama et al. for drawing multilayer graphs, taking advantage of the hierarchical structure of the graph (SugiyamaAlgorithm class). You can also set the parameters for node and level separation using the SugiyamaConfiguration. Supports different orientations. All you have to do is using the SugiyamaConfiguration.orientation with either ORIENTATION_LEFT_RIGHT, ORIENTATION_RIGHT_LEFT, ORIENTATION_TOP_BOTTOM and ORIENTATION_BOTTOM_TOP (default).
Useful for: Hierarchical Graph which it can have weird edges/multiple paths
Balloon Layout
A radial tree layout (BalloonLayoutAlgorithm class) that arranges child nodes in circular patterns around their parents. Creates balloon-like structures that are visually appealing for hierarchical data.
Useful for: Mind maps, Radial trees, Circular hierarchies
Circular Layout
Arranges all nodes in a circle (CircleLayoutAlgorithm class). Includes edge crossing reduction algorithms for better readability. Supports automatic radius calculation and custom positioning.
A tree layout that converts traditional tree structures into radial/polar coordinates (RadialTreeLayoutAlgorithm class). Nodes are positioned based on their distance from the root and angular position.
Specialized layout for mindmap-style visualizations (MindmapAlgorithm class) where child nodes are distributed on left and right sides of the root node.
Useful for: Mind maps, Concept maps, Brainstorming diagrams
Usage
Basic Setup
Currently GraphView must be used together with a Zoom Engine like InteractiveViewer. To change the zoom values just use the different attributes described in the InteractiveViewer class.
To create a graph, we need to instantiate the Graph class. Then we need to pass the layout and also optional the edge renderer.
The enhanced GraphView.builder constructor provides additional capabilities:
GraphView.builder(
graph: graph,
algorithm: BuchheimWalkerAlgorithm(config, TreeEdgeRenderer(config)),
controller: controller,
animated: true, // Enable smooth animations
autoZoomToFit: true, // Automatically zoom to fit all nodes
initialNode: ValueKey('startNode'), // Jump to specific node on init
panAnimationDuration: Duration(milliseconds: 600),
toggleAnimationDuration: Duration(milliseconds: 400),
centerGraph: true, // Center the graph in viewport
builder: (Node node) {
returnYourCustomWidget(node);
},
)
Node Expand/Collapse
Use the GraphViewController to manage node visibility:
final controller = GraphViewController();
// Collapse a node (hide its children)
controller.collapseNode(graph, node, animate: true);
// Expand a collapsed node
controller.expandNode(graph, node, animate: true);
// Toggle collapse/expand state
controller.toggleNodeExpanded(graph, node, animate: true);
// Check if node is collapsedbool isCollapsed = controller.isNodeCollapsed(node);
// Set initially collapsed nodes
controller.setInitiallyCollapsedNodes([node1, node2]);
Navigation and Camera Control
Navigate programmatically through the graph:
// Jump to a specific node
controller.jumpToNode(ValueKey('nodeId'));

// Animate to a node
controller.animateToNode(ValueKey('nodeId'));

// Zoom to fit all visible nodes
controller.zoomToFit();

// Reset view to origin
controller.resetView();

// Force recalculation of layout
controller.forceRecalculation();
Node node = Node.Id(fromNodeId) ;
builder: (Node node) {
// I can decide what widget should be shown here based on the idvar a = node.key.value asint;
if(a ==2)
returnrectangleWidget(a);
elsereturncircleWidget(a);
},
Using Paint to color and line thickness
You can specify the edge color and thickness by using a custom paint
Add an additional parameter paint. Applicable for ArrowEdgeRenderer for now.
var a = Node();
var b = Node();
 graph.addEdge(a, b, paint: Paint()..color = Colors.red);
Add focused Node
You can focus on a specific node. This will allow scrolling to that node in the future, but for now , using it we can drag a node with realtime updates in force directed graph
 onPanUpdate: (details) {
        var x = details.globalPosition.dx;
        var y = details.globalPosition.dy;
        setState(() {
          builder.setFocusedNode(graph.getNodeAtPosition(i));
          graph.getNodeAtPosition(i).position = Offset(x,y);
        });
      },
Extract info from any json to Graph Object
Now its a bit easy to use Ids to extract info from any json to Graph Object
  edges.forEach((element) {
      var fromNodeId = element['from'];
      var toNodeId = element['to'];
      graph.addEdge(Node.Id(fromNodeId), Node.Id(toNodeId));
    });
Step 2: Then using builder and find the nodeValues from the json using id and then set the value of that.
builder: (Node node) {
// I can decide what widget should be shown here based on the idvar a = node.key.value asint;
var nodes = json['nodes'];
var nodeValue = nodes.firstWhere((element) => element['id'] == a);
returnrectangleWidget(nodeValue['label'] asString);
},
This library is basically a dart representation of the excellent Android Library GraphView by Team-Blox
I would like to thank them for open sourcing their code for which reason I was able to port their code to dart and use for flutter.
Future Works
[x] Add nodeOnTap
[x] Add Layered Graph
[x] Animations
[x] Dynamic Node Position update for directed graph
[x] Node expand/collapse functionality
[x] Auto-navigation and camera control
[x] Multiple new layout algorithms (Balloon, Circular, Radial, Tidier, Mindmap)
[ ] Finish Eiglsperger Algorithm
[ ] Custom Edge Label Rendering
[ ] Use a builder pattern to draw items on demand.
License
MIT License
Copyright (c) 2020 Nabil Mosharraf
Permission is hereby granted, free of charge, to any person obtaining a copy
of this software and associated documentation files (the "Software"), to deal
in the Software without restriction, including without limitation the rights
to use, copy, modify, merge, publish, distribute, sublicense, and/or sell
copies of the Software, and to permit persons to whom the Software is
furnished to do so, subject to the following conditions:
The above copyright notice and this permission notice shall be included in all
copies or substantial portions of the Software.
THE SOFTWARE IS PROVIDED "AS IS", WITHOUT WARRANTY OF ANY KIND, EXPRESS OR
IMPLIED, INCLUDING BUT NOT LIMITED TO THE WARRANTIES OF MERCHANTABILITY,
FITNESS FOR A PARTICULAR PURPOSE AND NONINFRINGEMENT. IN NO EVENT SHALL THE
AUTHORS OR COPYRIGHT HOLDERS BE LIABLE FOR ANY CLAIM, DAMAGES OR OTHER
LIABILITY, WHETHER IN AN ACTION OF CONTRACT, TORT OR OTHERWISE, ARISING FROM,
OUT OF OR IN CONNECTION WITH THE SOFTWARE OR THE USE OR OTHER DEALINGS IN THE
SOFTWARE.