패키지, 저장소 및 앱 카테고리 검색

패키지 상세v0.1.0

flutter_circular_chart

Flutter용 애니메이션 레디얼 및 파이 차트

30일 다운로드
282
좋아요
91
Pub 점수
20

패키지 설치

flutter pub add flutter_circular_chart

패키지 개요

공개 정보를 바탕으로 생성한 선택 가이드입니다.

애니메이션 레디얼 및 파이 차트를 생성하기 위한 플러터 패키지입니다. 백분율 기반 데이터를 컴팩트하고 시각적으로 매력적인 형식으로 표시하는 데 이상적인 부드럽고 사용자 정의 가능한 시각화를 제공합니다. 차트는 동적 업데이트를 지원하며 플러터 애플리케이션에 원활하게 통합될 수 있도록 설계되었습니다. 간단한 구성 옵션을 통해 개발자는 대시보드, 통계 또는 진행률 표시기용 매력적인 원형 차트를 쉽게 렌더링할 수 있습니다.

사용 사례

  • 백분율 데이터 표시
  • 대시보드 위젯 만들기
  • 진행률 지표 시각화
  • 인터랙티브 보고서 만들기
  • 애니메이션을 활용한 앱 UI 개선

주요 기능

  • 애니메이션 전환
  • 반경형 및 파이 차트 유형
  • 사용자 지정 가능한 색상 및 레이블
  • 반응형 디자인
  • Flutter와의 간편한 통합

적합한 대상

  • 데이터 시각화 앱
  • 대시보드 인터페이스
  • 진행 상황 추적 기능
  • 교육 도구
  • 모바일 분석 대시보드

고려 사항

  • 원형 차트 유형에 한정
  • 복잡한 레이아웃을 위한 최소한의 사용자 정의
  • 내장된 툴팁 또는 상호작용 없음
  • 간단한 데이터 세트에 가장 적합
  • 대규모 데이터 세트를 수동으로 처리해야 합니다

원본 README

연결된 소스 저장소의 README 원문 스냅샷입니다. 최신 내용은 저장소에서 확인하세요.

pub package

Flutter Circular Chart

A library for creating animated circular chart widgets with Flutter, inspired by Zero to One with Flutter.

Overview

Create easily animated pie charts and radial charts by providing them with data objects they can plot into charts and animate between.

animated_random_radial_chart

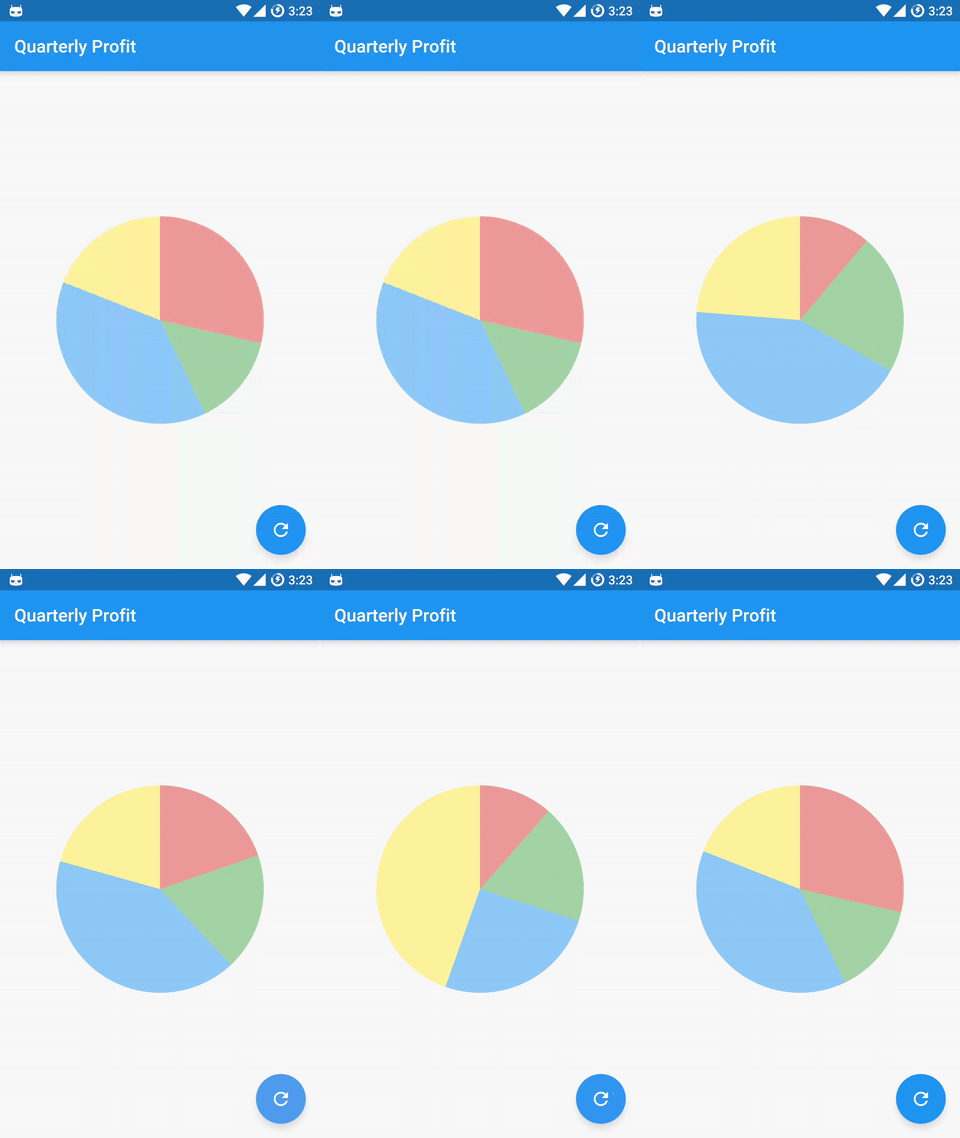
animated pie chart animated radial chart

Check the examples folder for the source code for the above screenshots.

Contents:

Installation

Install the latest version from pub.

Getting Started

Import the package:

import 'package:flutter_circular_chart/flutter_circular_chart.dart';

Create a GlobalKey to be able to access the chart and update its data:

final GlobalKey<AnimatedCircularChartState> _chartKey = new GlobalKey<AnimatedCircularChartState>();

Create chart data entry objects:

List<CircularStackEntry> data = <CircularStackEntry>[
  new CircularStackEntry(
    <CircularSegmentEntry>[
      new CircularSegmentEntry(500.0, Colors.red[200], rankKey: 'Q1'),
      new CircularSegmentEntry(1000.0, Colors.green[200], rankKey: 'Q2'),
      new CircularSegmentEntry(2000.0, Colors.blue[200], rankKey: 'Q3'),
      new CircularSegmentEntry(1000.0, Colors.yellow[200], rankKey: 'Q4'),
    ],
    rankKey: 'Quarterly Profits',
  ),
];

Create an AnimatedCircularChart, passing it the _chartKey and initial data:

@override
Widget build(BuildContext context) {
  return new AnimatedCircularChart(
    key: _chartKey,
    size: const Size(300.0, 300.0),
    initialChartData: data,
    chartType: CircularChartType.Pie,
  );
}

Call updateData to animate the chart:

void _cycleSamples() {
  List<CircularStackEntry> nextData = <CircularStackEntry>[
    new CircularStackEntry(
      <CircularSegmentEntry>[
        new CircularSegmentEntry(1500.0, Colors.red[200], rankKey: 'Q1'),
        new CircularSegmentEntry(750.0, Colors.green[200], rankKey: 'Q2'),
        new CircularSegmentEntry(2000.0, Colors.blue[200], rankKey: 'Q3'),
        new CircularSegmentEntry(1000.0, Colors.yellow[200], rankKey: 'Q4'),
      ],
      rankKey: 'Quarterly Profits',
    ),
  ];
  setState(() {
    _chartKey.currentState.updateData(nextData);
  });
}

Customization

Hole Label:
Property Default
holeLabel null
labelStyle Theme.of(context).textTheme.body2

Example:

new AnimatedCircularChart(
  key: _chartKey,
  size: _chartSize,
  initialChartData: <CircularStackEntry>[
    new CircularStackEntry(
      <CircularSegmentEntry>[
        new CircularSegmentEntry(
          33.33,
          Colors.blue[400],
          rankKey: 'completed',
        ),
        new CircularSegmentEntry(
          66.67,
          Colors.blueGrey[600],
          rankKey: 'remaining',
        ),
      ],
      rankKey: 'progress',
    ),
  ],
  chartType: CircularChartType.Radial,
  percentageValues: true,
  holeLabel: '1/3',
  labelStyle: new TextStyle(
    color: Colors.blueGrey[600],
    fontWeight: FontWeight.bold,
    fontSize: 24.0,
  ),
)

hole label example screenshot


Segment Edge Style:
Property Default
edgeStyle SegmentEdgeStyle.flat
SegmentEdgeStyle Description
flat (default) Segments begin and end with a flat edge.
round Segments begin and end with a semi-circle.

Example:

new AnimatedCircularChart(
  key: _chartKey,
  size: _chartSize,
  initialChartData: <CircularStackEntry>[
    new CircularStackEntry(
      <CircularSegmentEntry>[
        new CircularSegmentEntry(
          33.33,
          Colors.blue[400],
          rankKey: 'completed',
        ),
        new CircularSegmentEntry(
          66.67,
          Colors.blueGrey[600],
          rankKey: 'remaining',
        ),
      ],
      rankKey: 'progress',
    ),
  ],
  chartType: CircularChartType.Radial,
  edgeStyle: SegmentEdgeStyle.round,
  percentageValues: true,
)

round segment edge example screenshot

Details

Chart data entries:

Charts expect a list of CircularStackEntry objects containing the data they need to be drawn.

Each CircularStackEntry corresponds to a complete circle in the chart. For radial charts that is one of the rings, for pie charts it is the whole pie.

Radial charts with multiple CircularStackEntrys will display them as concentric circles.

Each CircularStackEntry is composed of multiple CircularSegmentEntrys containing the value of a data point. In radial charts a segment corresponds to an arc segment of the current ring, for pie charts it is an individual slice.

카테고리

소스 저장소

이 패키지를 사용하는 프로젝트