패키지, 저장소 및 앱 카테고리 검색

graphify 표지
패키지 상세v1.2.1

graphify

Apache Echarts를 기반으로 한 데이터 시각화 차트 라이브러리로, WebGL 3D, 막대 그래프, 선 그래프, 캔들스틱, 레이더, 그래프, 트리 등 고급 차트를 구축할 수 있습니다.

AndroidiOSWebmacOSWindows
30일 다운로드
695
좋아요
45
Pub 점수
135

패키지 설치

flutter pub add graphify

패키지 개요

공개 정보를 바탕으로 생성한 선택 가이드입니다.

Graphify는 Apache Echarts를 기반으로 한 Flutter/Dart 패키지로 고급 데이터 시각화를 생성하기 위한 것입니다. WebGL 3D, 막대 그래프, 선 그래프, 캔들스틱, 레이더, 그래프, 트리 차트 등 다양한 차트 유형을 지원합니다. 크로스 플랫폼 사용을 위해 설계되어 Android, iOS, Web, macOS 및 Windows에서 원활하게 작동합니다. 개발자가 최소한의 설정으로 상호작용 가능하고 고성능의 시각화를 구축할 수 있도록 합니다. 대시보드, 분석 앱 및 데이터 중심 인터페이스에 이상적이며, Graphify는 강력한 차트 기능을 직접 Flutter 애플리케이션에 제공합니다.

사용 사례

  • 인터랙티브 대시보드
  • 실시간 데이터 모니터링
  • 재무 차트
  • 데이터 분석 플랫폼
  • 과학 시각화

주요 기능

  • WebGL 3D 차트를 지원합니다
  • 다양한 차트 유형(막대, 선, 캔들스틱 등)
  • 크로스 플랫폼 호환성
  • 고성능 렌더링
  • Flutter와의 간편한 통합
  • 사용자 정의 가능한 시각적 테마

적합한 대상

  • 데이터 분석가
  • 대시보드 개발자
  • 금융 앱 제작자
  • 교육 소프트웨어
  • 시각화 중심 앱

고려 사항

  • Echarts 개념을 이해해야 합니다
  • WebGL로 인해 번들 크기가 더 클 수 있습니다
  • 제한된 네이티브 플러터 위젯 사용자 정의
  • 복잡한 시각화에 가장 적합하며, 간단한 차트에는 적합하지 않습니다
  • 외부 Echarts 라이브러리에 의존

원본 README

연결된 소스 저장소의 README 원문 스냅샷입니다. 최신 내용은 저장소에서 확인하세요.

graphify_banner

Pub Package GitHub Repo stars GitHub closed issues GitHub open issues GitHub contributors Contributing

GRAPHIFY

A data visualization charts library, based on Apache Echarts, able to build advanced charts like WebGL 3D, Bar, Line, Candlestick, Radar, Graph, Tree etc.

A Flutter package that serves as a bridge to Apache ECharts for creating interactive charts and data visualizations in your Flutter applications.

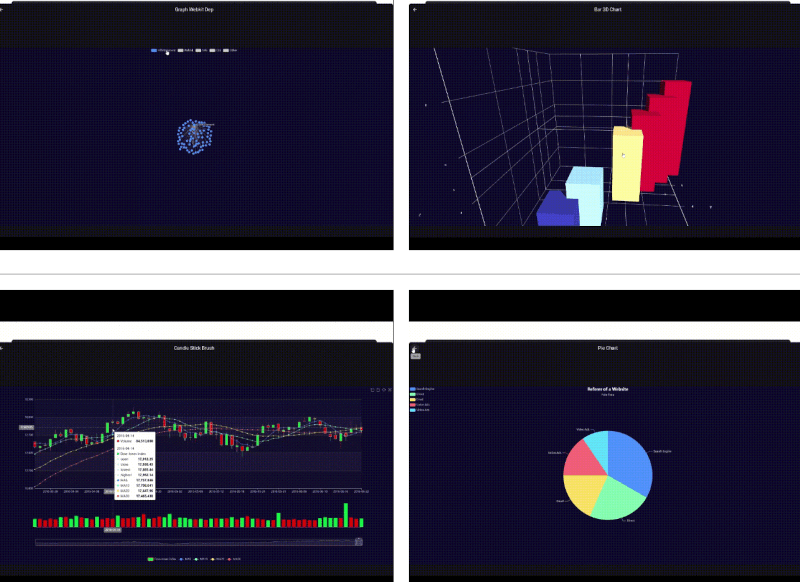
graph_webkit_dep bar_3d_chart
candle_stick_brush all

See demo
Echarts Examples
Pub.dev

Content

Features
Installation
Quick Start
Basic Example
Parameters and Settings
License
Contributing

Features

  • Apache ECharts Integration: Leverage the full power of Apache ECharts directly within your Flutter app.
  • Flexible Configuration: Pass chart configurations as JSON to render interactive visualizations.
  • All ECharts Features: You can find here eCharts features

Installation

How quickly you can install the package you can find here.

Quick Start

Importing the Package

Import the package into your Dart file:

import 'package:graphify/graphify.dart';
Basic Example

Below is a minimal example demonstrating how to display a bar chart:

class BasicBarChart extends StatefulWidget {
  const BasicBarChart({super.key});

  @override
  State<BasicBarChart> createState() => _BasicBarChartState();
}

class _BasicBarChartState extends State<BasicBarChart> {

  final controller = GraphifyController();

  @override
  Widget build(BuildContext context) {
    return GraphifyView(
      controller: controller,
      initialOptions: const {
        "xAxis": {
          "type": "category",
          "data": ["Mon", "Tue", "Wed", "Thu", "Fri", "Sat", "Sun"]
        },
        "yAxis": {
          "type": "value"
        },
        "series": [
          {
            "data": [120, 200, 150, 80, 70, 110, 130],
            "type": "bar"
          }
        ]
      },
    );
  }

  @override
  void dispose() {
    controller.dispose();
    super.dispose();
  }

}

Parameters and Settings

A string containing the JSON configuration for the chart, based on the Apache ECharts documentation.

Documentation and Support

Refer to the Apache ECharts Documentation for detailed configuration options and features. For source code, issue tracking, and contributions, visit the GitHub repository.

License

This project is licensed under the MIT License.

Contributing

We welcome your contributions!

  1. Fork the repository and create a branch for your changes.
  2. Commit your changes with clear messages.
  3. Open a pull request describing your work.

For bug reports or feature requests, please open an issue.

Thank you!

카테고리

의존성

의존성 목록 2 개

소스 저장소

이 패키지를 사용하는 프로젝트

아직 데이터가 없습니다.