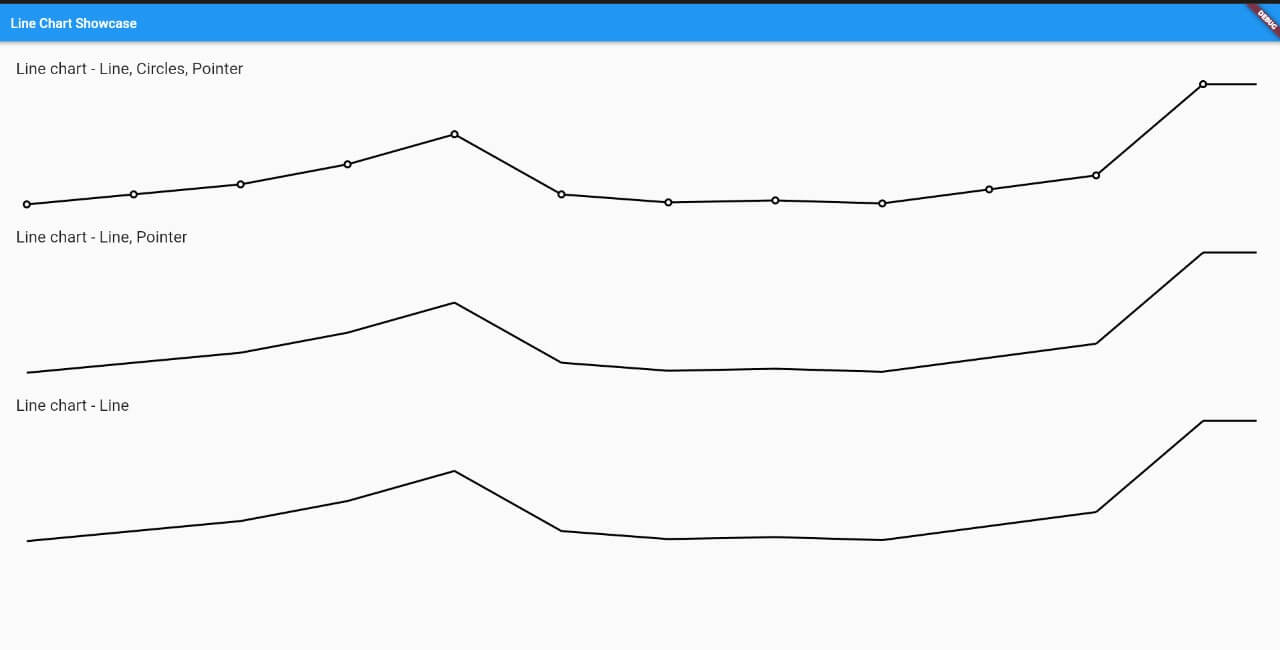
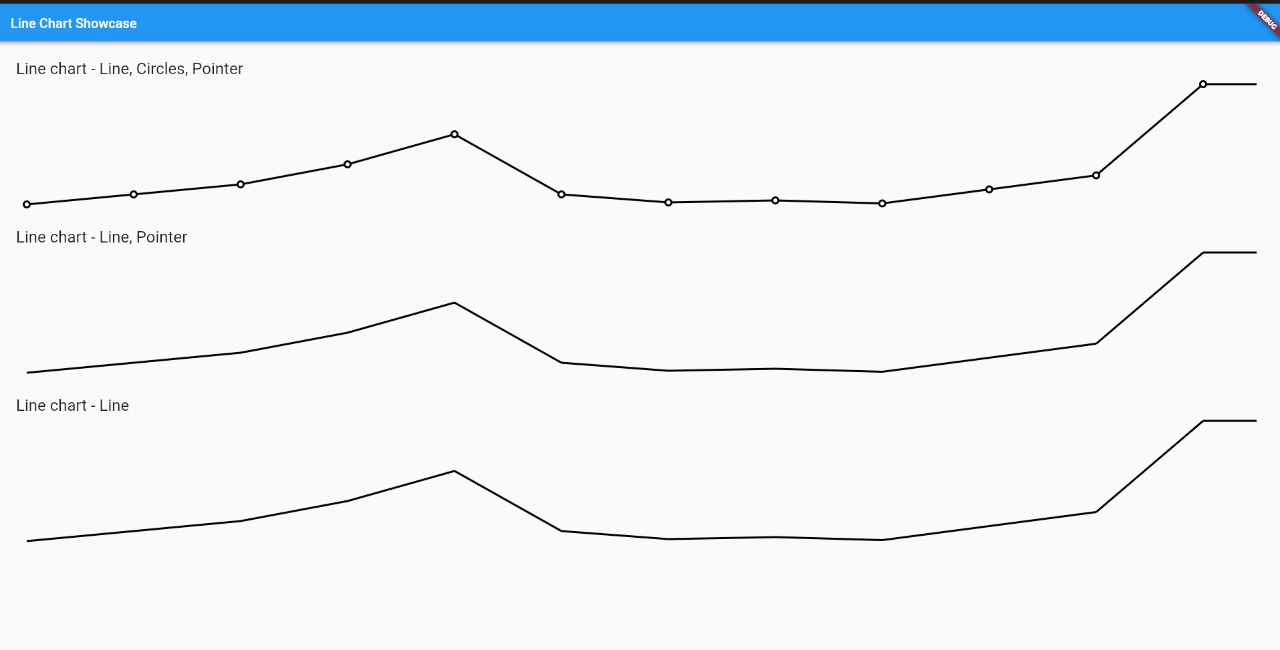
사용자 정의 가능한 선 그래프를 생성하기 위한 간단한 Flutter 패키지입니다. Android, iOS, Web, macOS, Windows, Linux 등 여러 플랫폼에서 부드럽고 상호작용 가능한 선을 사용하여 데이터 추세를 시각화할 수 있습니다. 사용의 용이성과 유연성을 중시하며 색상, 레이블, 격자선 및 차트 동작을 사용자 지정할 수 있습니다. 실시간 또는 과거 데이터를 깔끔하고 직관적인 형식으로 표현해야 하는 앱에 적합합니다.
사용 사례
시계열 데이터 표시
성능 지표 시각화
시간이 지남에 따라 사용자 활동 추적
재무 또는 매출 추세 제시
동적 차트를 사용한 대시보드 만들기
주요 기능
사용자 정의 가능한 선 색상 및 스타일
다중 데이터 시리즈 지원
인터랙티브 터치 이벤트
사용자 정의 가능한 축 레이블 및 격자선
기기 간 반응형 디자인
적합한 대상
데이터 기반 애플리케이션
분석 대시보드
시각화 기능을 갖춘 모바일 및 웹 앱
그래프가 포함된 교육 도구
차트 인터페이스 프로토타이핑
고려 사항
행 기반 시각화에 제한됨
내장된 툴팁 또는 범례 없음
복잡한 데이터 포맷팅을 수동으로 처리해야 합니다
대규모 데이터 세트에 최적화되지 않음
고급 기능을 위해 외부 종속성에 의존합니다
원본 README
연결된 소스 저장소의 README 원문 스냅샷입니다. 최신 내용은 저장소에서 확인하세요.
Line Chart
A simple flutter package to create a custom line chart
Installations
Add line_chart: ^1.0.9 in your pubspec.yaml dependencies. And import it:
Simply create a LineChart widget and pass the required params:
LineChart(
  width: 300, // Width size of chart
  height: 180, // Height size of chart
  data: [], // The value to the chart
  linePaint: Paint()
      ..strokeWidth = 3
      ..style = PaintingStyle.stroke
      ..color = Colors.black, // Custom paint for the line
),
Here is the widget with all options for use.
LineChart(
  width: 300, // Width size of chart
  height: 180, // Height size of chart
  data: [], // The value to the chart
  linePaint: Paint()
      ..strokeWidth = 3
      ..style = PaintingStyle.stroke
      ..color = Colors.black, // Custom paint for the line
  circlePaint: Paint()..color = Colors.black, // Custom paint for the line
  showPointer: true, // When press or pan update the chart, create a pointer in approximated value (The default is true)
  showCircles: true, // Show the circle in every value of chart
  customDraw: (Canvas canvas, Size size) {}, // You can draw anything in your chart, this callback is called when is generating the chart
  circleRadiusValue: 6, // The radius value of circle
  linePointerDecoration: BoxDecoration(
    color: Colors.black,
  ) // Your line pointer decoration,
  pointerDecoration: BoxDecoration(
    shape: BoxShape.circle,
    color: Colors.black,
  ) // Your decoration of circle pointer,
  insideCirclePaint: Paint()..color = Colors.white // On your circle of the chart, have a second circle, which is inside and a slightly smaller size.
  onValuePointer: (MonthChartModel value) {
    print('onValuePointer');
  } // This callback is called when change the pointer,
  onDropPointer: () {
    print('onDropPointer');
  }, // This callback is called when it is on the pointer and removes your finger from the screen
),
For a more detail example please take a look at the example folder.
-
If something is missing, feel free to open a ticket or contribute!