패키지, 저장소 및 앱 카테고리 검색

stacked_bar_chart 표지
패키지 상세v1.1.0+2

stacked_bar_chart

스크롤이 가능하고 개발자의 필요에 따라 맞춤 설정할 수 있는 그래프를 그릴 수 있는 플러터 라이브러리입니다.

AndroidiOSWebmacOSWindowsLinux
30일 다운로드
16
좋아요
38
Pub 점수
130

패키지 설치

flutter pub add stacked_bar_chart

패키지 개요

공개 정보를 바탕으로 생성한 선택 가이드입니다.

사용자 정의가 가능하고 스크롤 가능한 스택형 막대 차트를 생성하기 위한 플러터 라이브러리입니다. 유연한 시각화 도구가 필요한 개발자를 위해 설계되었으며, 안드로이드, iOS, 웹, macOS, 윈도우, 리눅스 등 여러 플랫폼에서 동적 데이터 렌더링을 지원합니다. 부드러운 스크롤과 광범위한 스타일링 옵션을 통해 앱 디자인 요구 사항에 맞는 직관적인 데이터 표현이 가능합니다. 계층별 데이터 비교가 중요한 대시보드, 분석 및 보고서 인터페이스에 적합합니다.

사용 사례

  • 데이터 대시보드
  • 분석 보고
  • 재무 추세 시각화
  • 교육 앱
  • 재고 추적
  • 성능 모니터링

주요 기능

  • 스크롤 가능한 차트
  • 사용자 지정 가능한 색상 및 스타일
  • 다중 레이어 막대 시각화
  • 반응형 디자인
  • 플랫폼에 관계없는 지원
  • 동적 데이터 업데이트

적합한 대상

  • 데이터 중심 앱을 개발하는 개발자
  • 인터랙티브 차트가 필요한 UI 디자이너
  • 크로스 플랫폼 프로젝트를 진행하는 팀
  • 분석 중심 애플리케이션
  • 실시간 데이터 시각화

고려 사항

  • 차트 데이터 구조에 대한 이해가 필요합니다
  • 복잡한 상호작용을 위해 추가적인 상태 관리가 필요할 수 있습니다
  • 매우 큰 데이터 세트 사용 시 성능 영향
  • 제한된 내장 툴팁 또는 주석
  • 사용자 정의 스타일링을 위해서는 추가 코드가 필요할 수 있습니다

원본 README

연결된 소스 저장소의 README 원문 스냅샷입니다. 최신 내용은 저장소에서 확인하세요.

stacked_bar_chart

A Flutter package for creating different types of charts.This package gives developer the flexibility to customize their graph as well.

img

Features

  1. Plot graphs

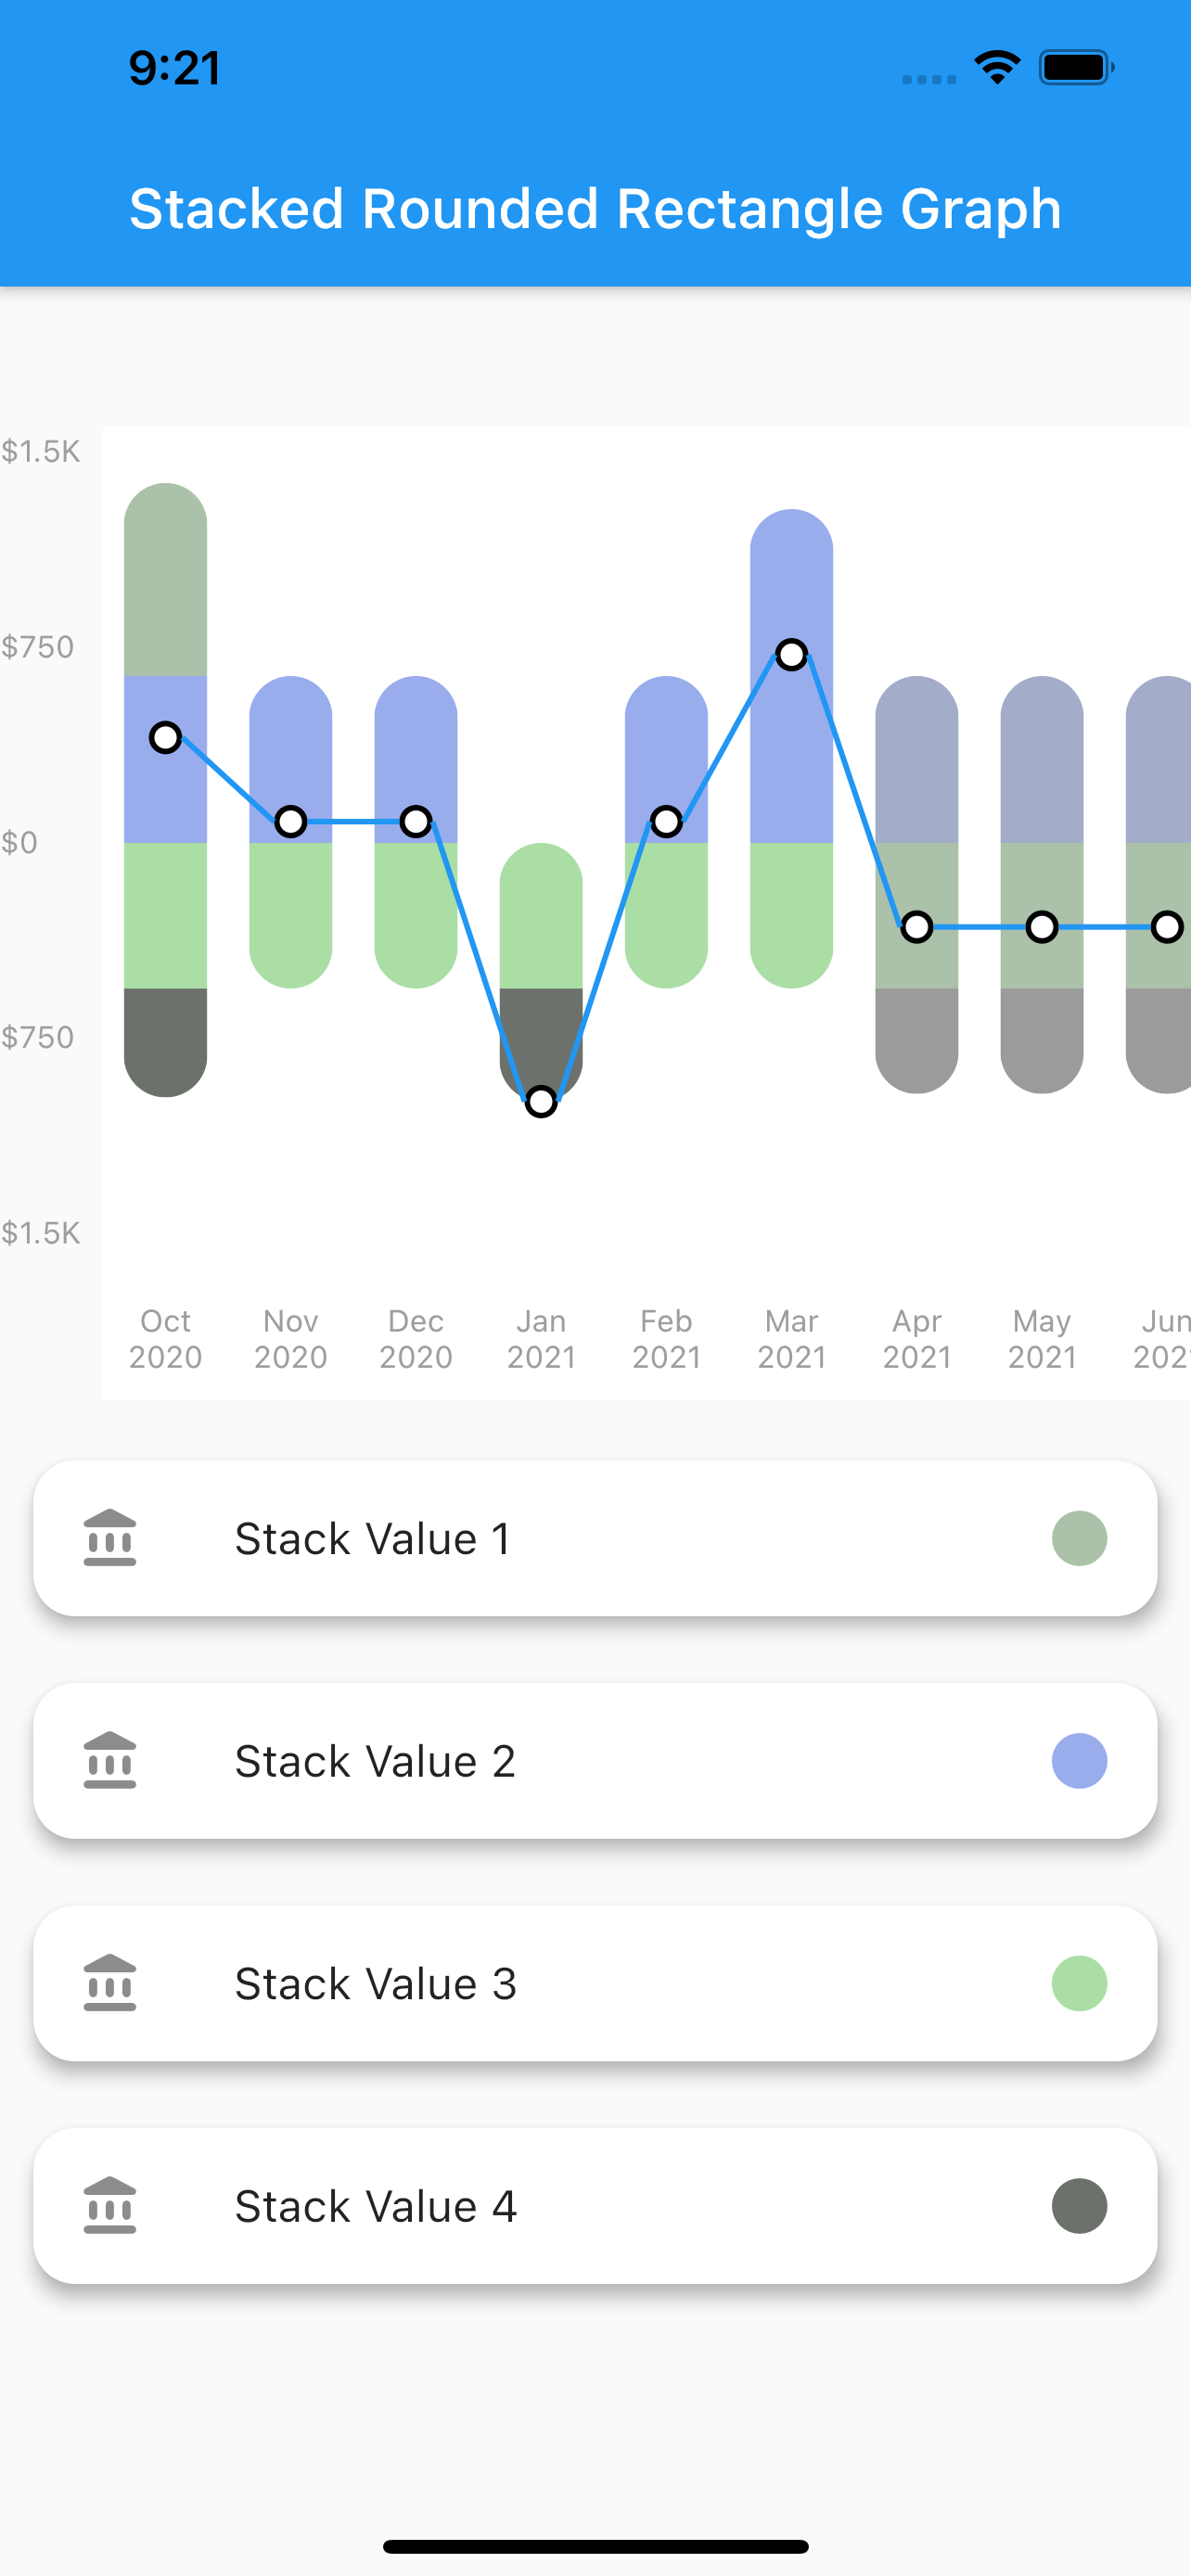
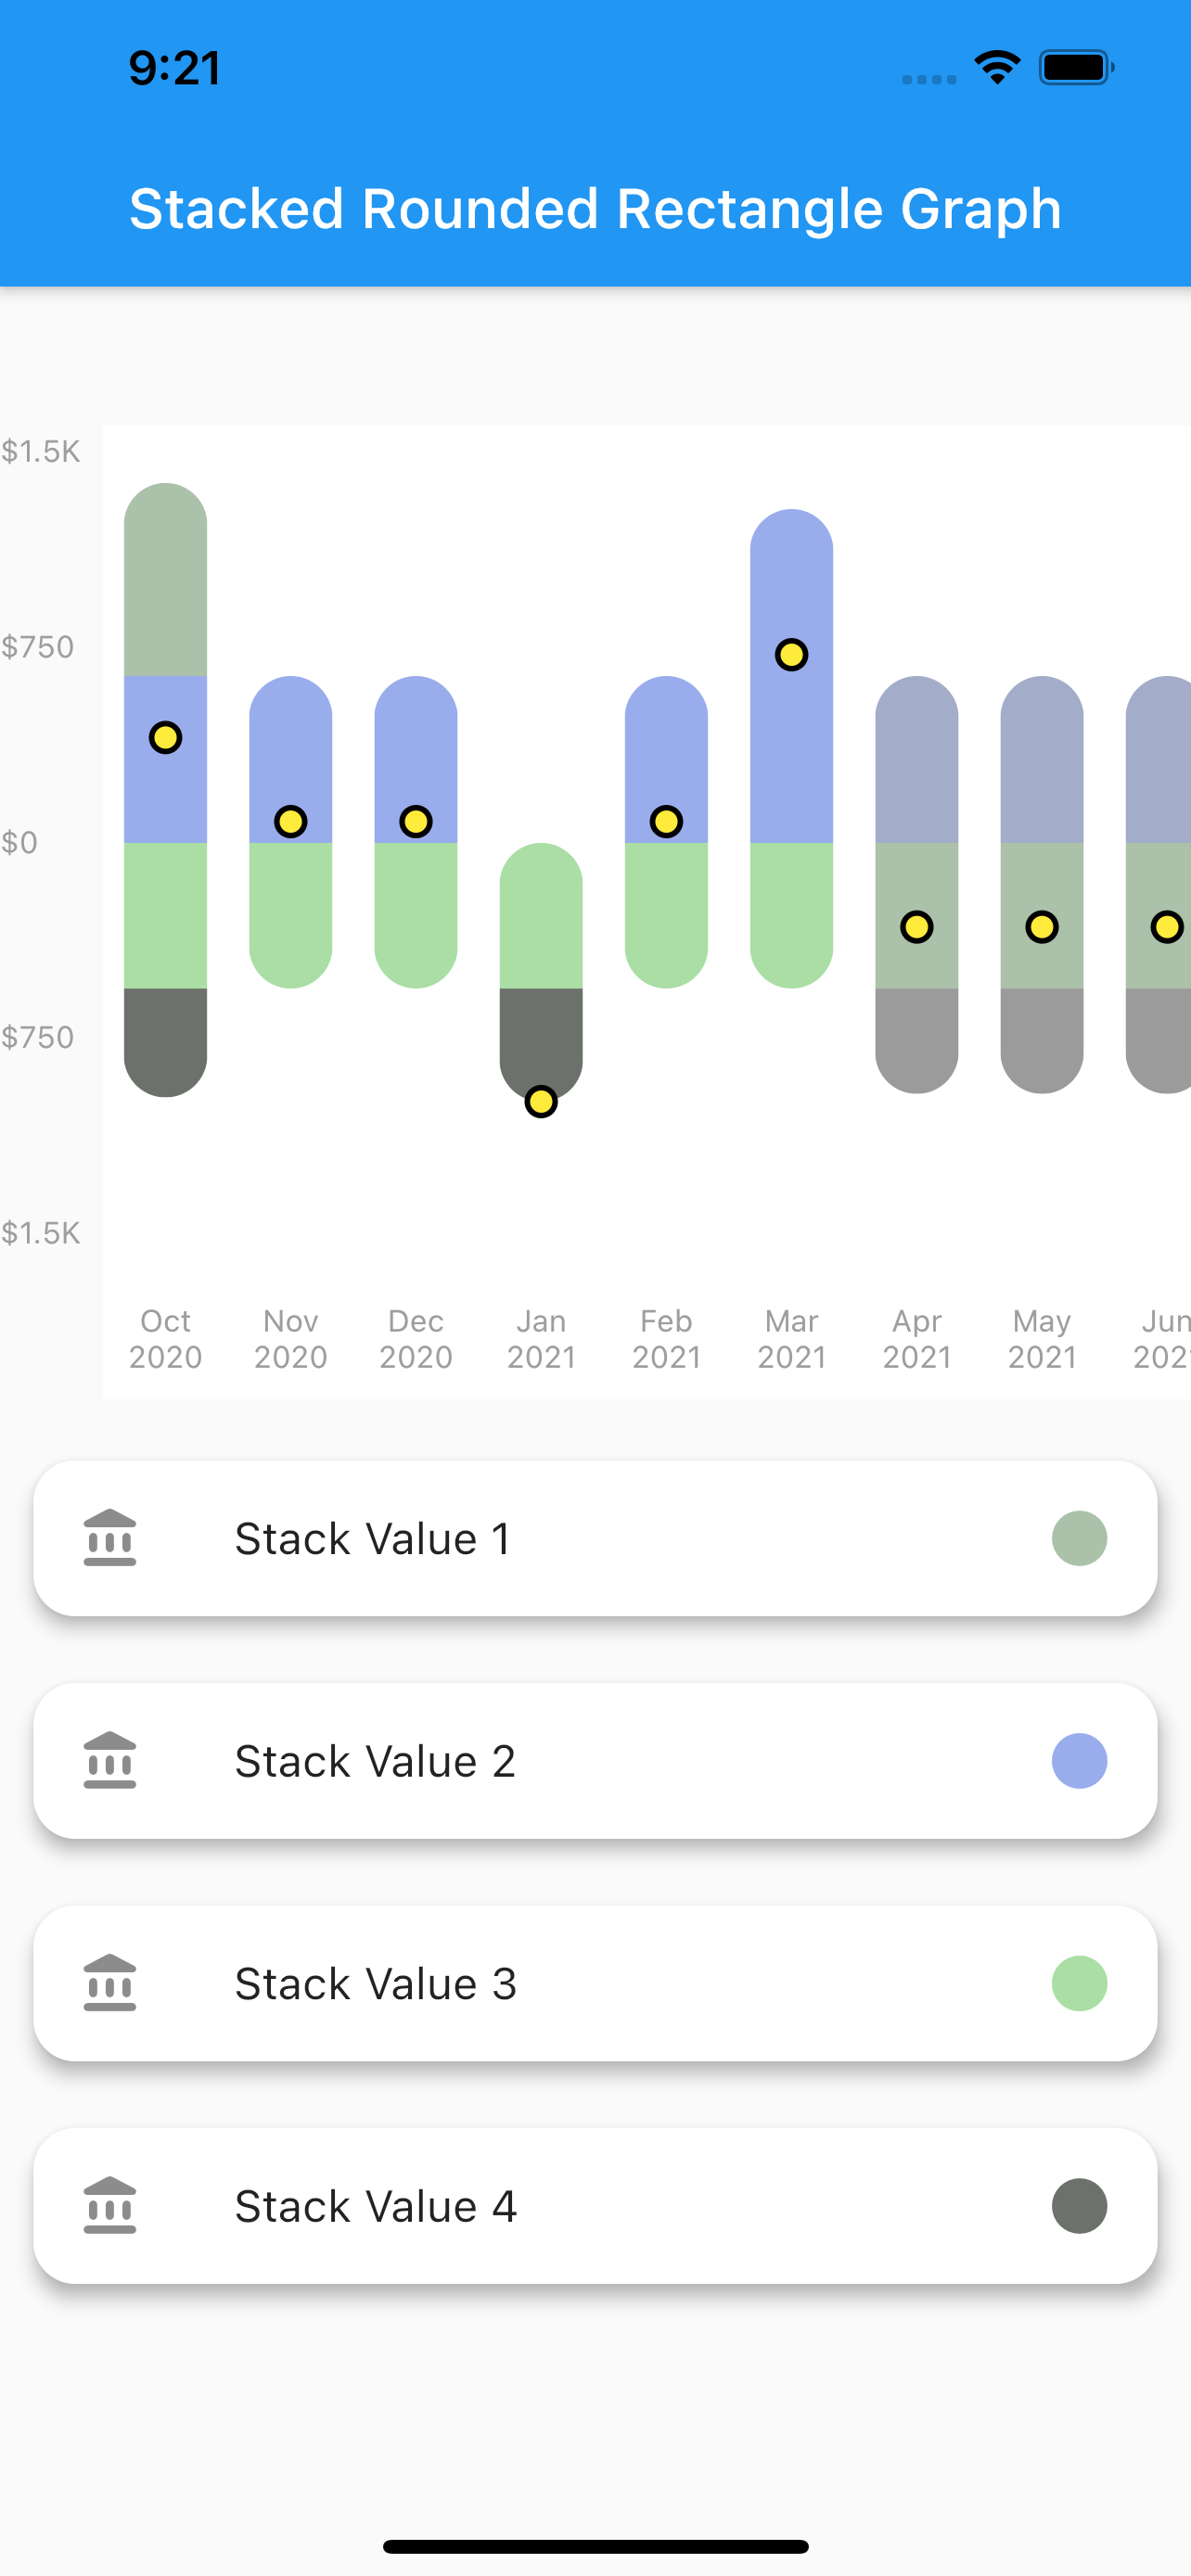
    • Stacked Rounded Rectangle Graph
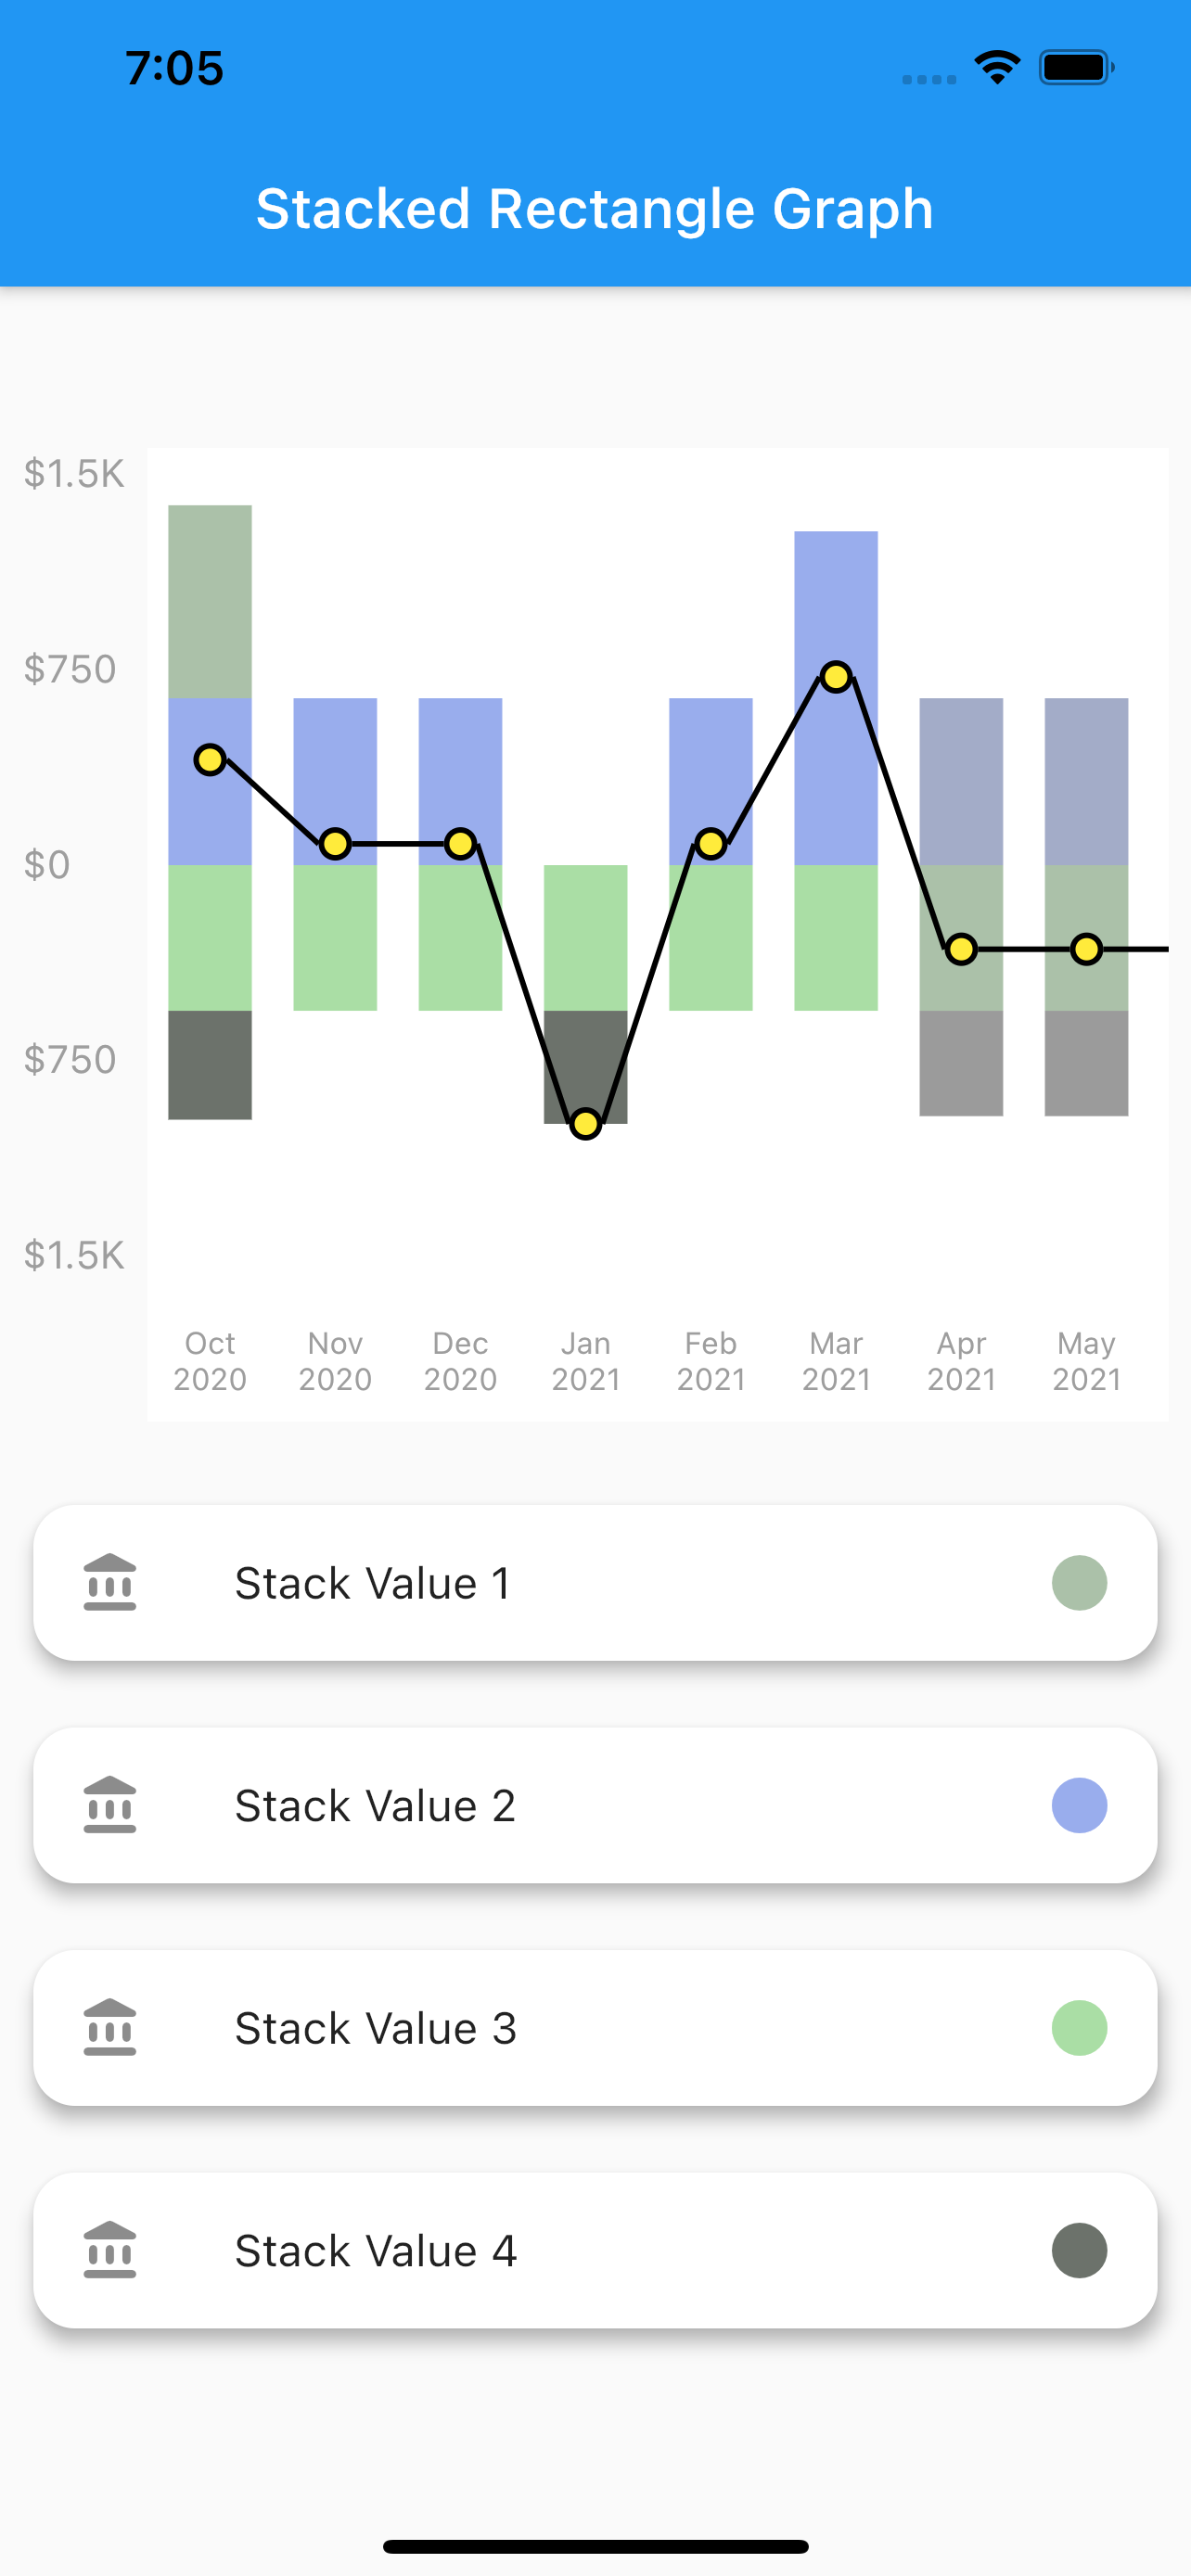
    • Stacked Rectangele Graph
    • Net Line Graph
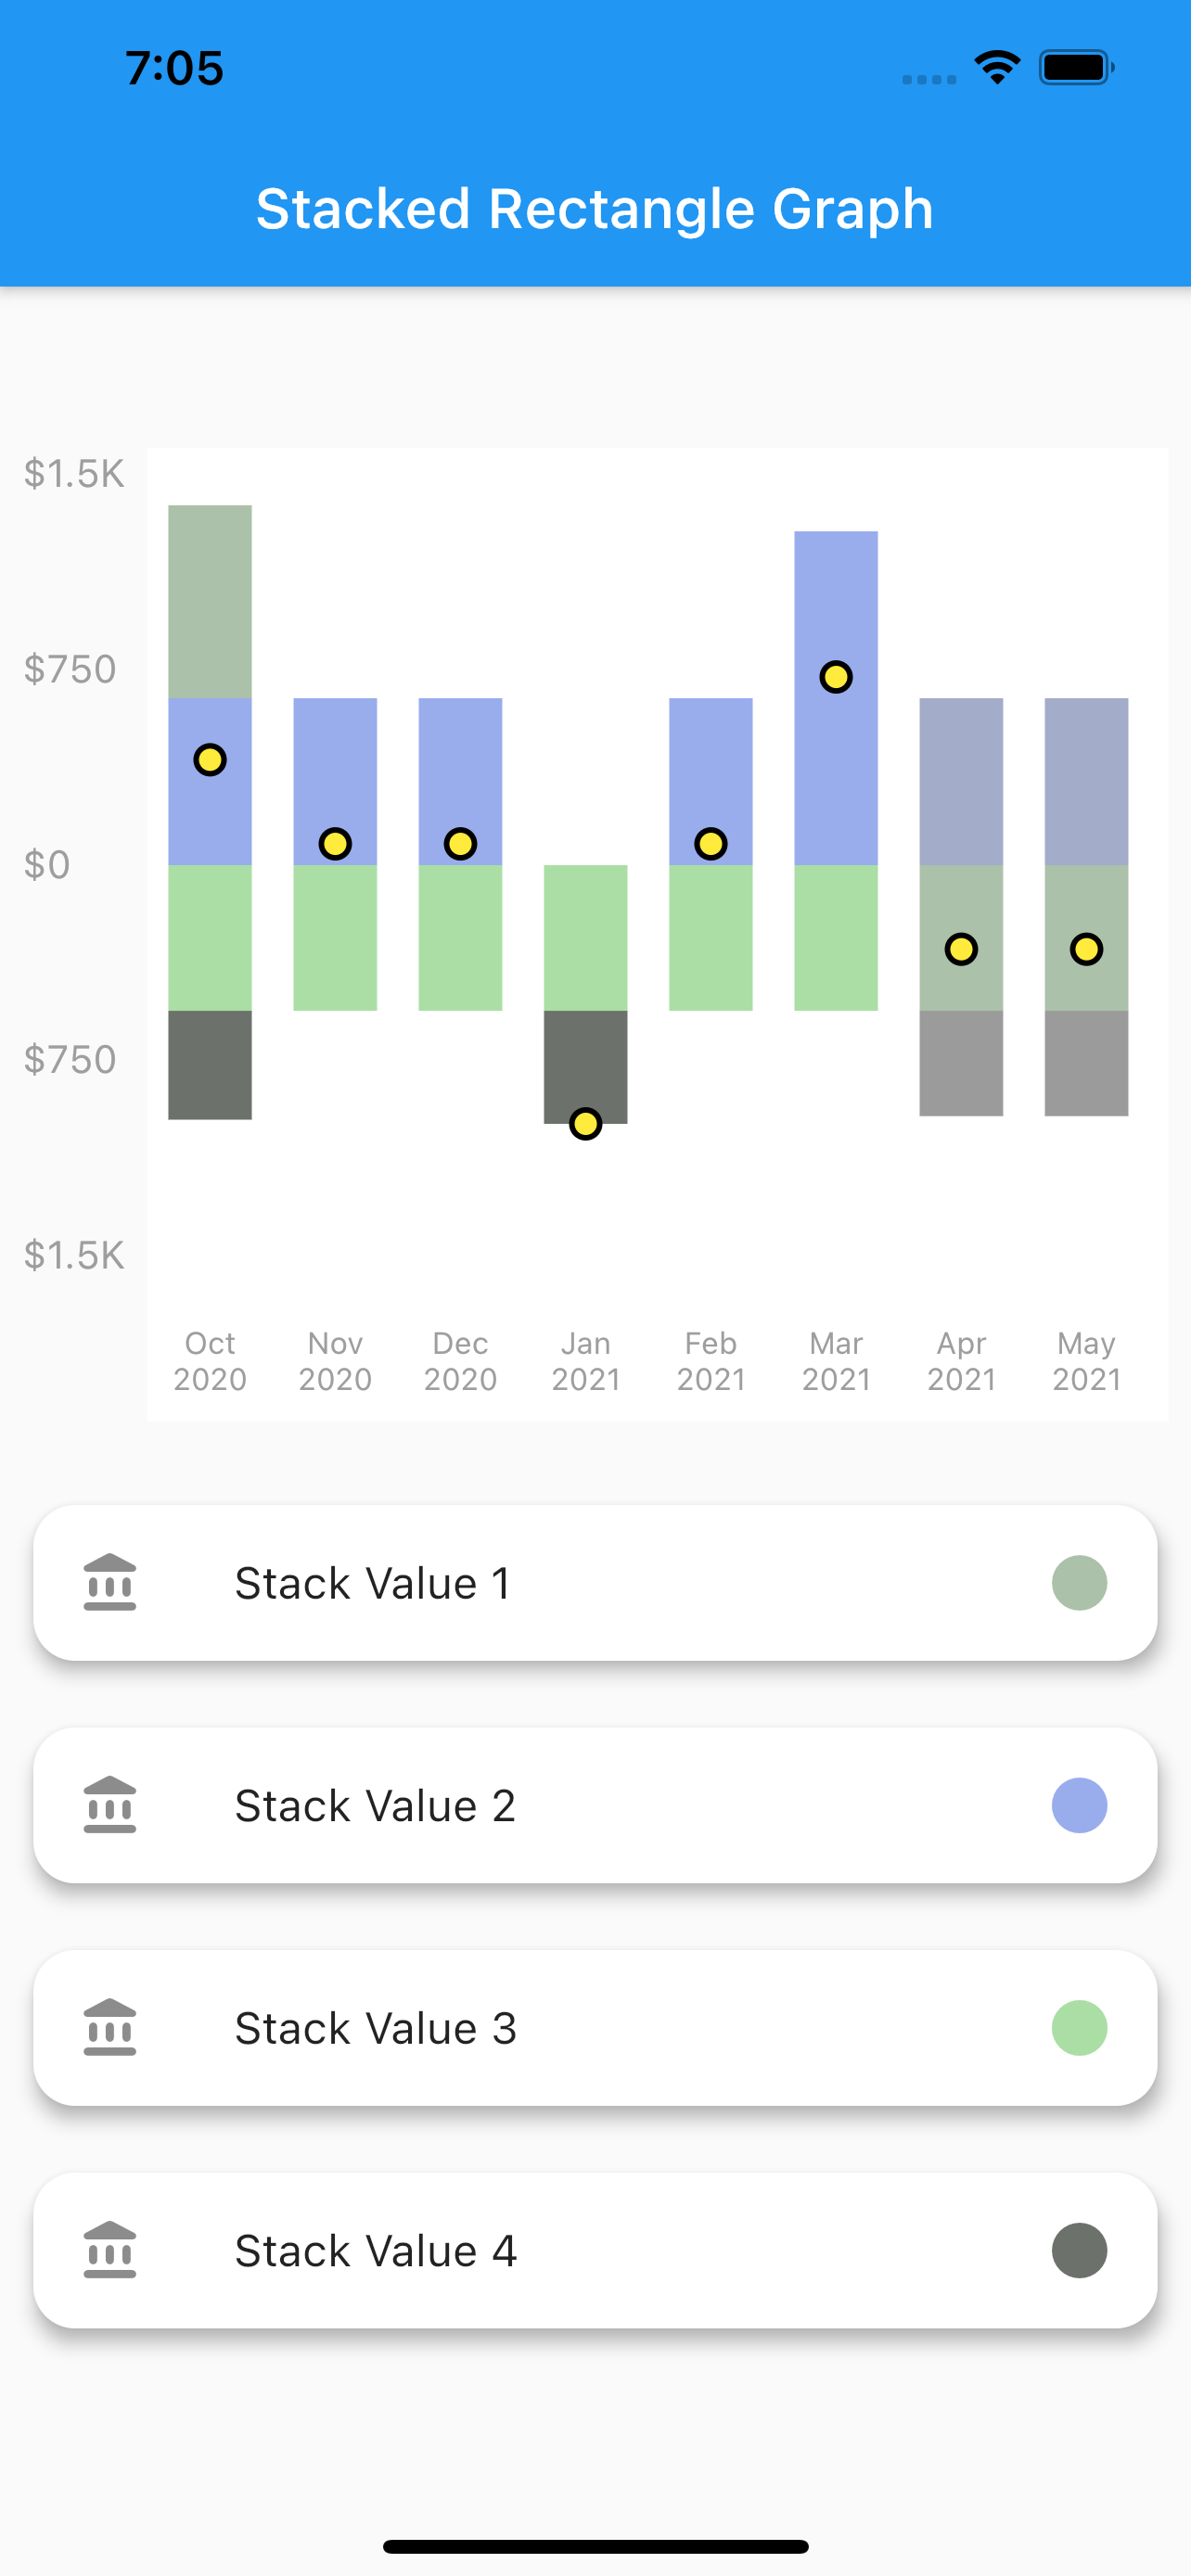
    • Net Point Graph
  2. Customize your graph

    • Select if you want to display the net line
    • change core color,line color as well as line width of the net line
  3. Scrollable

    • The graphs plotted are scrollable
  4. Provide data in json format

    • You can use the toMap() and forMap() methods to provide your data in json format
  5. Style your Labels

    • You can style both you X-axis and Y-axis Labels.
  6. Callback on bar tap

    • A callback is provided on tap of each bar. Developer can use this feature as per their need.

Installation

In the dependencies: section of your pubspec.yaml, add the following line:

stacked_bar_chart:

Then import it as :

import 'package:stacked_bar_chart/stacked_bar_chart.dart';

Graph Types

1. Stacked Rounded Rectangle Graph

  • A simple stacked bar graph with rounded borders.

img

  • To plot this graph pass the GraphType.StackedRounded in graphType. as shown below
graphType: GraphType.StackedRounded

You can also change the styling of the line and point plotted.The color,width etc. can be changed using the netLine parameter as :

netLine: NetLine(
                showPointOnly: false,
                showLine: true,
                lineColor: Colors.blue,
                pointBorderColor: Colors.black,
                coreColor: Colors.white,
              ),

img img img

2. Stacked Rectangle Graph

  • A simple stacked bar graph with no rounded borders. You can customize it in the same way as the stacked rounded rectangle graph.

  • To plot this graph pass the GraphType.StackedRect in graphType. as shown below

graphType: GraphType.StackedRect

img img img

3. Net Line Graph

  • A simple line graph plotted with the net values of the data provided. The net values of a particular data is calculated and plotted.It can also be customized in the same way as stacked rounded rectangle graph.

  • To plot this graph pass the GraphType.StackedRect in graphType. as shown below

graphType: GraphType.LineGraph

img

4. Net Point Graph

  • A simple plot of the net values of the data.You can customize the point core and it's outer border using the netPoint parameter.

  • To plot this graph pass the GraphType.StackedRect in graphType. and then pass parameters in netLine to remove the line as shown below

graphType: GraphType.LineGraph
netLine: NetLine(
                showPointOnly: true,
                showLine: false,
                lineColor: Colors.blue,
                pointBorderColor: Colors.black,
                coreColor: Colors.white,
              ),

img

USAGE

class StackedBarGraph extends StatefulWidget {
  StackedBarGraph({Key key}) : super(key: key);

  @override
  _StackedBarGraphState createState() => _StackedBarGraphState();
}

class _StackedBarGraphState extends State<StackedBarGraph> {
  @override
  Widget build(BuildContext context) {
    return Scaffold(
      appBar: AppBar(
        title: Text("Stacked Rounded Rectangle Graph"),
      ),
      body: Column(
        children: [
          SizedBox(
            height: 50,
          ),
          Graph(
            yLabelConfiguration: YLabelConfiguration(
              yLabelStyle: TextStyle(
                color: Colors.grey,
                fontSize: 11,
              ),
              interval: 500,
              labelCount: 5,
              yLabelMapper: (num value) {
                return NumberFormat.compactCurrency(
                        locale: "en", decimalDigits: 0, symbol: "\$")
                    .format(value);
              },
            ),
            xLabelConfiguration: XLabelConfiguration(
              xLabelStyle: TextStyle(
                color: Colors.grey,
                fontSize: 11,
              ),
              xLabelMapper: (DateTime date) {
                return DateFormat("MMM yyyy").format(date);
              },
            ),
            netLine: NetLine(
              showLine: true,
              lineColor: Colors.black,
              pointBorderColor: Colors.black,
              coreColor: Colors.yellow,
            ),
            graphType: GraphType.StackedRounded,
            data: GraphData(
              backgroundColor: Colors.white,
              name: "ThePension",
              bars: [
                GraphBar(
                  month: DateTime(2020, 01),
                  sections: [
                    GraphBarSection(value: 200, color: Colors.pink),
                    GraphBarSection(value: 900, color: Colors.blue),
                    GraphBarSection(value: -200, color: Colors.amber),
                    GraphBarSection(value: -700, color: Colors.purple),
                  ],
                ),
                GraphBar(
                  month: DateTime(2020, 2),
                  sections: [
                    GraphBarSection(value: 300, color: Colors.pink),
                    GraphBarSection(value: 700, color: Colors.blue),
                    GraphBarSection(value: -400, color: Colors.amber),
                    GraphBarSection(value: -600, color: Colors.purple),
                  ],
                ),
                GraphBar(
                  month: DateTime(2020, 3),
                  sections: [
                    GraphBarSection(value: 400, color: Colors.pink),
                    GraphBarSection(value: 700, color: Colors.blue),
                    GraphBarSection(value: -100, color: Colors.amber),
                    GraphBarSection(value: -900, color: Colors.purple),
                  ],
                ),
                GraphBar(
                  month: DateTime(2020, 4),
                  sections: [
                    GraphBarSection(value: 400, color: Colors.pink),
                    GraphBarSection(value: 0, color: Colors.blue),
                    GraphBarSection(value: -800, color: Colors.amber),
                    GraphBarSection(value: -400, color: Colors.purple),
                  ],
                ),
                GraphBar(
                  month: DateTime(2020, 5),
                  sections: [
                    GraphBarSection(value: 700, color: Colors.pink),
                    GraphBarSection(value: 900, color: Colors.blue),
                    GraphBarSection(value: -200, color: Colors.amber),
                    GraphBarSection(value: -100, color: Colors.purple),
                  ],
                ),
                GraphBar(
                  month: DateTime(2020, 6),
                  sections: [
                    GraphBarSection(value: 900, color: Colors.pink),
                    GraphBarSection(value: 900, color: Colors.blue),
                    GraphBarSection(value: -200, color: Colors.amber),
                    GraphBarSection(value: -100, color: Colors.purple),
                  ],
                ),
                GraphBar(
                  month: DateTime(2020, 7),
                  sections: [
                    GraphBarSection(value: 300, color: Colors.pink),
                    GraphBarSection(value: 800, color: Colors.blue),
                    GraphBarSection(value: -200, color: Colors.amber),
                    GraphBarSection(value: -1100, color: Colors.purple),
                  ],
                ),
                GraphBar(
                  month: DateTime(2020, 8),
                  sections: [
                    GraphBarSection(value: 250, color: Colors.pink),
                    GraphBarSection(value: 980, color: Colors.blue),
                    GraphBarSection(value: -210, color: Colors.amber),
                    GraphBarSection(value: -720, color: Colors.purple),
                  ],
                ),
                GraphBar(
                  month: DateTime(2020, 9),
                  sections: [
                    GraphBarSection(value: 300, color: Colors.pink),
                    GraphBarSection(value: 200, color: Colors.blue),
                    GraphBarSection(value: -200, color: Colors.amber),
                    GraphBarSection(value: -400, color: Colors.purple),
                  ],
                ),
                GraphBar(
                  month: DateTime(2020, 10),
                  sections: [
                    GraphBarSection(value: 200, color: Colors.pink),
                    GraphBarSection(value: 900, color: Colors.blue),
                    GraphBarSection(value: -200, color: Colors.amber),
                    GraphBarSection(value: -700, color: Colors.purple),
                  ],
                ),
              ],
            ),
            onBarTapped: (GraphBar bar) {
              print(bar.month);
            },
          ),
        ],
      ),
    );
  }
}

카테고리

의존성

의존성 목록 2 개

소스 저장소

이 패키지를 사용하는 프로젝트

아직 데이터가 없습니다.