Bezier Chart


A beautiful bezier line chart widget for flutter that is highly interactive and configurable.

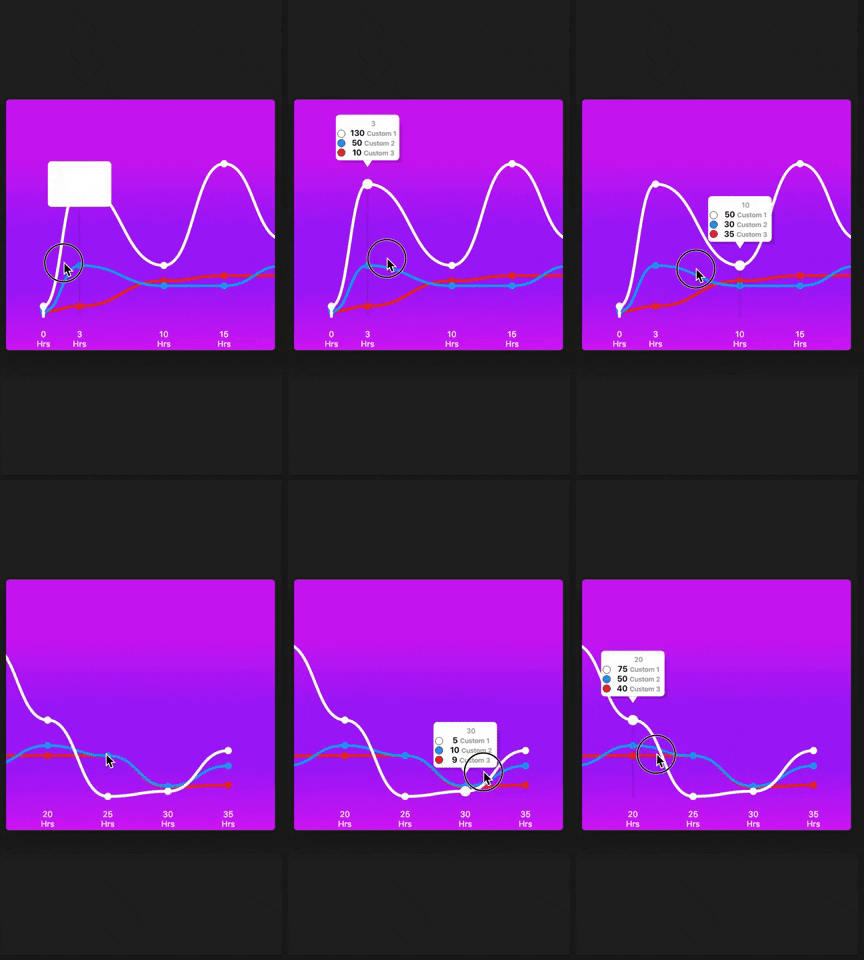
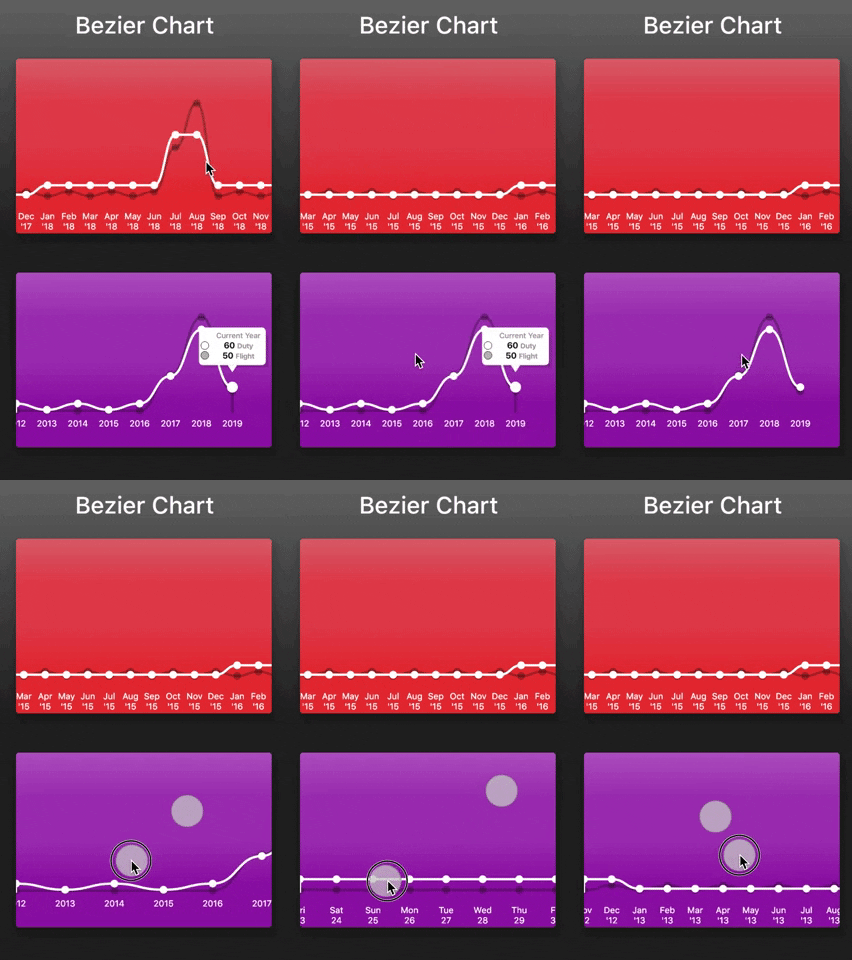
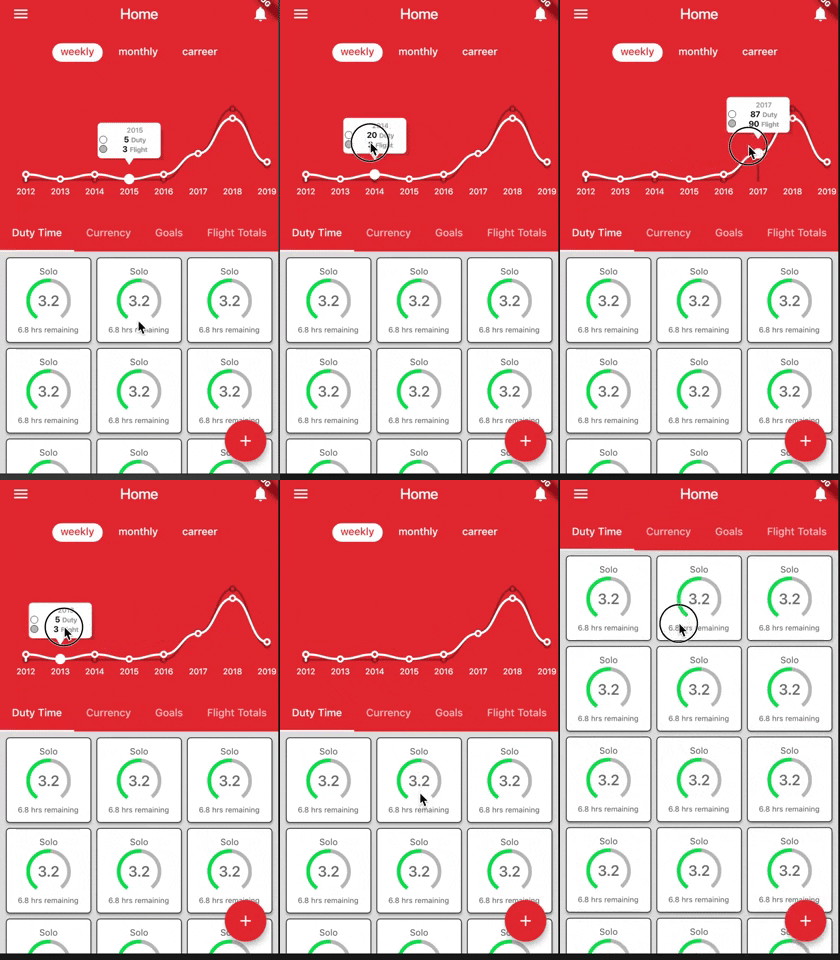
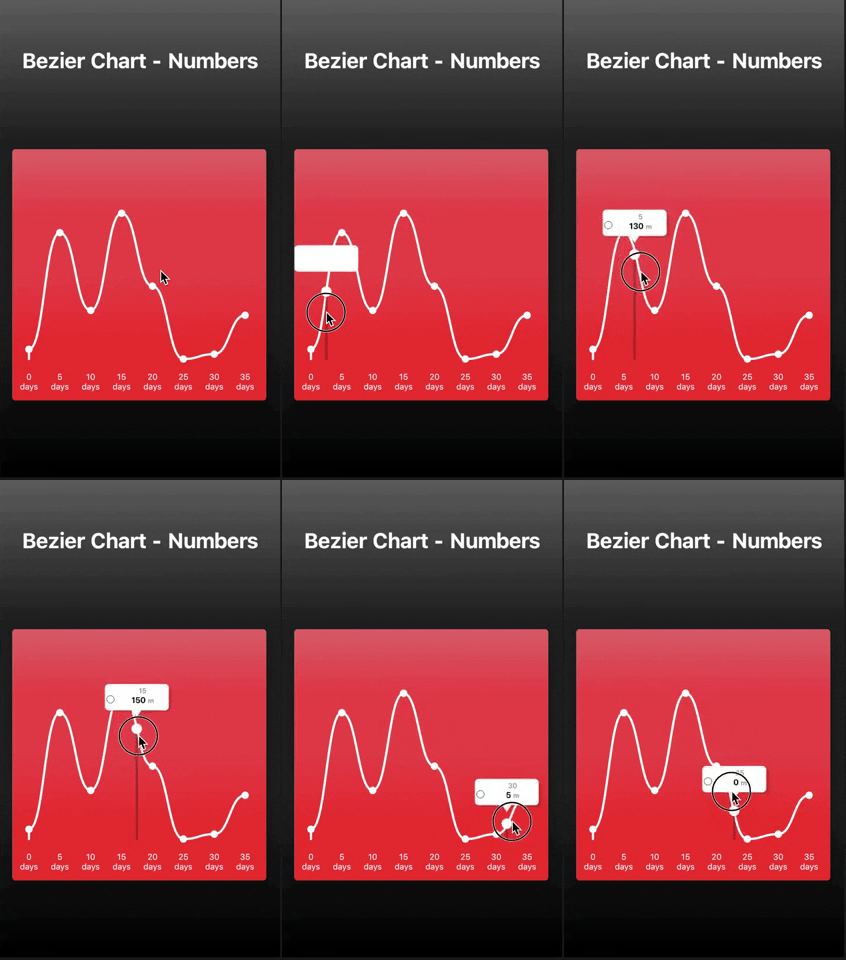
Features
- Multi bezier lines
- Allow numbers and datetimes
- Gestures support like touch, pinch/zoom, scrolling
- Highly customizable
Instructions
- Long press and drag to display the indicator
- Tap to dismiss the indicator
- When using chart Scale different from Custom, you can change between WEEKLY, MONTHLY, YEARLY using pinch/zoom when the indicator is not visible.
Getting started
You should ensure that you add the dependency in your flutter project.
dependencies:
  bezier_chart: "^2.0.0"
You should then run flutter packages upgrade or update your packages in IntelliJ.
Example Project
There is a example project in the example folder. Check it out. Otherwise, keep reading to get up and running.
Usage
Custom Numbers
  Widget sample1(BuildContext context) {
  return Center(
    child: Container(
      color: Colors.red,
      height: MediaQuery.of(context).size.height / 2,
      width: MediaQuery.of(context).size.width * 0.9,
      child: BezierChart(
        bezierChartScale: BezierChartScale.CUSTOM,
        xAxisCustomValues: const [0, 5, 10, 15, 20, 25, 30, 35],
        series: const [
          BezierLine(
            data: const [
              DataPoint<double>(value: 10, xAxis: 0),
              DataPoint<double>(value: 130, xAxis: 5),
              DataPoint<double>(value: 50, xAxis: 10),
              DataPoint<double>(value: 150, xAxis: 15),
              DataPoint<double>(value: 75, xAxis: 20),
              DataPoint<double>(value: 0, xAxis: 25),
              DataPoint<double>(value: 5, xAxis: 30),
              DataPoint<double>(value: 45, xAxis: 35),
            ],
          ),
        ],
        config: BezierChartConfig(
          verticalIndicatorStrokeWidth: 3.0,
          verticalIndicatorColor: Colors.black26,
          showVerticalIndicator: true,
          backgroundColor: Colors.red,
          snap: false,
        ),
      ),
    ),
  );
}
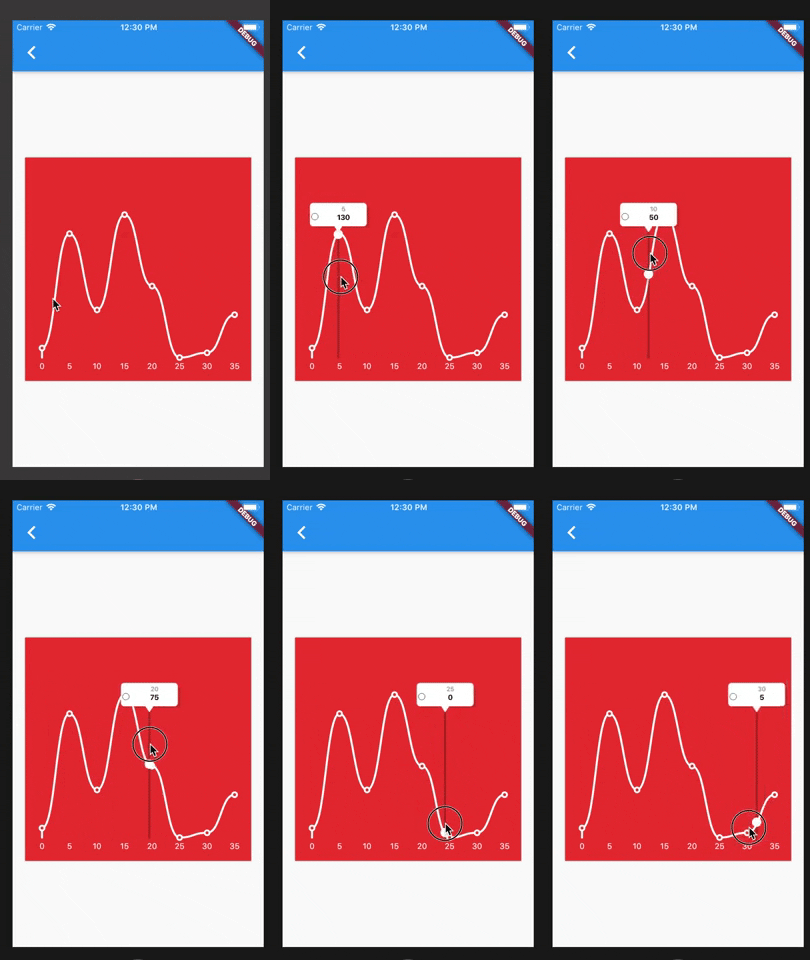
Custom Numbers multiline
Widget sample2(BuildContext context) {
  return Center(
    child: Container(
      color: Colors.red,
      height: MediaQuery.of(context).size.height / 2,
      width: MediaQuery.of(context).size.width,
      child: BezierChart(
        bezierChartScale: BezierChartScale.CUSTOM,
        xAxisCustomValues: const [0, 3, 10, 15, 20, 25, 30, 35],
        series: const [
          BezierLine(
            label: "Custom 1",
            data: const [
              DataPoint<double>(value: 10, xAxis: 0),
              DataPoint<double>(value: 130, xAxis: 5),
              DataPoint<double>(value: 50, xAxis: 10),
              DataPoint<double>(value: 150, xAxis: 15),
              DataPoint<double>(value: 75, xAxis: 20),
              DataPoint<double>(value: 0, xAxis: 25),
              DataPoint<double>(value: 5, xAxis: 30),
              DataPoint<double>(value: 45, xAxis: 35),
            ],
          ),
          BezierLine(
            lineColor: Colors.blue,
            lineStrokeWidth: 2.0,
            label: "Custom 2",
            data: const [
              DataPoint<double>(value: 5, xAxis: 0),
              DataPoint<double>(value: 50, xAxis: 5),
              DataPoint<double>(value: 30, xAxis: 10),
              DataPoint<double>(value: 30, xAxis: 15),
              DataPoint<double>(value: 50, xAxis: 20),
              DataPoint<double>(value: 40, xAxis: 25),
              DataPoint<double>(value: 10, xAxis: 30),
              DataPoint<double>(value: 30, xAxis: 35),
            ],
          ),
          BezierLine(
            lineColor: Colors.black,
            lineStrokeWidth: 2.0,
            label: "Custom 3",
            data: const [
              DataPoint<double>(value: 5, xAxis: 0),
              DataPoint<double>(value: 10, xAxis: 5),
              DataPoint<double>(value: 35, xAxis: 10),
              DataPoint<double>(value: 40, xAxis: 15),
              DataPoint<double>(value: 40, xAxis: 20),
              DataPoint<double>(value: 40, xAxis: 25),
              DataPoint<double>(value: 9, xAxis: 30),
              DataPoint<double>(value: 11, xAxis: 35),
            ],
          ),
        ],
        config: BezierChartConfig(
          verticalIndicatorStrokeWidth: 2.0,
          verticalIndicatorColor: Colors.black12,
          showVerticalIndicator: true,
          contentWidth: MediaQuery.of(context).size.width * 2,
          backgroundColor: Colors.red,
        ),
      ),
    ),
  );
}
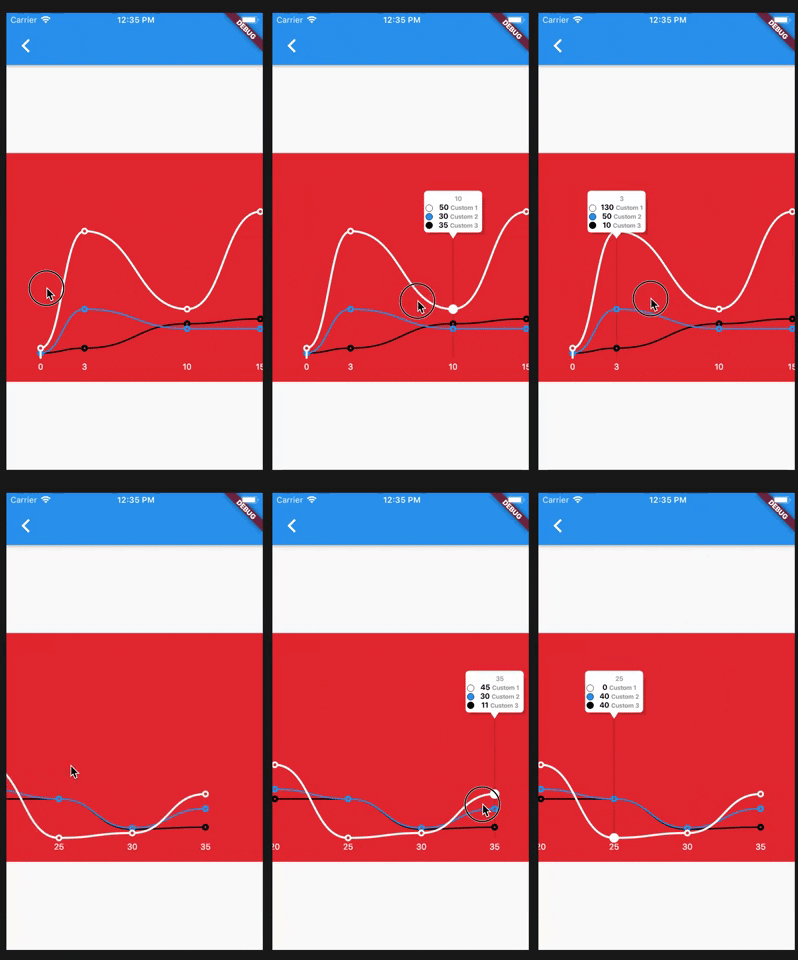
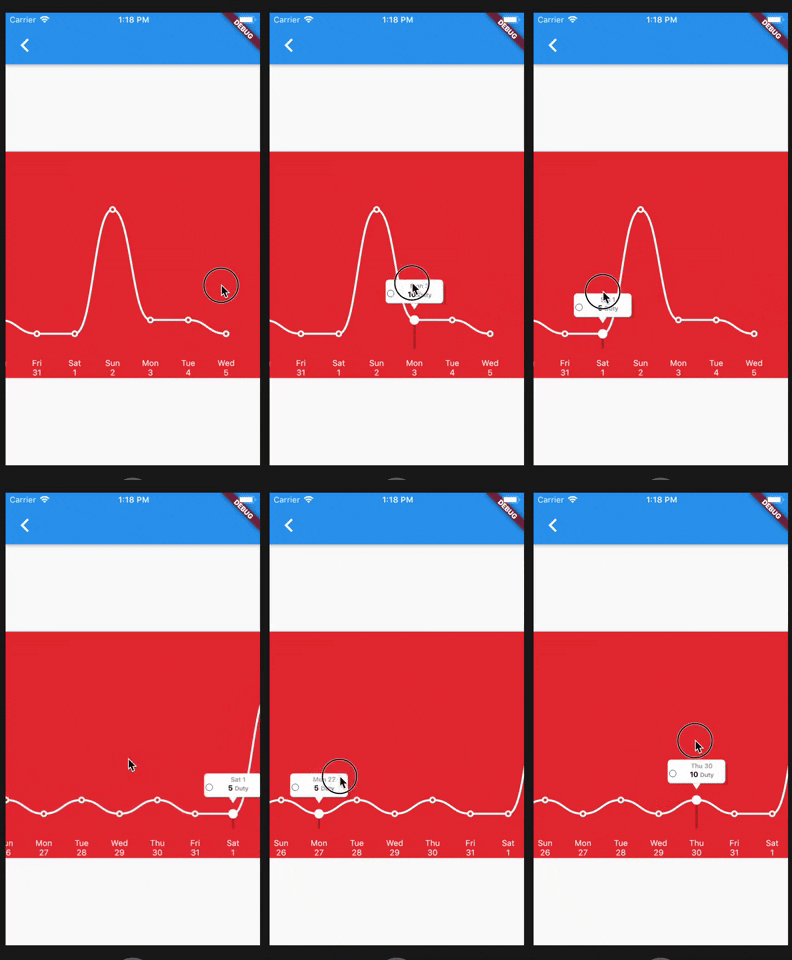
Weekly Chart
Widget sample3(BuildContext context) {
  final fromDate = DateTime(2019, 05, 22);
  final toDate = DateTime.now();

  final date1 = DateTime.now().subtract(Duration(days: 2));
  final date2 = DateTime.now().subtract(Duration(days: 3));

  return Center(
    child: Container(
      color: Colors.red,
      height: MediaQuery.of(context).size.height / 2,
      width: MediaQuery.of(context).size.width,
      child: BezierChart(
        fromDate: fromDate,
        bezierChartScale: BezierChartScale.WEEKLY,
        toDate: toDate,
        selectedDate: toDate,
        series: [
          BezierLine(
            label: "Duty",
            onMissingValue: (dateTime) {
              if (dateTime.day.isEven) {
                return 10.0;
              }
              return 5.0;
            },
            data: [
              DataPoint<DateTime>(value: 10, xAxis: date1),
              DataPoint<DateTime>(value: 50, xAxis: date2),
            ],
          ),
        ],
        config: BezierChartConfig(
          verticalIndicatorStrokeWidth: 3.0,
          verticalIndicatorColor: Colors.black26,
          showVerticalIndicator: true,
          verticalIndicatorFixedPosition: false,
          backgroundColor: Colors.red,
          footerHeight: 30.0,
        ),
      ),
    ),
  );
}
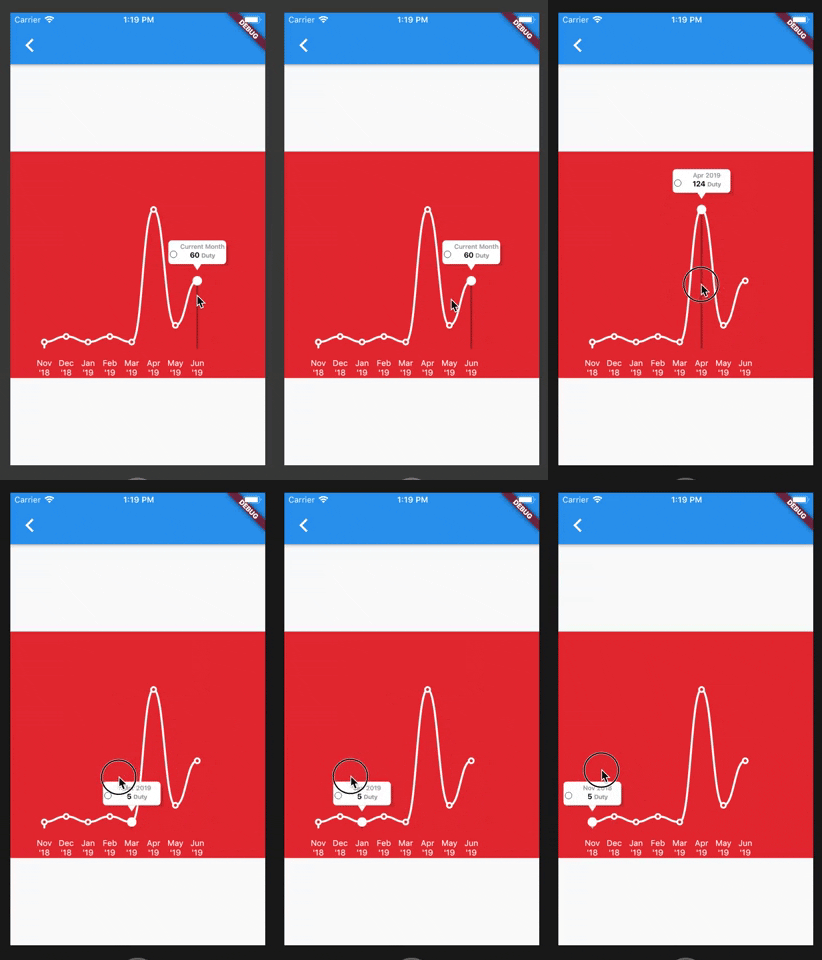
Monthly Chart
Widget sample4(BuildContext context) {
  final fromDate = DateTime(2018, 11, 22);
  final toDate = DateTime.now();

  final date1 = DateTime.now().subtract(Duration(days: 2));
  final date2 = DateTime.now().subtract(Duration(days: 3));

  final date3 = DateTime.now().subtract(Duration(days: 35));
  final date4 = DateTime.now().subtract(Duration(days: 36));

  final date5 = DateTime.now().subtract(Duration(days: 65));
  final date6 = DateTime.now().subtract(Duration(days: 64));

  return Center(
    child: Container(
      color: Colors.red,
      height: MediaQuery.of(context).size.height / 2,
      width: MediaQuery.of(context).size.width,
      child: BezierChart(
        bezierChartScale: BezierChartScale.MONTHLY,
        fromDate: fromDate,
        toDate: toDate,
        selectedDate: toDate,
        series: [
          BezierLine(
            label: "Duty",
            onMissingValue: (dateTime) {
              if (dateTime.month.isEven) {
                return 10.0;
              }
              return 5.0;
            },
            data: [
              DataPoint<DateTime>(value: 10, xAxis: date1),
              DataPoint<DateTime>(value: 50, xAxis: date2),
              DataPoint<DateTime>(value: 20, xAxis: date3),
              DataPoint<DateTime>(value: 80, xAxis: date4),
              DataPoint<DateTime>(value: 14, xAxis: date5),
              DataPoint<DateTime>(value: 30, xAxis: date6),
            ],
          ),
        ],
        config: BezierChartConfig(
          verticalIndicatorStrokeWidth: 3.0,
          verticalIndicatorColor: Colors.black26,
          showVerticalIndicator: true,
          verticalIndicatorFixedPosition: false,
          backgroundColor: Colors.red,
          footerHeight: 30.0,
        ),
      ),
    ),
  );
}
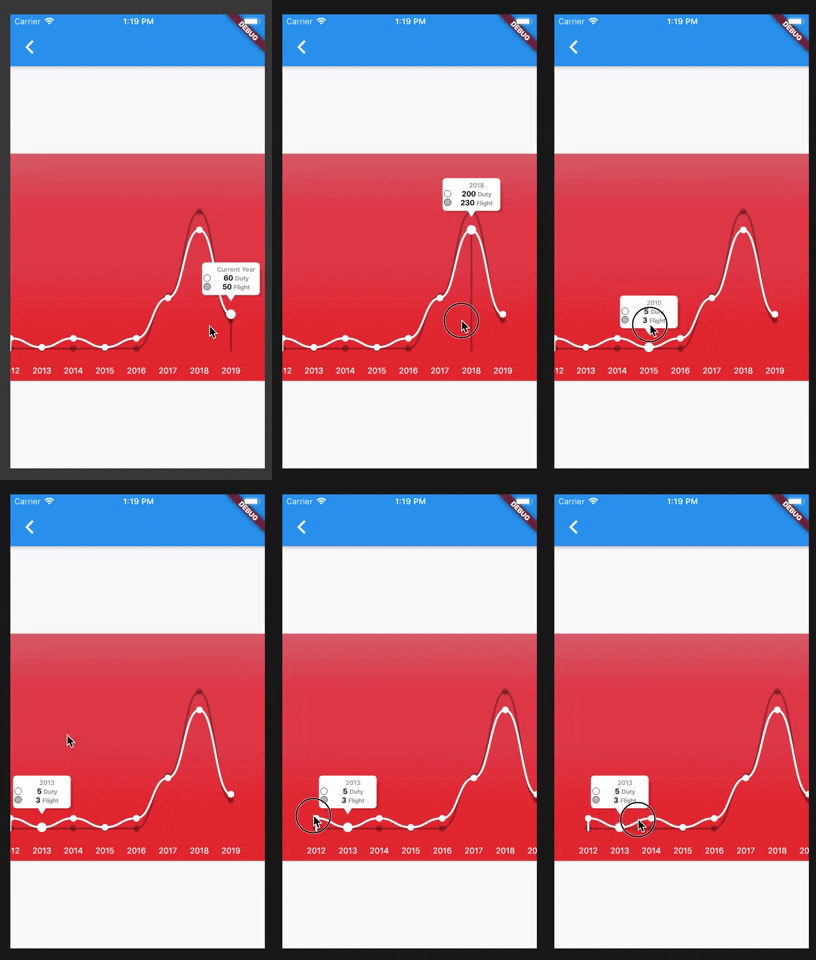
Yearly Chart
Widget sample5(BuildContext context) {
  final fromDate = DateTime(2012, 11, 22);
  final toDate = DateTime.now();

  final date1 = DateTime.now().subtract(Duration(days: 2));
  final date2 = DateTime.now().subtract(Duration(days: 3));

  final date3 = DateTime.now().subtract(Duration(days: 300));
  final date4 = DateTime.now().subtract(Duration(days: 320));

  final date5 = DateTime.now().subtract(Duration(days: 650));
  final date6 = DateTime.now().subtract(Duration(days: 652));

  return Center(
    child: Container(
      color: Colors.red,
      height: MediaQuery.of(context).size.height / 2,
      width: MediaQuery.of(context).size.width,
      child: BezierChart(
        bezierChartScale: BezierChartScale.YEARLY,
        fromDate: fromDate,
        toDate: toDate,
        selectedDate: toDate,
        series: [
          BezierLine(
            label: "Duty",
            onMissingValue: (dateTime) {
              if (dateTime.year.isEven) {
                return 20.0;
              }
              return 5.0;
            },
            data: [
              DataPoint<DateTime>(value: 10, xAxis: date1),
              DataPoint<DateTime>(value: 50, xAxis: date2),
              DataPoint<DateTime>(value: 100, xAxis: date3),
              DataPoint<DateTime>(value: 100, xAxis: date4),
              DataPoint<DateTime>(value: 40, xAxis: date5),
              DataPoint<DateTime>(value: 47, xAxis: date6),
            ],
          ),
          BezierLine(
            label: "Flight",
            lineColor: Colors.black26,
            onMissingValue: (dateTime) {
              if (dateTime.month.isEven) {
                return 10.0;
              }
              return 3.0;
            },
            data: [
              DataPoint<DateTime>(value: 20, xAxis: date1),
              DataPoint<DateTime>(value: 30, xAxis: date2),
              DataPoint<DateTime>(value: 150, xAxis: date3),
              DataPoint<DateTime>(value: 80, xAxis: date4),
              DataPoint<DateTime>(value: 45, xAxis: date5),
              DataPoint<DateTime>(value: 45, xAxis: date6),
            ],
          ),
        ],
        config: BezierChartConfig(
          verticalIndicatorStrokeWidth: 3.0,
          verticalIndicatorColor: Colors.black26,
          showVerticalIndicator: true,
          verticalIndicatorFixedPosition: false,
          backgroundGradient: LinearGradient(
            colors: [
              Colors.red[300],
              Colors.red[400],
              Colors.red[400],
              Colors.red[500],
              Colors.red,
            ],
            begin: Alignment.topCenter,
            end: Alignment.bottomCenter,
          ),
          footerHeight: 30.0,
        ),
      ),
    ),
  );
}
API
In this table, you can find all attributes provided by BezierChartConfig:
| Attribute |
Default value |
Description |
| showVerticalIndicator |
true |
true if you want to display the vertical indicator |
| verticalIndicatorColor |
Colors.black |
|
| verticalIndicatorStrokeWidth |
2.0 |
width of the line used for the vertical indicator |
| verticalIndicatorFixedPosition |
false |
true if you want to keep the info indicator in a fixed position |
| verticalLineFullHeight |
|
true if you want to display the vertical line in full height |
| bubbleIndicatorColor |
Colors.white |
Color of the bubble indicator, it's white by default |
| bubbleIndicatorTitleStyle |
const TextStyle() |
TextStyle for the title displayed inside the bubble indicator |
| bubbleIndicatorValueStyle |
const TextStyle() |
TextStyle for the value displayed inside the bubble indicator |
| bubbleIndicatorValueFormat |
null |
NumberFormat for the value displayed inside the bubble indicator |
| bubbleIndicatorLabelStyle |
const TextStyle() |
TextStyle for the label displayed inside the bubble indicator |
| backgroundColor |
Colors.transparent |
Color of the background of the chart |
| backgroundGradient |
|
Gradient of the background of the chart |
| displayYAxis |
false |
true if you want to display the value of the Y axis, [false] by default |
| stepsYAxis |
|
If [displayYAxis] is true, then you can set a positive value to display the steps of Y axis values.
e.g 1: stepsYAxis : 5 , if your maxValue is 100, then the Y values should be: [0,5,10,15 .... 100]
e.g 2: stepsYAxis : 10 , if your maxValue is 100, then the Y values should be: [10,20,30,40 .... 100] |
| startYAxisFromNonZeroValue |
true |
true if you want to start the values of Y axis from the minimum value of your Y values |
| yAxisTextStyle |
|
TextStyle of the text of the Y Axis values |
| xAxisTextStyle |
|
TextStyle of the text of the X Axis values |
| footerHeight |
35.0 |
Height of the footer |
| showDataPoints |
true |
true if you want to display the data points |
| snap |
true |
true if you want to snap between each data point |
| pinchZoom |
true |
true if you want to enable pinch Zoom for bezierChartScale of date types
Pinch and zoom is used to switch beetwen charts of date types |
| contentWidth |
|
If the contentWidth is upper than the current width then the content will be scrollable (only valid for bezierChartScale = CUSTOM) |
| displayLinesXAxis |
false |
true if you want to display a vertical line on each X data point, it only works when there is one BezierLine |
| xLinesColor |
Colors.grey |
Color for the vertical line in each X point, only works when displayLinesXAxis is true |
| displayDataPointWhenNoValue |
true |
true if you want do display the dot when there is no value specified (The values inside onMissingValue) |
| physics |
const AlwaysScrollableScrollPhysics() |
The physics for horizontal ScrollView |
| updatePositionOnTap |
false |
true if you want do update bubble info on tap action instead of long press. This option will disable tap to hide bubble action |
Aeyrium Inc
You can follow me on twitter @diegoveloper