パッケージ、リポジトリ、アプリカテゴリを検索

k_chart_plus_deeping のカバー
パッケージ詳細v1.0.2-5.2.2.3

k_chart_plus_deeping

交換アプリケーションでローソク足チャートやディープチャートを描画するためのチャートライブラリ。経験豊富なソフトウェア開発者。新しい機会にオープン。Telegram @sandaohaizi にて連絡ください。

AndroidiOSWebmacOSWindowsLinux
30日間ダウンロード
103
いいね数
120
Pub ポイント
140

パッケージをインストール

flutter pub add k_chart_plus_deeping

パッケージ概要

公開情報に基づく選定ガイドです。参考としてご利用ください。

k_chart_plus_deeping は、取引所アプリケーションに適したローソク足チャートやディープチャートを含む高度な金融チャートの構築を目的としたFlutterパッケージです。リアルタイムデータ更新に対応し、スムーズでカスタマイズ可能なビジュアライゼーションを提供します。経験豊富な開発者向けに設計されており、複数プラットフォームでの取引や金融関連アプリへのシームレスな統合が可能です。このライブラリはオープンソースであり、Telegramを通じた協力を歓迎する開発者がメンテナンスしています。

用途

  • 取引プラットフォームインターフェース
  • 暗号通貨交換ダッシュボード
  • リアルタイム市場データの可視化
  • 財務分析ツール
  • ポートフォリオ追跡アプリケーション

主な機能

  • キャンドルスティックチャートのレンダリング
  • デプスチャートの可視化
  • クロスプラットフォーム互換性
  • 高パフォーマンスレンダリング
  • カスタマイズ可能なテーマとスタイル
  • リアルタイムデータストリーミングのサポート

適している対象

  • 経験豊富なFlutter開発者
  • 金融および暗号資産アプリケーションの構築者
  • 交換プラットフォームチーム
  • データ可視化の専門家
  • インタラクティブなチャートを必要とするアプリ

注意事項

  • 金融チャートの概念について理解が必要です
  • 複雑なトレーディングUIに最適
  • 追加の状態管理が必要になる場合があります
  • GitHubリポジトリ以外のドキュメントは限られている
  • 直接サポートにはTelegram連絡先が必要です

元の README

関連するソースリポジトリの README 原文のスナップショットです。最新の内容はリポジトリをご覧ください。

K Chart Plus Package Deeping

简体中文 | English

Feature

2024-08-01 Update: Display double volume
2024-07-18 Update: Gesture zoom functionality | Scientific notation support
2024-07-17 Update: EMA indicator added
2024-07-16 Update: Skeleton screen functionality

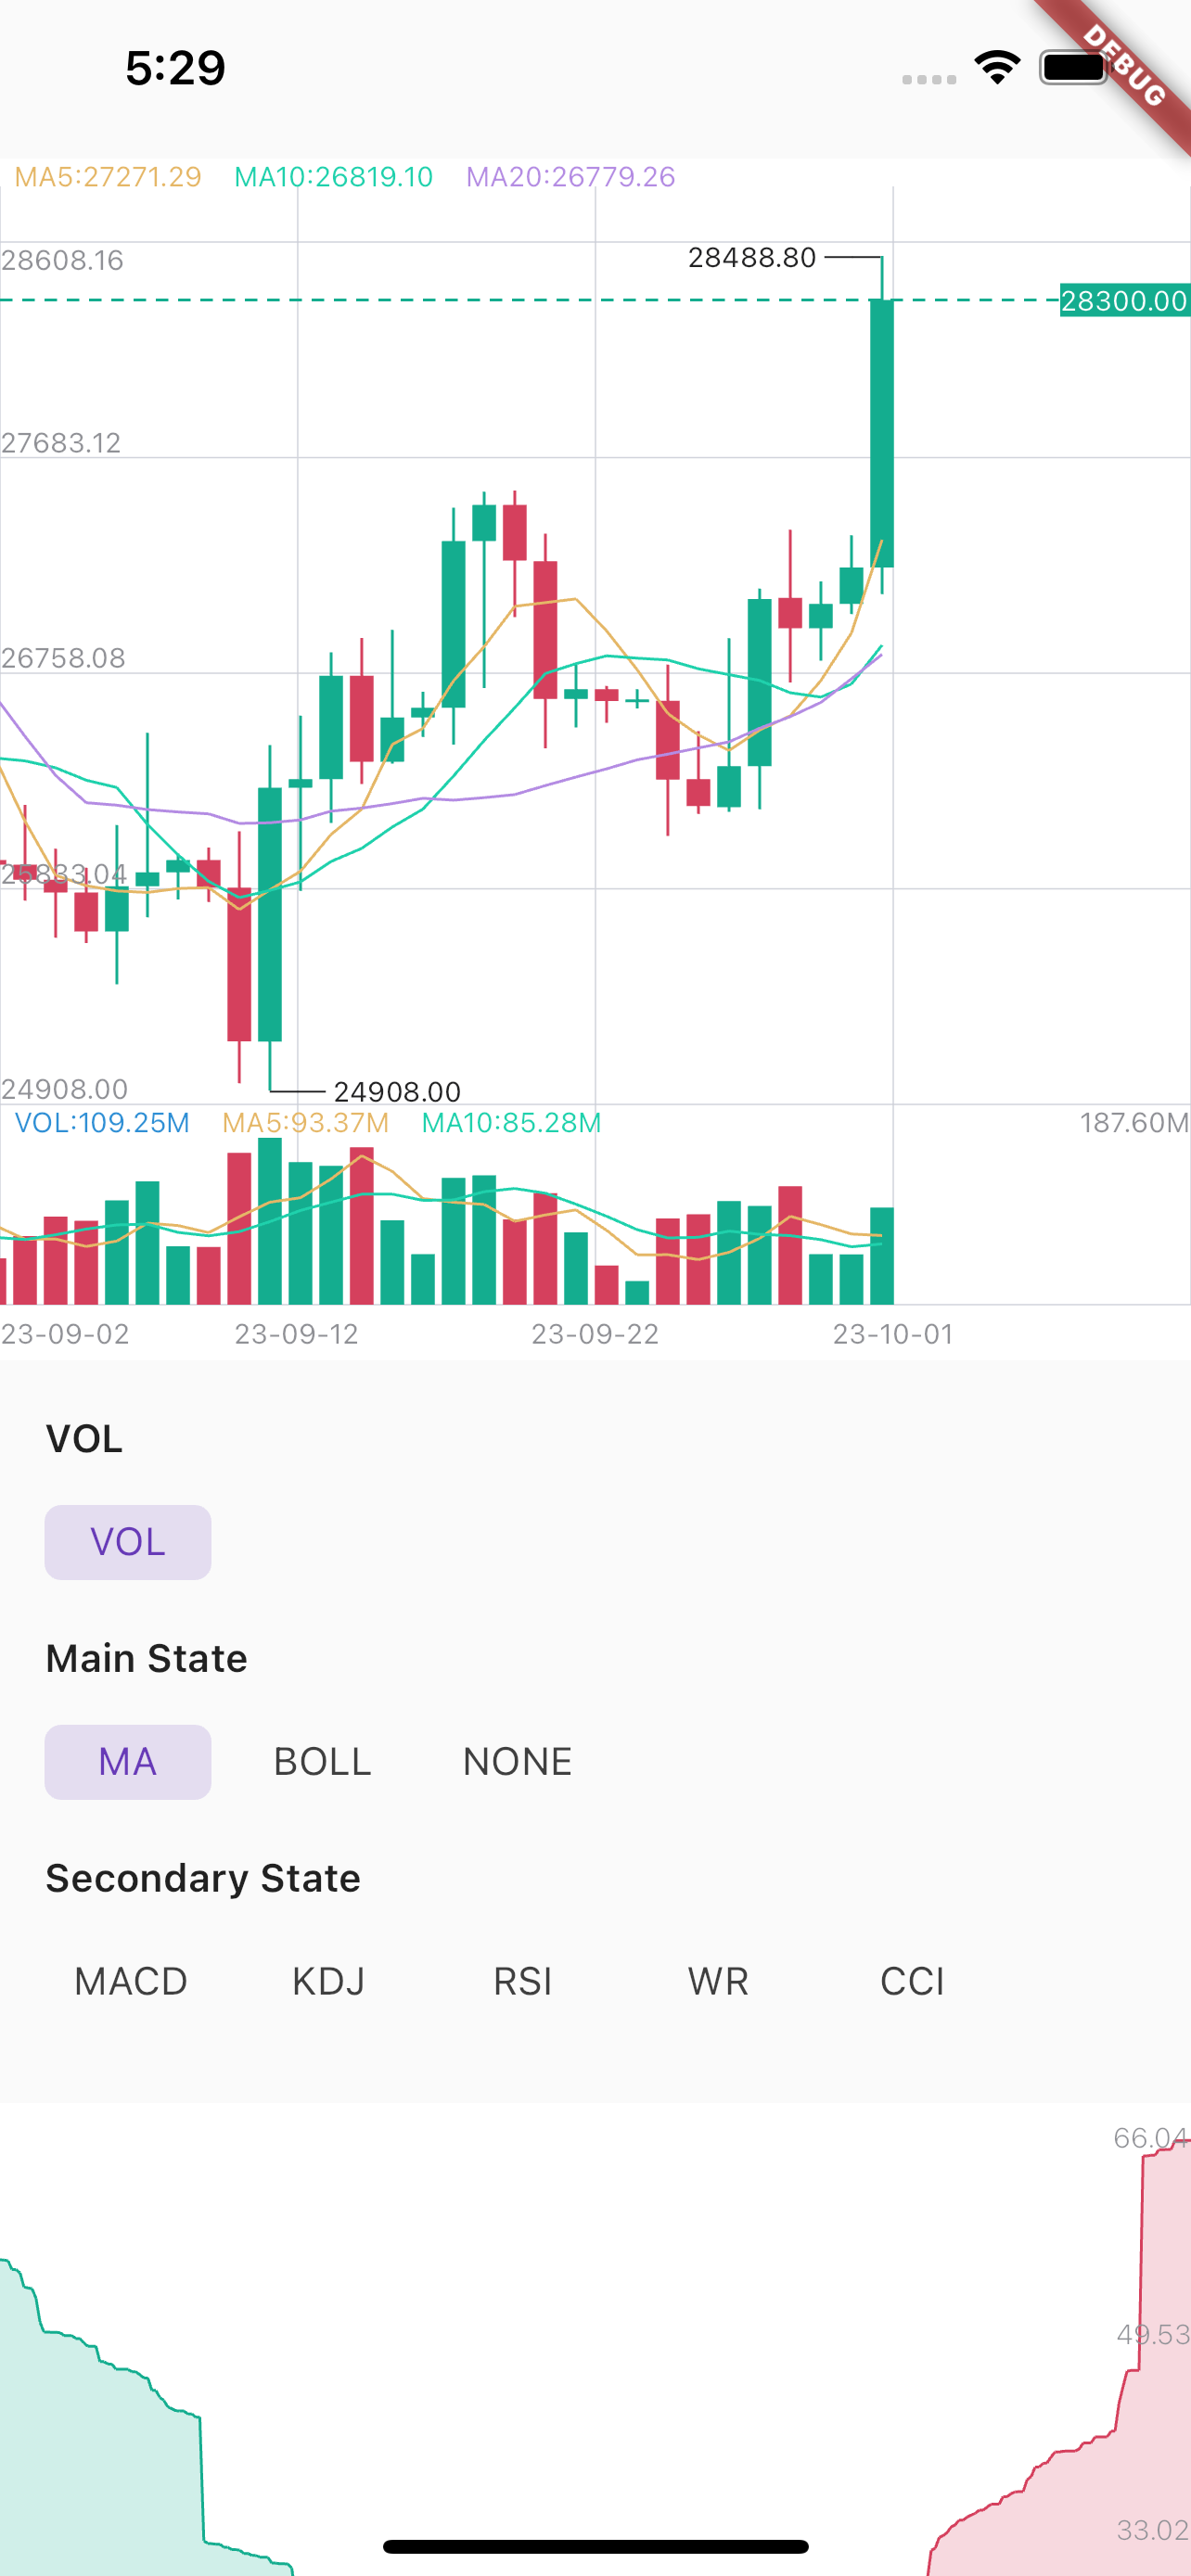
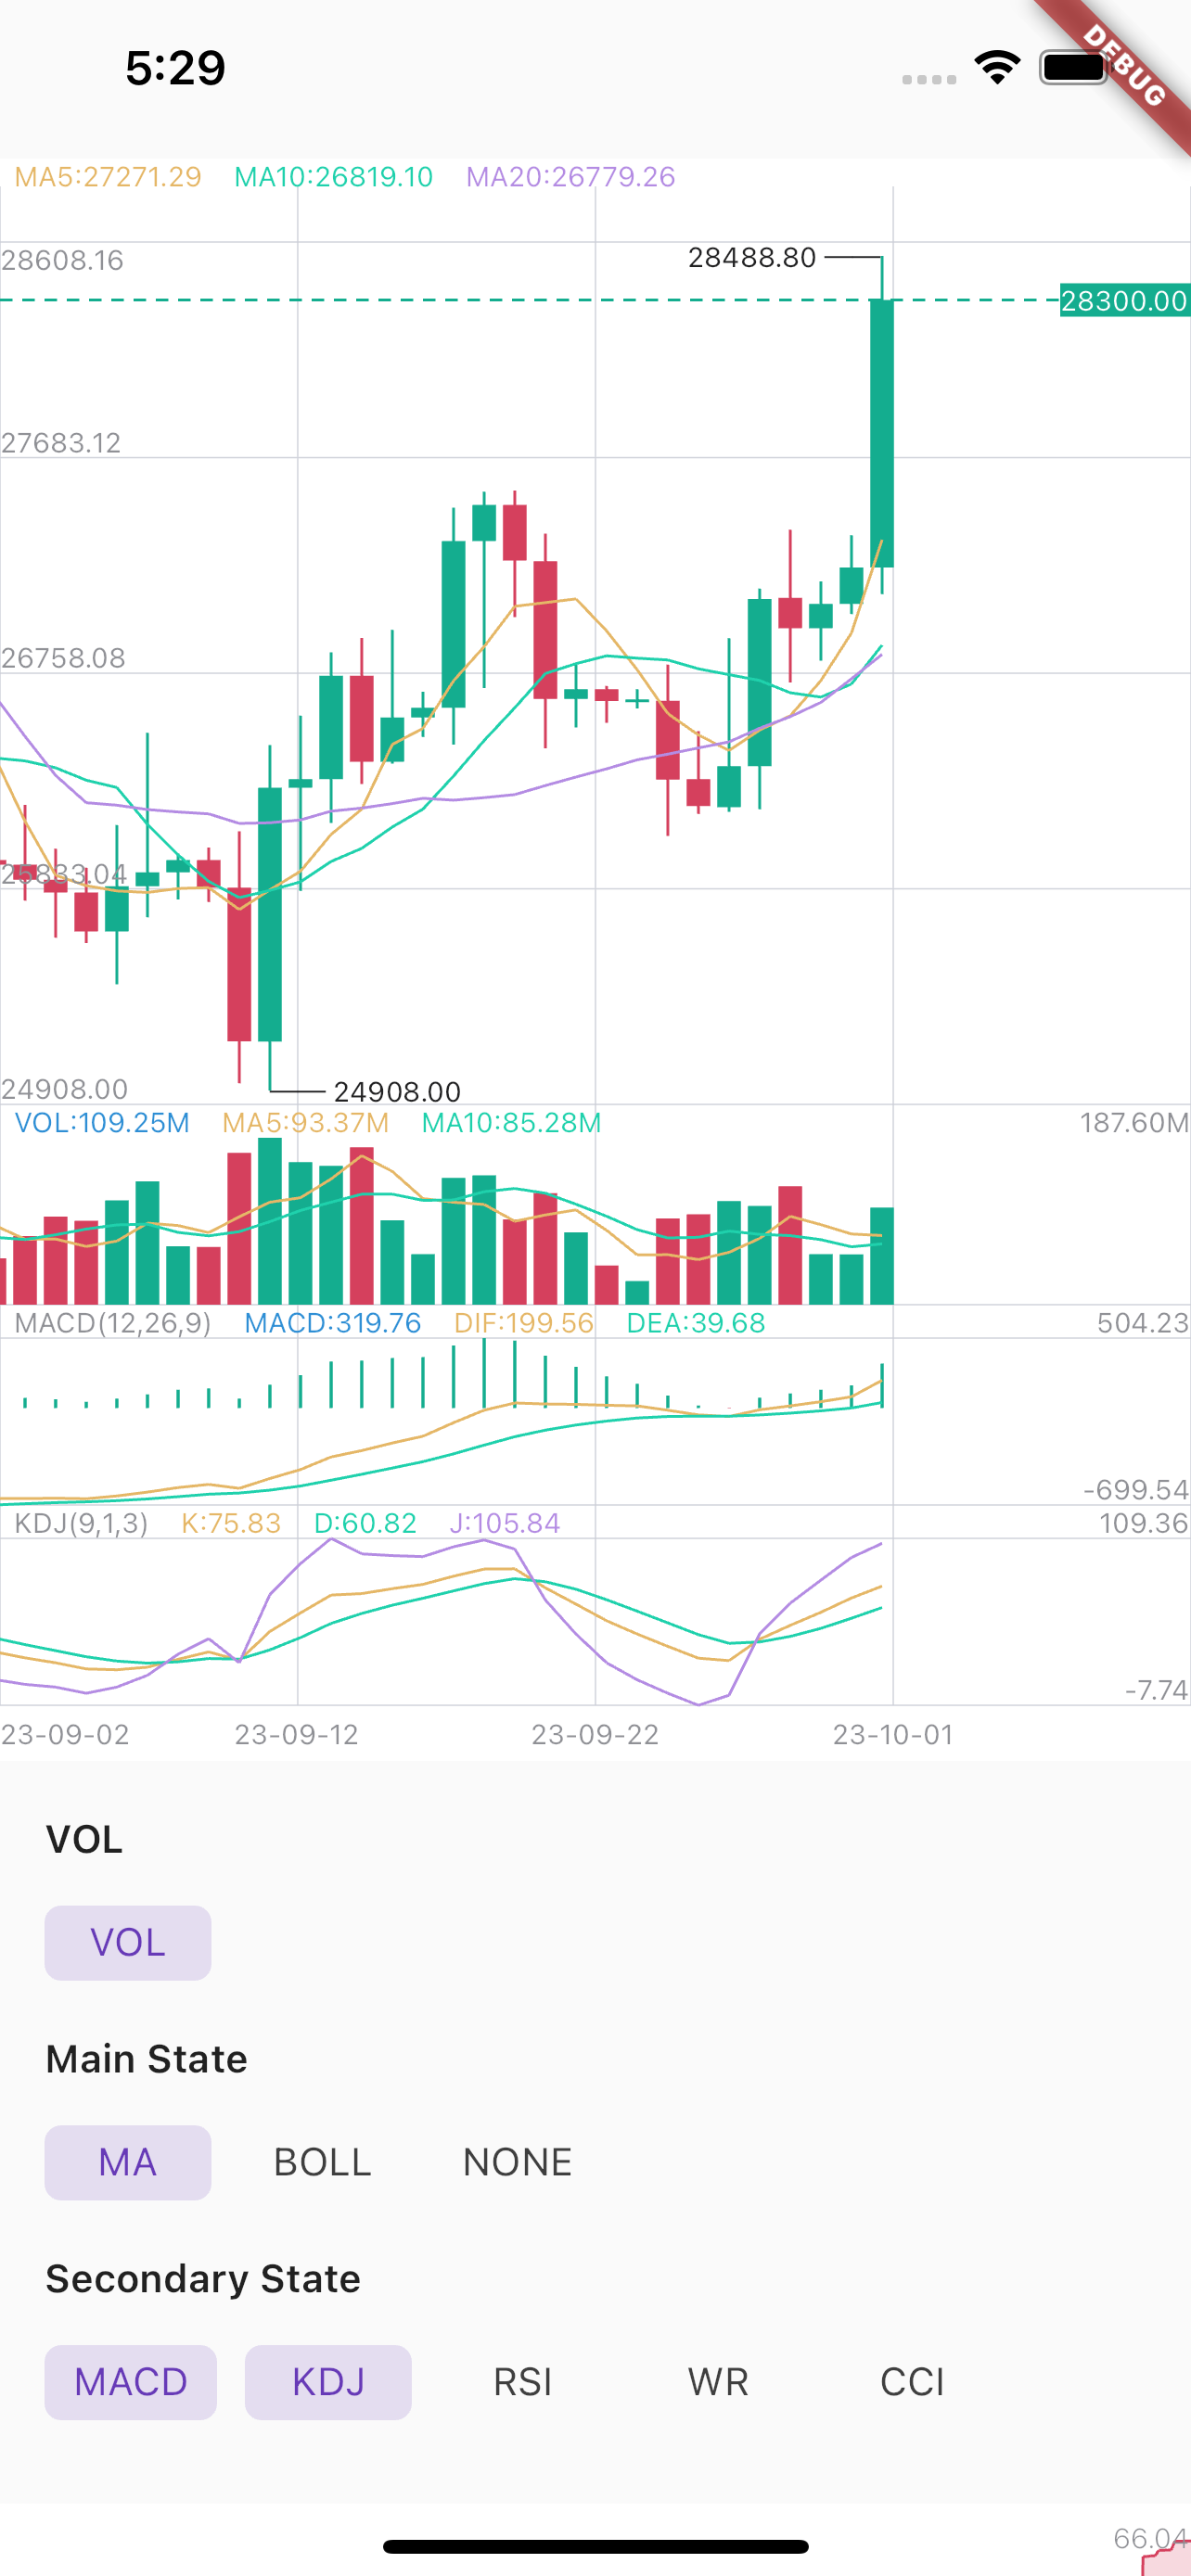
Maybe this is the best k chart in Flutter.Support drag,scale,long press,fling.And easy to use.

Example1 Example2

Installation

First, add k_chart_plus as a dependency in your pubspec.yaml file.

k_chart_plus_deeping: ^1.0.0-tomo+2

If you don't want to support selecting multiple secondary states, you need to use:

flutter_k_chat_plus:
   git:
     url: https://github.com/sawwas/flutter_k_chat_plus
     ref: single #branch name

Usage

When you change the data, you must call this:

DataUtil.calculate(datas); //This function has some optional parameters: n is BOLL N-day closing price. k is BOLL param.
Use K line chart
KChartWidget(
    chartStyle, // Required for styling purposes
    chartColors,// Required for styling purposes
    datas,// Required,Data must be an ordered list,(history=>now)
    mBaseHeight: 360, //height of chart (not contain Vol and Secondary) 
    isLine: isLine,// Decide whether it is k-line or time-sharing
    mainState: _mainState,// Decide what the main view shows
    secondaryStateLi: _secondaryStateLi,// Decide what the sub view shows
    fixedLength: 2,// Displayed decimal precision
    timeFormat: TimeFormat.YEAR_MONTH_DAY,
    onLoadMore: (bool a) {},// Called when the data scrolls to the end. When a is true, it means the user is pulled to the end of the right side of the data. When a
    // is false, it means the user is pulled to the end of the left side of the data.
    maDayList: [5,10,20],// Display of MA,This parameter must be equal to DataUtil.calculate‘s maDayList
    volHidden: false,// hide volume
    showNowPrice: true,// show now price
    isOnDrag: (isDrag){},// true is on Drag.Don't load data while Draging.
    isTrendLine: false, // You can use Trendline by long-pressing and moving your finger after setting true to isTrendLine property. 
    xFrontPadding: 100 // padding in front
),
Use Depth chart
DepthChart(_bids, _asks, chartColors) //Note: Datas must be an ordered list,
Dark | Light Theme

ChartColor helped to set the color for the chart. You need to flexibly change according to your theme configuration to ensure UI.

If you need to apply multi theme, you need to change at least the colors related to the text, border, grid and background color

late ThemeData themeData = Theme.of(context);
late ChartColors chartColors = ChartColors(
  bgColor: themeData.colorScheme.background,
  defaultTextColor: themeData.textTheme.labelMedium?.color ?? Colors.grey,
  gridColor: themeData.dividerColor,
  hCrossColor: themeData.textTheme.bodyMedium?.color ?? Colors.white,
  vCrossColor: themeData.disabledColor.withOpacity(.1),
  crossTextColor: themeData.textTheme.bodyMedium?.color ?? Colors.white,
  selectBorderColor: themeData.textTheme.bodyMedium?.color ?? Colors.black54,
  selectFillColor: themeData.colorScheme.background,
  infoWindowTitleColor: themeData.textTheme.labelMedium?.color ?? Colors.grey,
  infoWindowNormalColor: themeData.textTheme.bodyMedium?.color ?? Colors.white,
);

Apply in k line chart:


KChartWidget(
    data,
    ChartStyle(),
    ChartColors().init(), ///custom chart color
    chartTranslations: ChartTranslations(
        date: 'Date'
        open: 'Open',
        high: 'High',
        low: 'Low',
        close: 'Close'
        changeAmount: 'Change',
        change: 'Change%',
        amount: 'Amount',
        vol: 'Volume',
    ),
    mBaseHeight: 360,
    isTrendLine: false,
    mainState: mainState,
    secondaryStateLi: secondaryStates,
    fixedLength: 2,
    timeFormat: TimeFormat.YEAR_MONTH_DAY,
);
Thanks

TrangLeQuynh/k_chart_plus

gwhcn/flutter_k_chart

OpenFlutter/k_chart

カテゴリー

依存関係

依存関係一覧 3 件

ソースリポジトリ

このパッケージを使用しているプロジェクト

データはまだありません。