パッケージ、リポジトリ、アプリカテゴリを検索

line_chart のカバー
パッケージ詳細v1.1.11

line_chart

カスタム折れ線グラフを作成するためのシンプルなFlutterパッケージ

AndroidiOSWebmacOSWindowsLinux
30日間ダウンロード
73
いいね数
29
Pub ポイント
140

パッケージをインストール

flutter pub add line_chart

パッケージ概要

公開情報に基づく選定ガイドです。参考としてご利用ください。

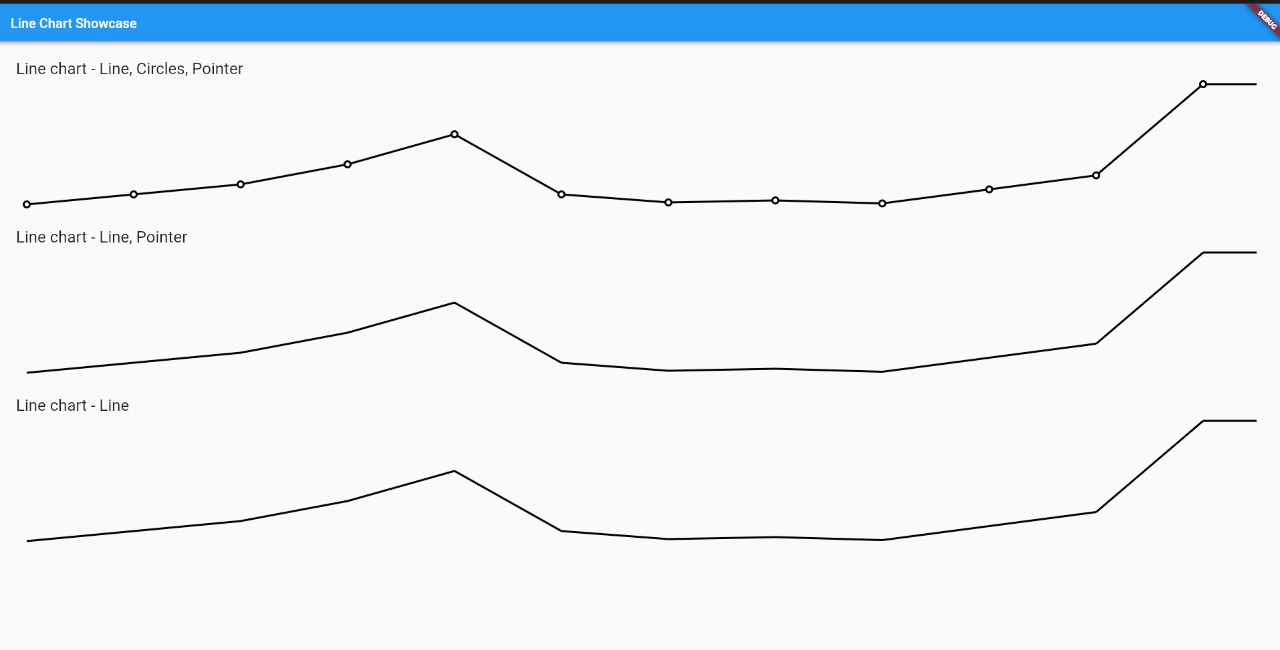
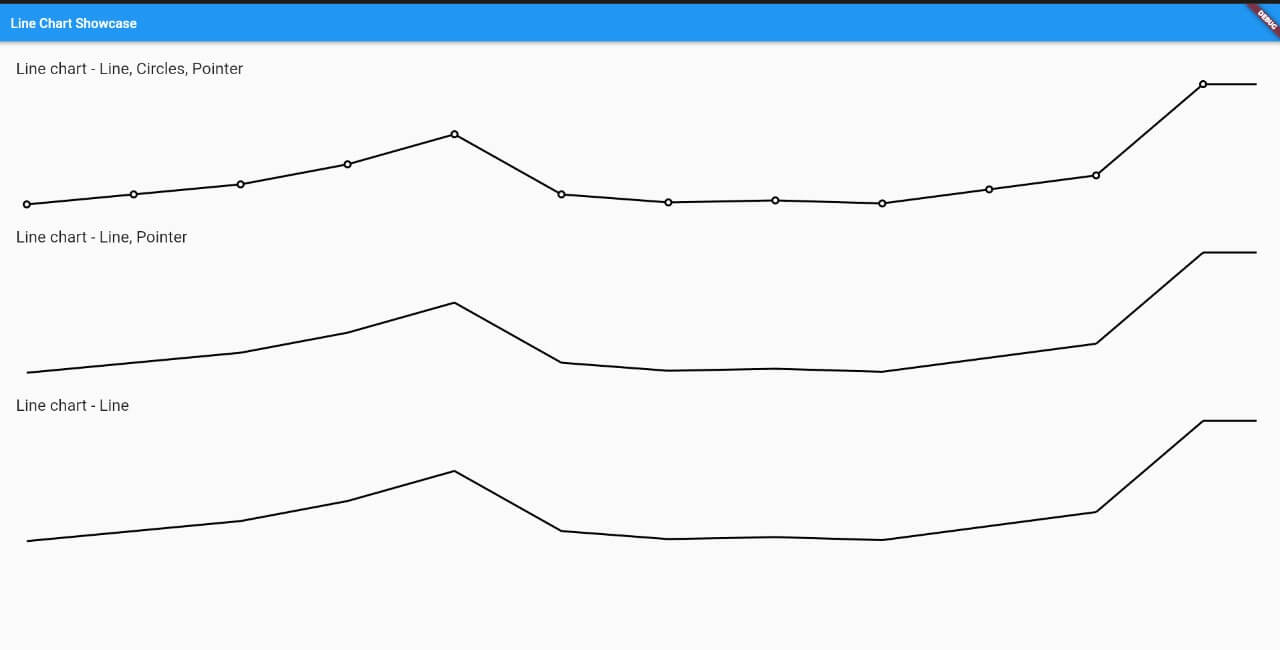
カスタマイズ可能な折れ線グラフを作成するためのシンプルなFlutterパッケージです。Android、iOS、Web、macOS、Windows、Linuxなど複数のプラットフォームで、滑らかでインタラクティブな線を使用してデータの傾向を可視化できます。使いやすさと柔軟性に重点を置き、色、ラベル、グリッドライン、チャートの挙動をカスタマイズ可能です。リアルタイムまたは過去のデータを洗練された直感的な形式で表示する必要があるアプリに最適です。

用途

  • 時系列データの表示
  • パフォーマンスメトリクスの可視化
  • 時間の経過に伴うユーザー活動の追跡
  • 財務または売上トレンドの提示
  • 動的チャートを使用したダッシュボードの作成

主な機能

  • カスタマイズ可能なラインの色とスタイル
  • 複数のデータシリーズのサポート
  • インタラクティブなタッチイベント
  • カスタマイズ可能な軸ラベルとグリッドライン
  • デバイス間でのレスポンシブデザイン

適している対象

  • データ駆動型アプリケーション
  • 分析ダッシュボード
  • ビジュアライゼーションを備えたモバイルおよびウェブアプリ
  • グラフ付きの教育ツール
  • チャートインターフェースのプロトタイピング

注意事項

  • 行ベースの可視化に限定
  • 組み込みのツールチップや凡例なし
  • 複雑なデータフォーマットの手動処理が必要です
  • 大規模なデータセットに対して最適化されていない
  • 高度な機能には外部の依存関係に依存しています

元の README

関連するソースリポジトリの README 原文のスナップショットです。最新の内容はリポジトリをご覧ください。

Line Chart

pub package

A simple flutter package to create a custom line chart

LineChart

Installations

Add line_chart: ^1.0.9 in your pubspec.yaml dependencies. And import it:

import 'package:line_chart/charts/line-chart.widget.dart';

How to use

Simply create a LineChart widget and pass the required params:

LineChart(
  width: 300, // Width size of chart
  height: 180, // Height size of chart
  data: [], // The value to the chart
  linePaint: Paint()
      ..strokeWidth = 3
      ..style = PaintingStyle.stroke
      ..color = Colors.black, // Custom paint for the line 
),

Here is the widget with all options for use.

LineChart(
  width: 300, // Width size of chart
  height: 180, // Height size of chart
  data: [], // The value to the chart
  linePaint: Paint()
      ..strokeWidth = 3
      ..style = PaintingStyle.stroke
      ..color = Colors.black, // Custom paint for the line 
  circlePaint: Paint()..color = Colors.black, // Custom paint for the line 
  showPointer: true, // When press or pan update the chart, create a pointer in approximated value (The default is true)
  showCircles: true, // Show the circle in every value of chart
  customDraw: (Canvas canvas, Size size) {}, // You can draw anything in your chart, this callback is called when is generating the chart
  circleRadiusValue: 6, // The radius value of circle
  linePointerDecoration: BoxDecoration(
    color: Colors.black,
  ) // Your line pointer decoration,
  pointerDecoration: BoxDecoration(
    shape: BoxShape.circle,
    color: Colors.black,
  ) // Your decoration of circle pointer,
  insideCirclePaint: Paint()..color = Colors.white // On your circle of the chart, have a second circle, which is inside and a slightly smaller size.
  onValuePointer: (MonthChartModel value) {
    print('onValuePointer');
  } // This callback is called when change the pointer,
  onDropPointer: () {
    print('onDropPointer');
  }, // This callback is called when it is on the pointer and removes your finger from the screen
),

For a more detail example please take a look at the example folder.

-

If something is missing, feel free to open a ticket or contribute!

カテゴリー

ソースリポジトリ

このパッケージを使用しているプロジェクト

データはまだありません。