stacked_bar_chart
A Flutter package for creating different types of charts.This package gives developer the flexibility to customize their graph as well.
Features
Plot graphs
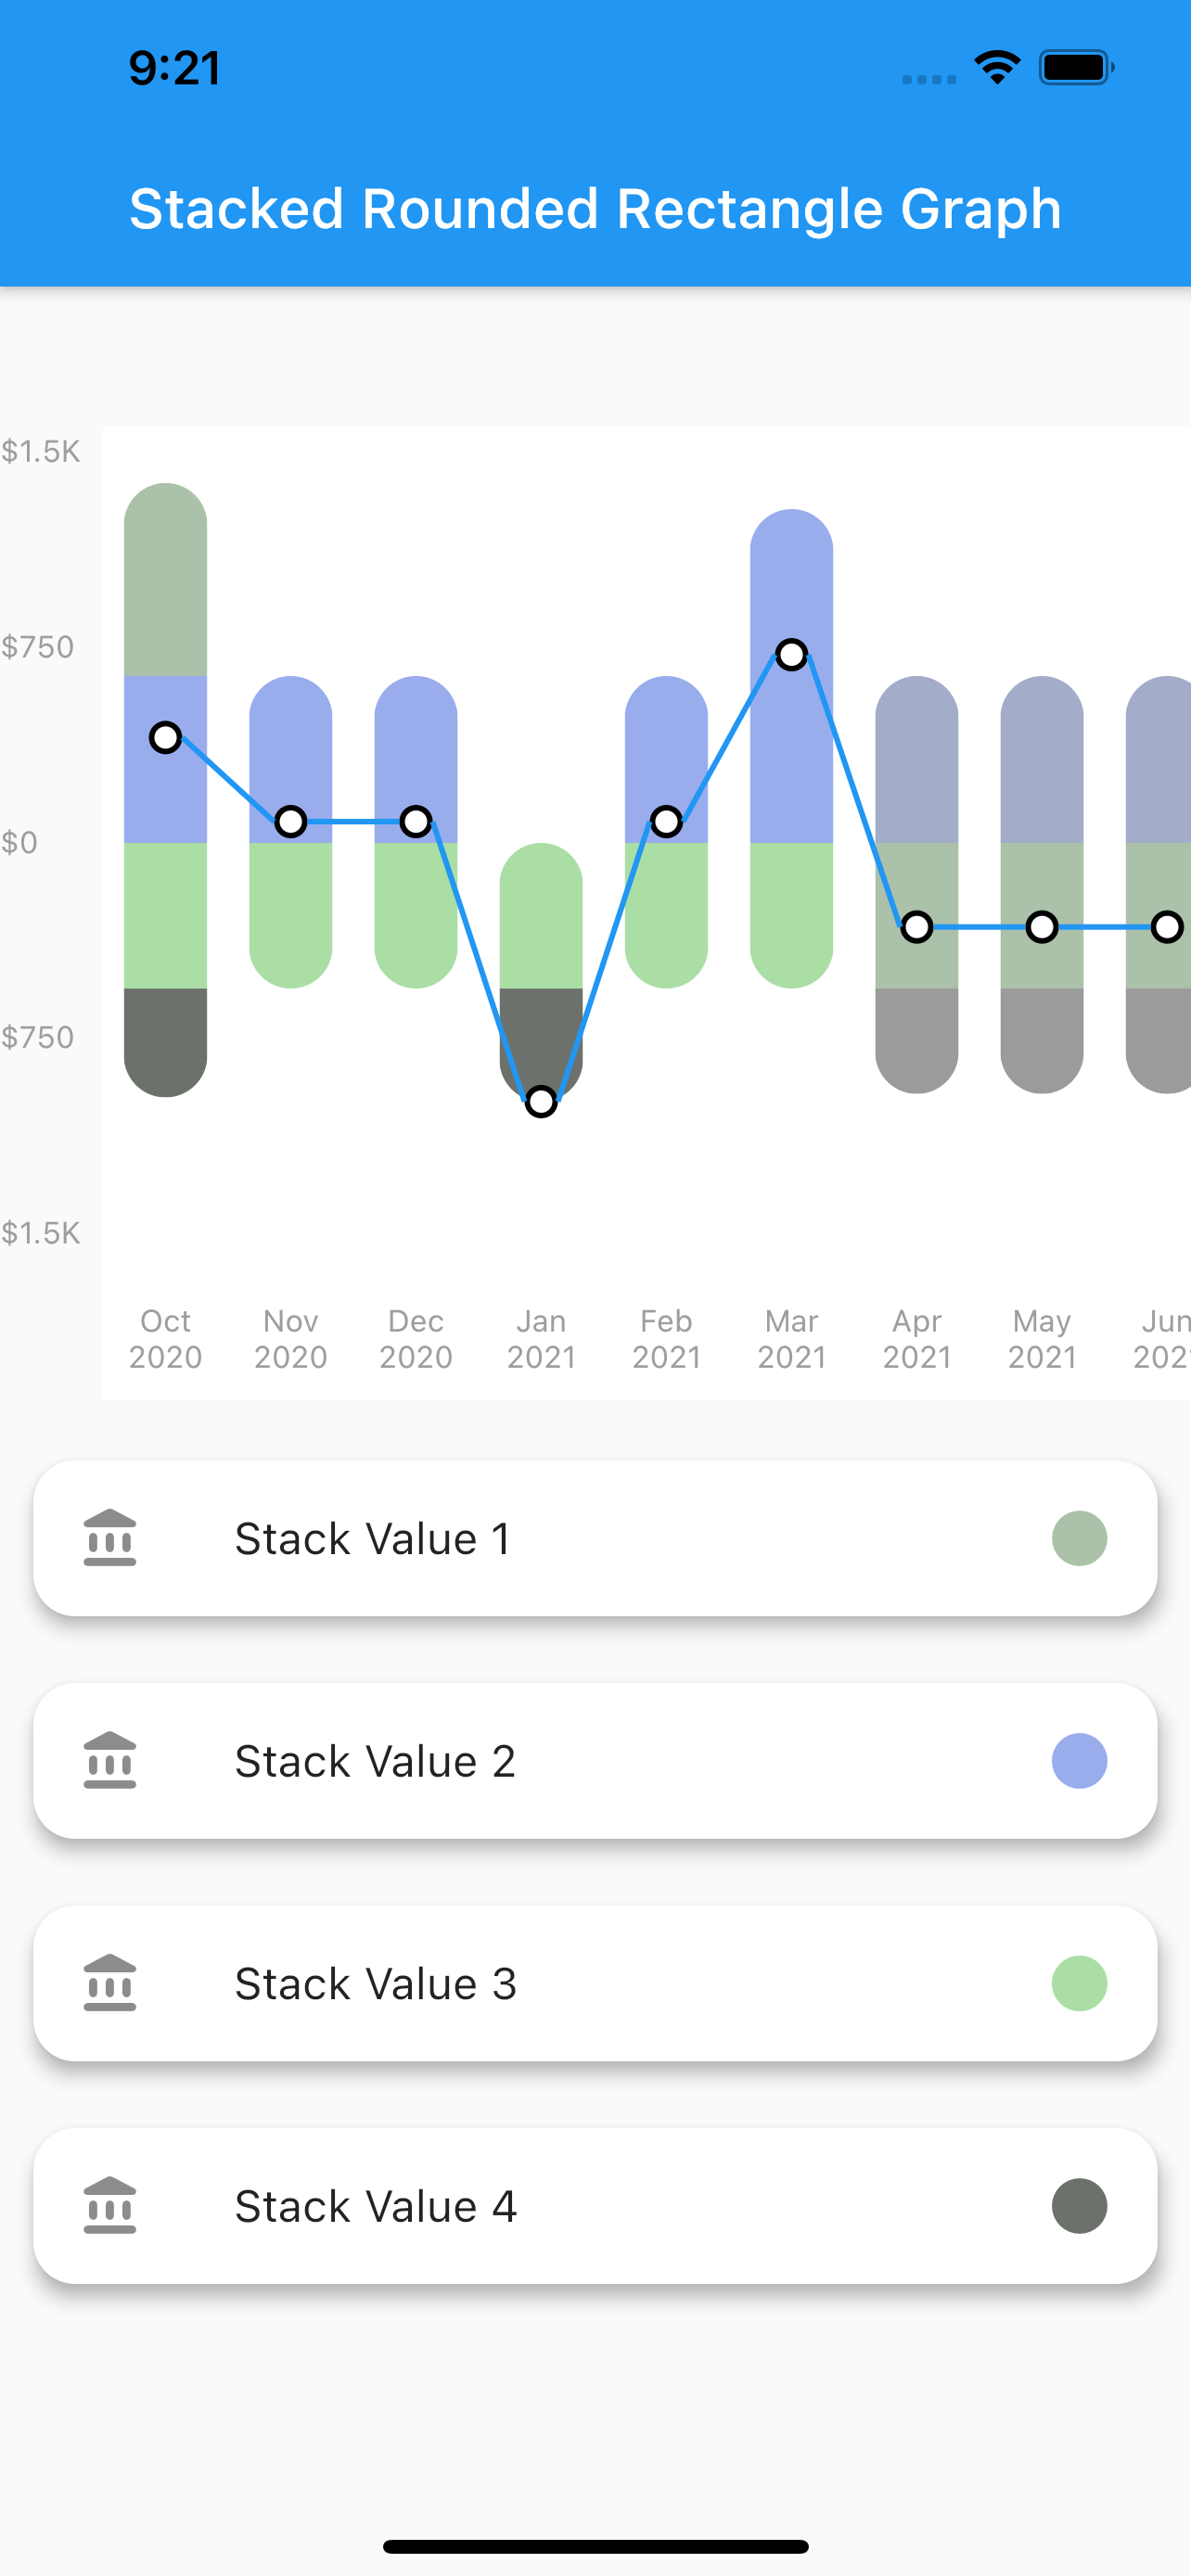
Stacked Rounded Rectangle Graph
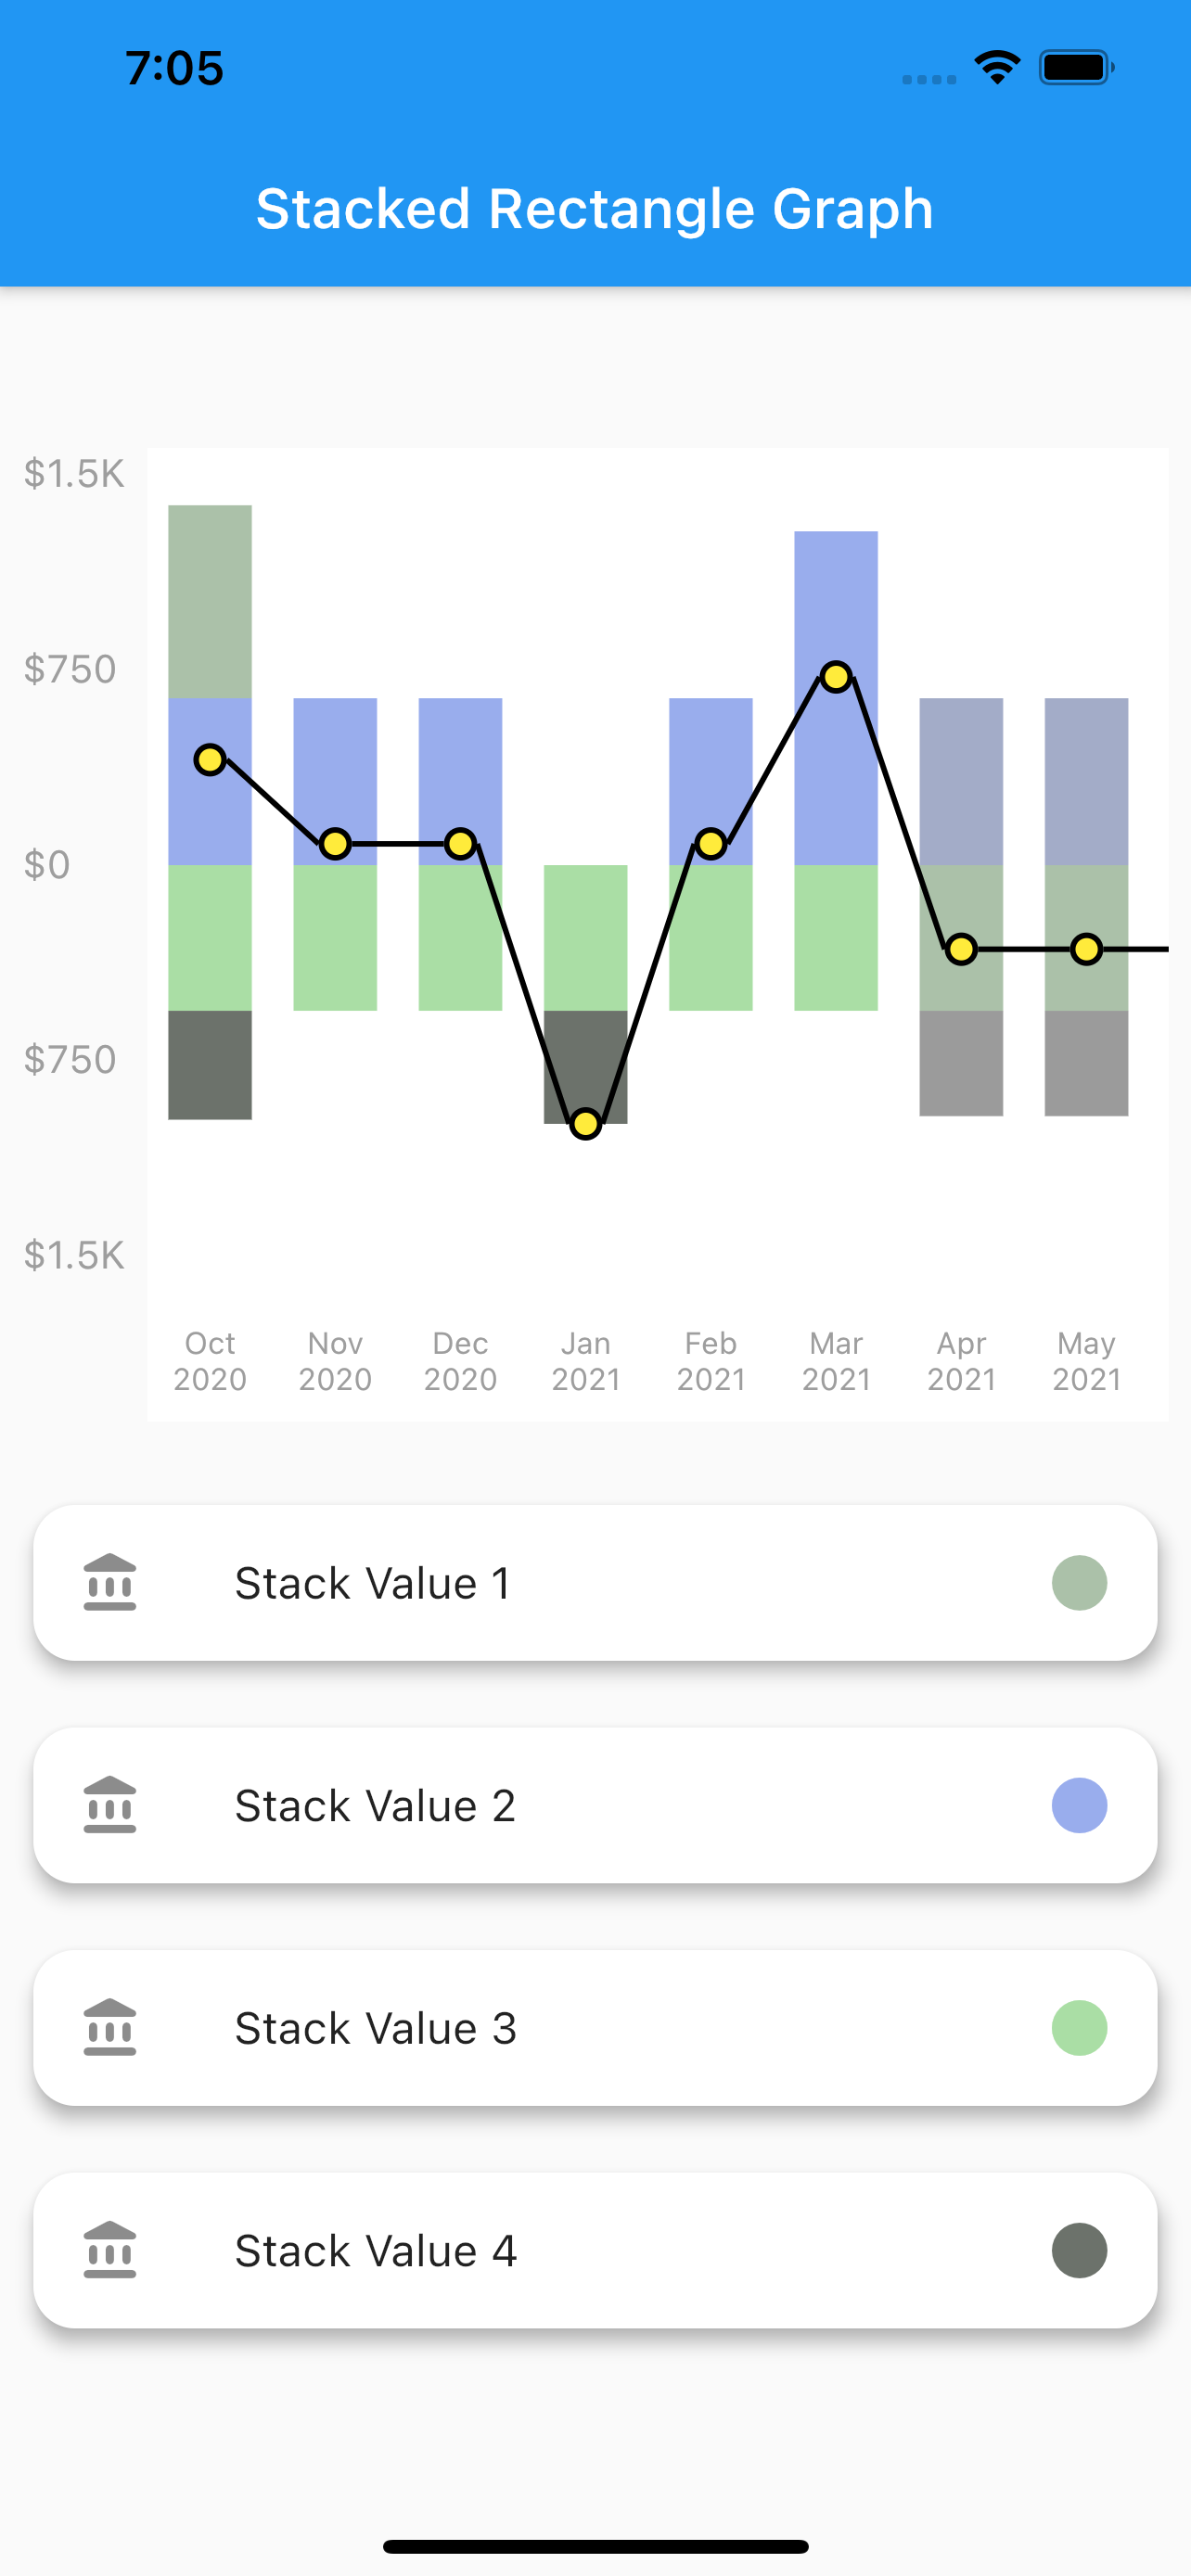
Stacked Rectangele Graph
Net Line Graph
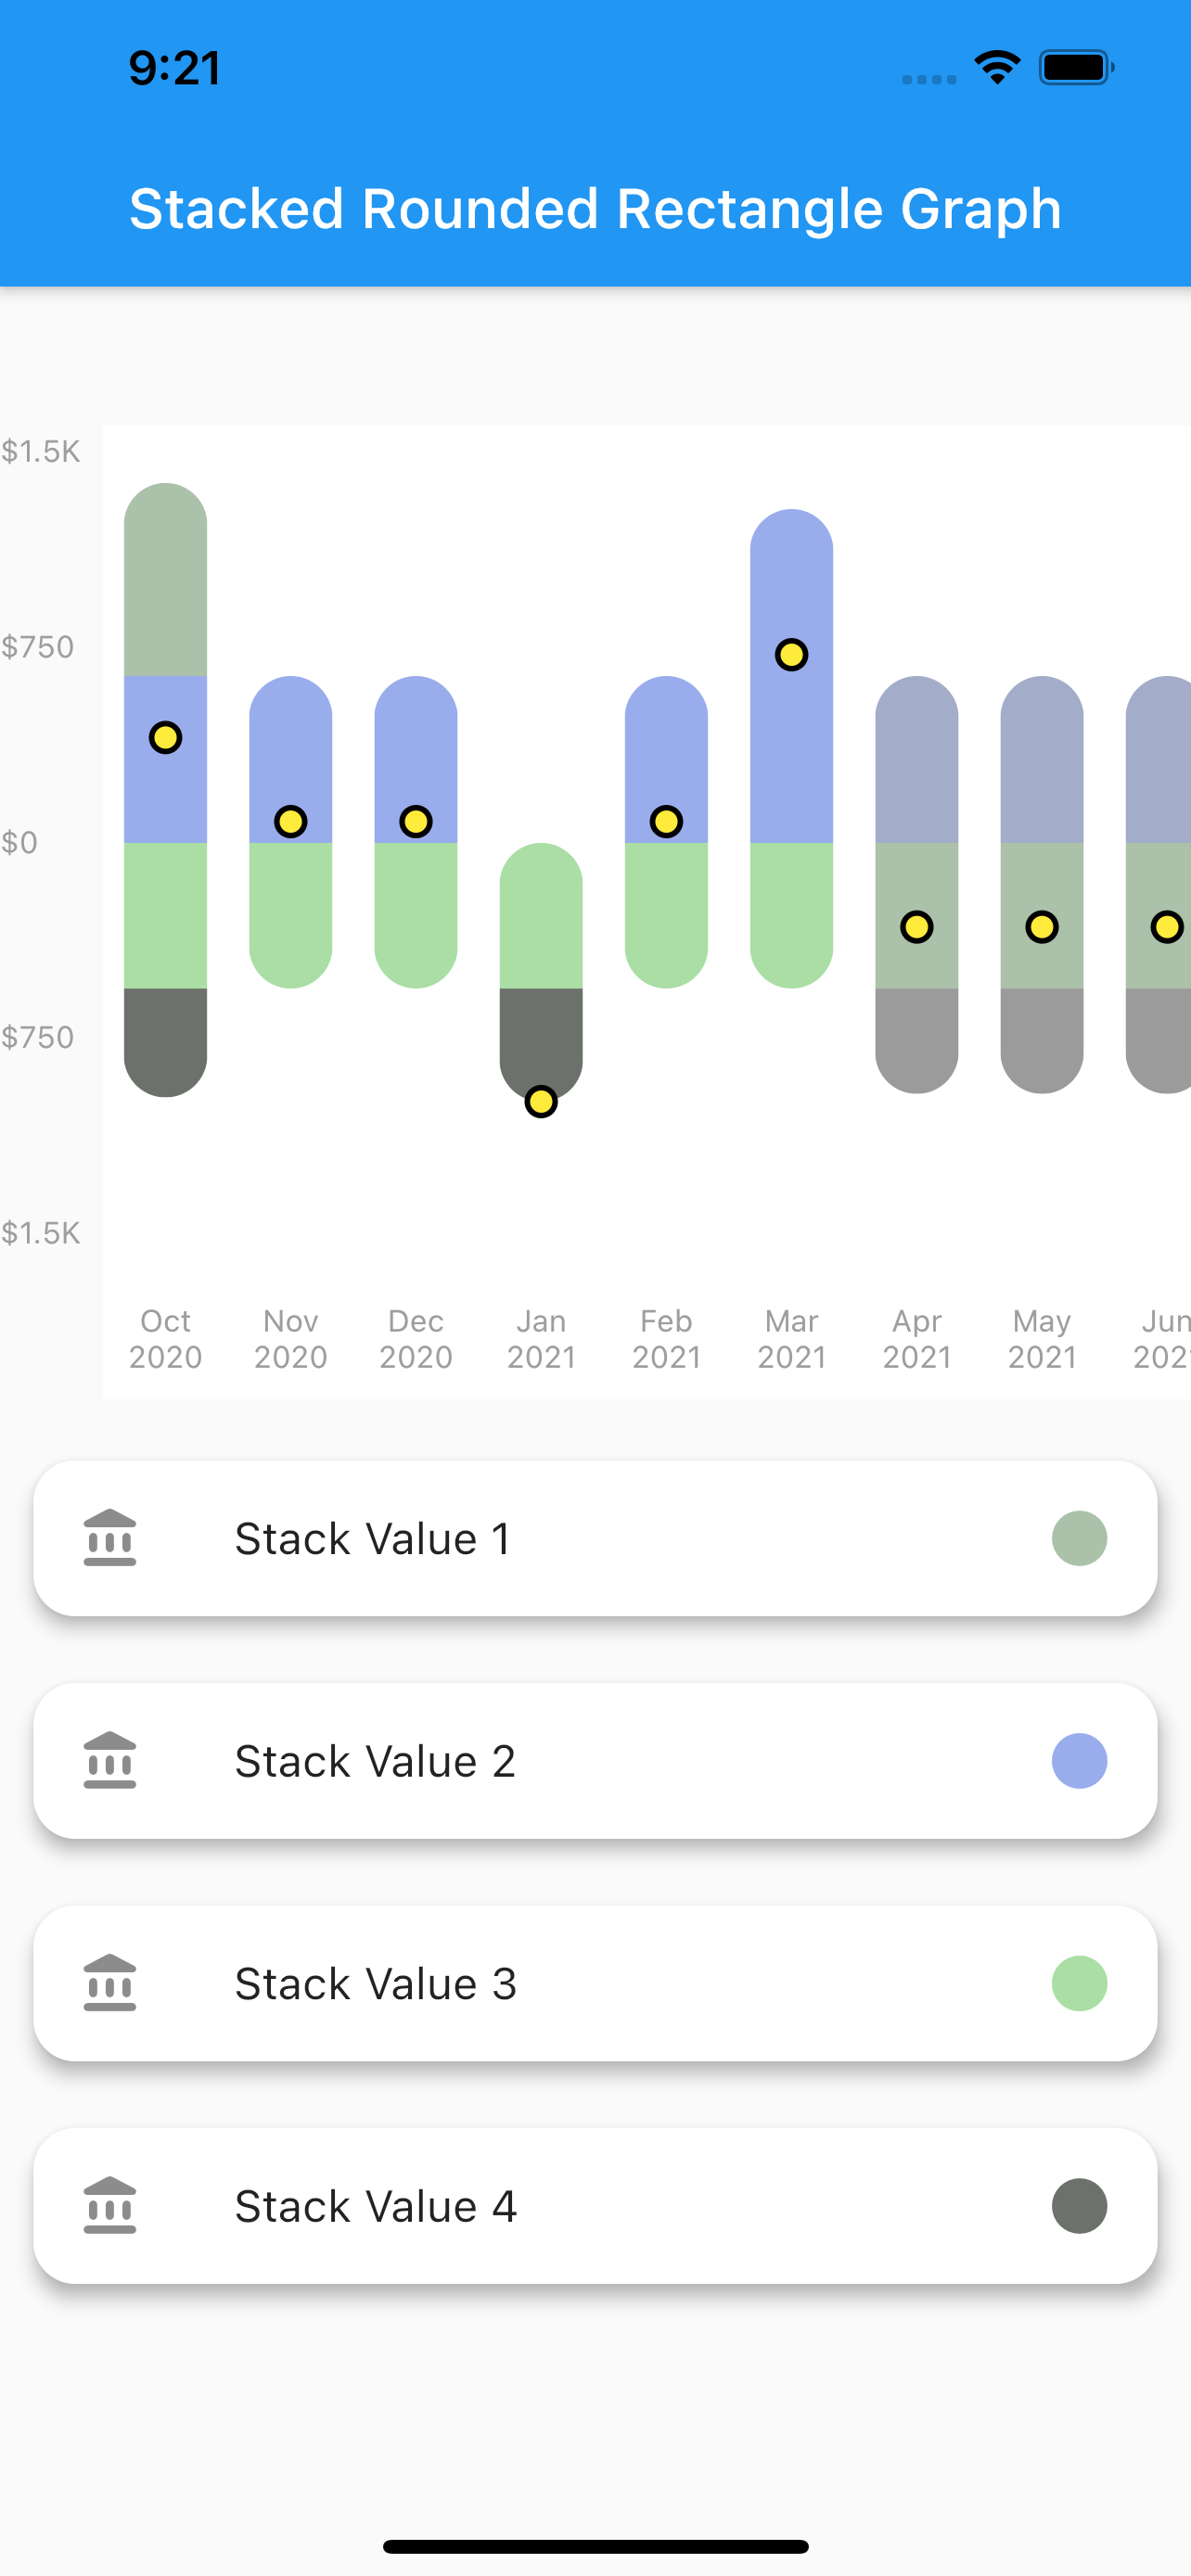
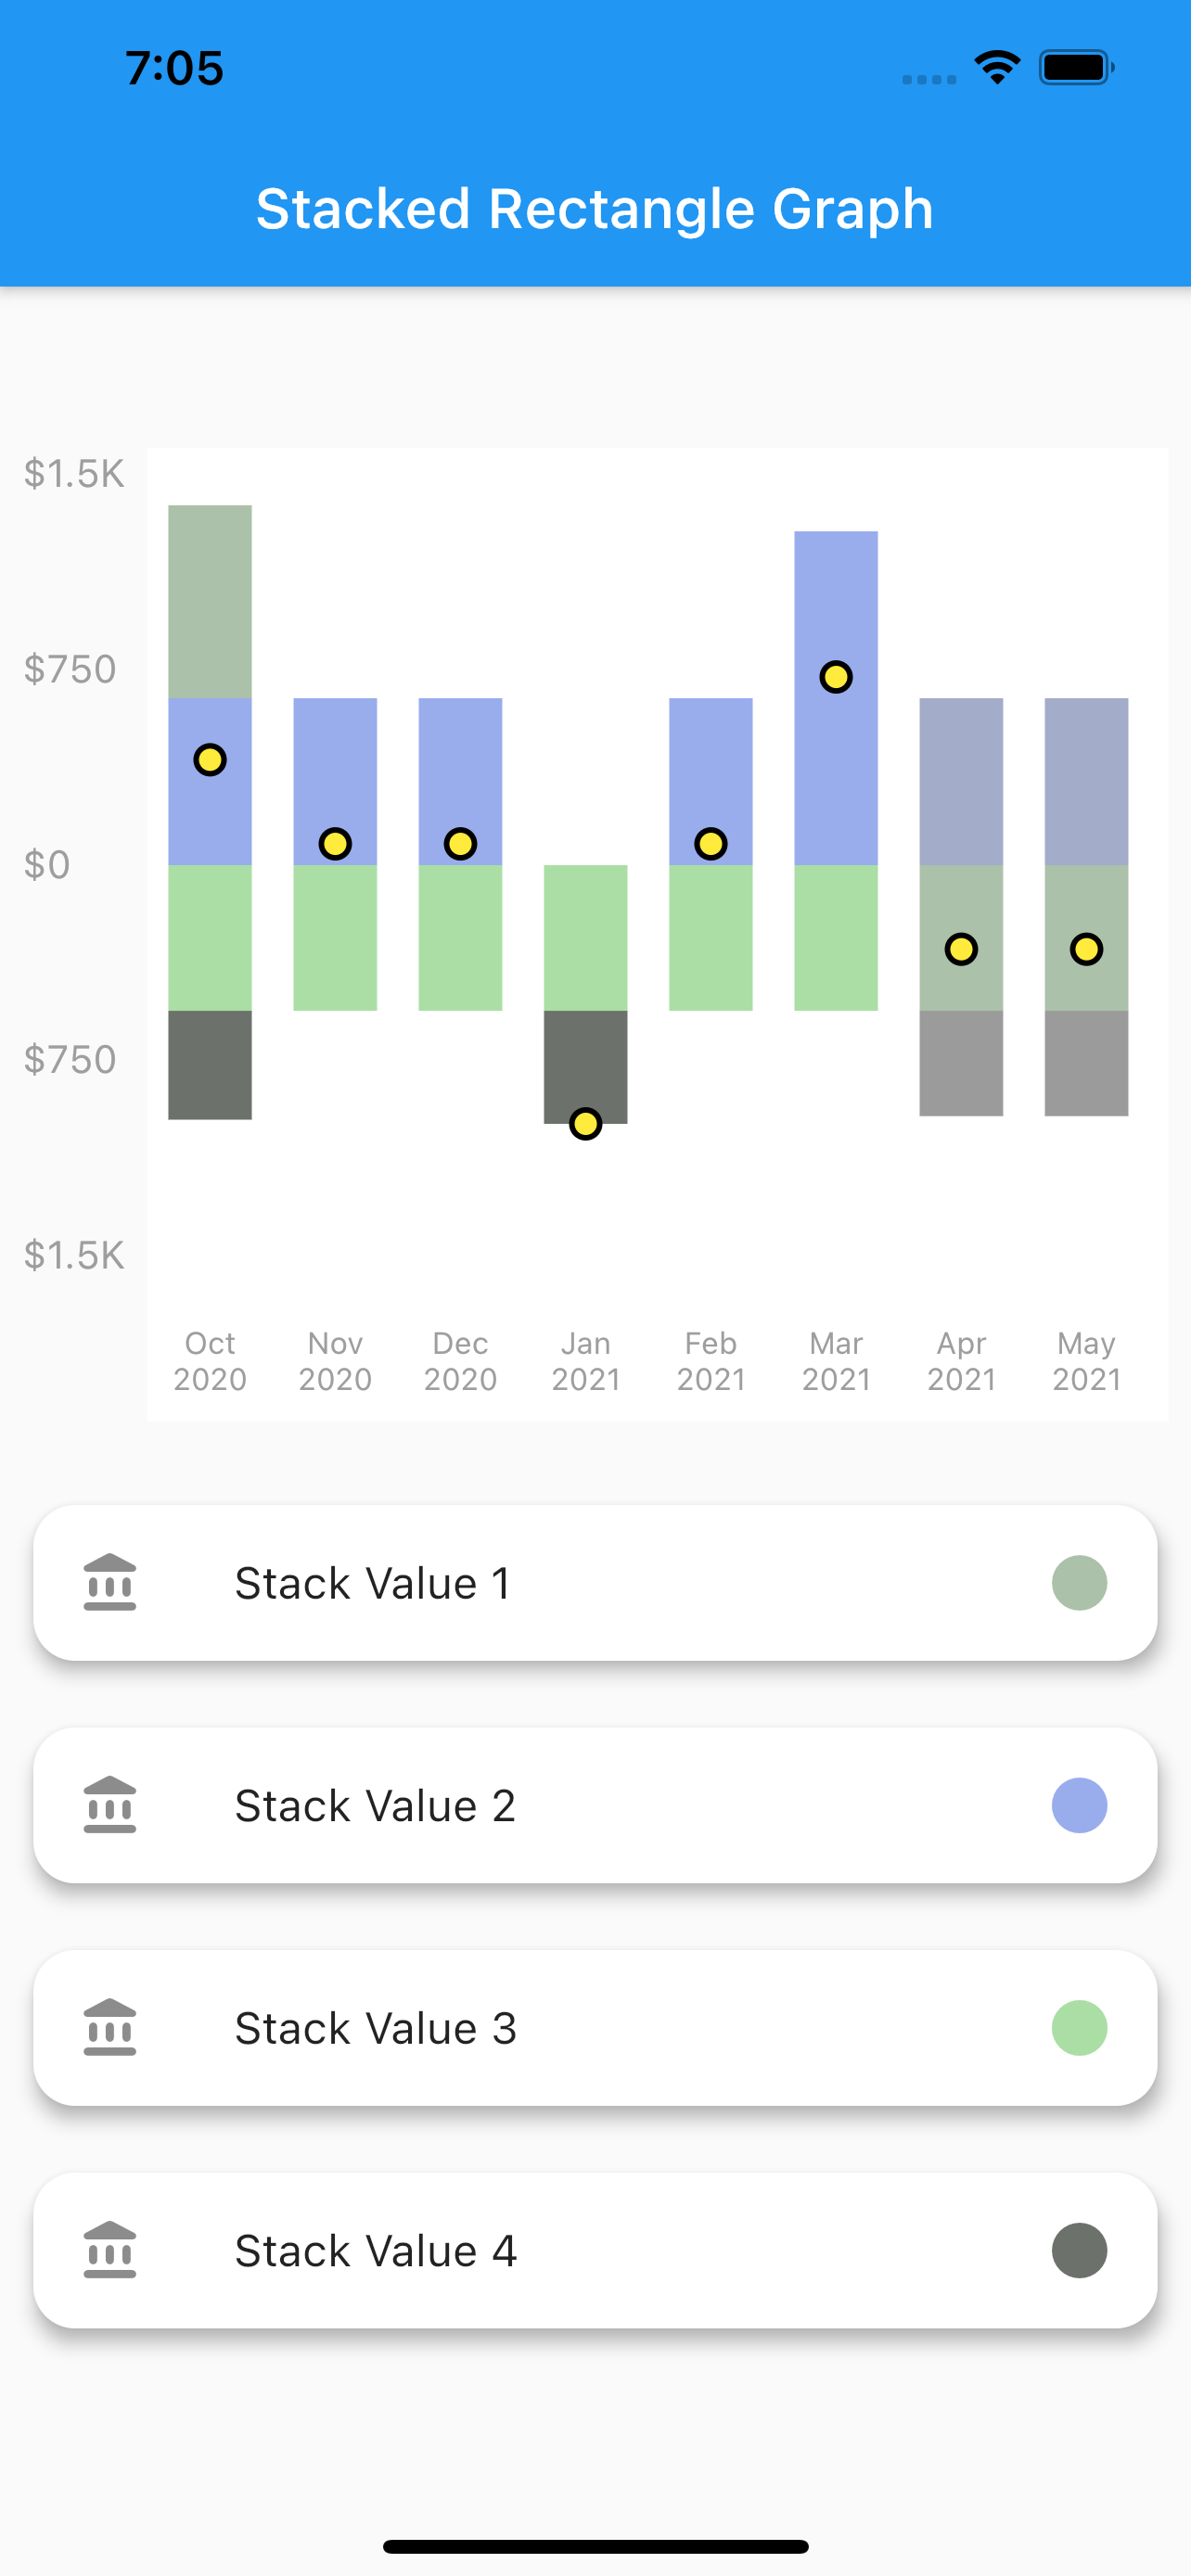
Net Point Graph
Customize your graph
Select if you want to display the net line
change core color,line color as well as line width of the net line
Scrollable
The graphs plotted are scrollable
Provide data in json format
You can use the toMap() and forMap() methods to provide your data in json format
Style your Labels
You can style both you X-axis and Y-axis Labels.
Callback on bar tap
A callback is provided on tap of each bar. Developer can use this feature as per their need.
Installation
In the dependencies: section of your pubspec.yaml, add the following line:
stacked_bar_chart:
Then import it as :
import 'package:stacked_bar_chart/stacked_bar_chart.dart' ;
Graph Types
1. Stacked Rounded Rectangle Graph
A simple stacked bar graph with rounded borders.
To plot this graph pass the GraphType.StackedRounded in graphType. as shown below
graphType: GraphType .StackedRounded
You can also change the styling of the line and point plotted.The color,width etc. can be changed using the netLine parameter as :
netLine: NetLine (
showPointOnly: false ,
showLine: true ,
lineColor: Colors .blue,
pointBorderColor: Colors .black,
coreColor: Colors .white,
),
2. Stacked Rectangle Graph
A simple stacked bar graph with no rounded borders. You can customize it in the same way as the stacked rounded rectangle graph.
To plot this graph pass the GraphType.StackedRect in graphType. as shown below
graphType: GraphType .StackedRect
3. Net Line Graph
A simple line graph plotted with the net values of the data provided. The net values of a particular data is calculated and plotted.It can also be customized in the same way as stacked rounded rectangle graph.
To plot this graph pass the GraphType.StackedRect in graphType. as shown below
graphType: GraphType .LineGraph
4. Net Point Graph
A simple plot of the net values of the data.You can customize the point core and it's outer border using the netPoint parameter.
To plot this graph pass the GraphType.StackedRect in graphType. and then pass parameters in netLine to remove the line as shown below
graphType: GraphType .LineGraph
netLine: NetLine (
showPointOnly: true ,
showLine: false ,
lineColor: Colors .blue,
pointBorderColor: Colors .black,
coreColor: Colors .white,
),
USAGE
class StackedBarGraph extends StatefulWidget StackedBarGraph ({Key key}) : super (key: key);
@override
_StackedBarGraphState createState () => _StackedBarGraphState ();
}
class _StackedBarGraphState extends State <StackedBarGraph > @override
Widget build (BuildContext context) {
return Scaffold (
appBar: AppBar (
title: Text ("Stacked Rounded Rectangle Graph" ),
),
body: Column (
children: [
SizedBox (
height: 50 ,
),
Graph (
yLabelConfiguration: YLabelConfiguration (
yLabelStyle: TextStyle (
color: Colors .grey,
fontSize: 11 ,
),
interval: 500 ,
labelCount: 5 ,
yLabelMapper: (num value) {
return NumberFormat .compactCurrency (
locale: "en" , decimalDigits: 0 , symbol: "\$" )
.format (value);
},
),
xLabelConfiguration: XLabelConfiguration (
xLabelStyle: TextStyle (
color: Colors .grey,
fontSize: 11 ,
),
xLabelMapper: (DateTime date) {
return DateFormat ("MMM yyyy" ).format (date);
},
),
netLine: NetLine (
showLine: true ,
lineColor: Colors .black,
pointBorderColor: Colors .black,
coreColor: Colors .yellow,
),
graphType: GraphType .StackedRounded ,
data: GraphData (
backgroundColor: Colors .white,
name: "ThePension" ,
bars: [
GraphBar (
month: DateTime (2020 , 01 ),
sections: [
GraphBarSection (value: 200 , color: Colors .pink),
GraphBarSection (value: 900 , color: Colors .blue),
GraphBarSection (value: -200 , color: Colors .amber),
GraphBarSection (value: -700 , color: Colors .purple),
],
),
GraphBar (
month: DateTime (2020 , 2 ),
sections: [
GraphBarSection (value: 300 , color: Colors .pink),
GraphBarSection (value: 700 , color: Colors .blue),
GraphBarSection (value: -400 , color: Colors .amber),
GraphBarSection (value: -600 , color: Colors .purple),
],
),
GraphBar (
month: DateTime (2020 , 3 ),
sections: [
GraphBarSection (value: 400 , color: Colors .pink),
GraphBarSection (value: 700 , color: Colors .blue),
GraphBarSection (value: -100 , color: Colors .amber),
GraphBarSection (value: -900 , color: Colors .purple),
],
),
GraphBar (
month: DateTime (2020 , 4 ),
sections: [
GraphBarSection (value: 400 , color: Colors .pink),
GraphBarSection (value: 0 , color: Colors .blue),
GraphBarSection (value: -800 , color: Colors .amber),
GraphBarSection (value: -400 , color: Colors .purple),
],
),
GraphBar (
month: DateTime (2020 , 5 ),
sections: [
GraphBarSection (value: 700 , color: Colors .pink),
GraphBarSection (value: 900 , color: Colors .blue),
GraphBarSection (value: -200 , color: Colors .amber),
GraphBarSection (value: -100 , color: Colors .purple),
],
),
GraphBar (
month: DateTime (2020 , 6 ),
sections: [
GraphBarSection (value: 900 , color: Colors .pink),
GraphBarSection (value: 900 , color: Colors .blue),
GraphBarSection (value: -200 , color: Colors .amber),
GraphBarSection (value: -100 , color: Colors .purple),
],
),
GraphBar (
month: DateTime (2020 , 7 ),
sections: [
GraphBarSection (value: 300 , color: Colors .pink),
GraphBarSection (value: 800 , color: Colors .blue),
GraphBarSection (value: -200 , color: Colors .amber),
GraphBarSection (value: -1100 , color: Colors .purple),
],
),
GraphBar (
month: DateTime (2020 , 8 ),
sections: [
GraphBarSection (value: 250 , color: Colors .pink),
GraphBarSection (value: 980 , color: Colors .blue),
GraphBarSection (value: -210 , color: Colors .amber),
GraphBarSection (value: -720 , color: Colors .purple),
],
),
GraphBar (
month: DateTime (2020 , 9 ),
sections: [
GraphBarSection (value: 300 , color: Colors .pink),
GraphBarSection (value: 200 , color: Colors .blue),
GraphBarSection (value: -200 , color: Colors .amber),
GraphBarSection (value: -400 , color: Colors .purple),
],
),
GraphBar (
month: DateTime (2020 , 10 ),
sections: [
GraphBarSection (value: 200 , color: Colors .pink),
GraphBarSection (value: 900 , color: Colors .blue),
GraphBarSection (value: -200 , color: Colors .amber),
GraphBarSection (value: -700 , color: Colors .purple),
],
),
],
),
onBarTapped: (GraphBar bar) {
print (bar.month);
},
),
],
),
);
}
}