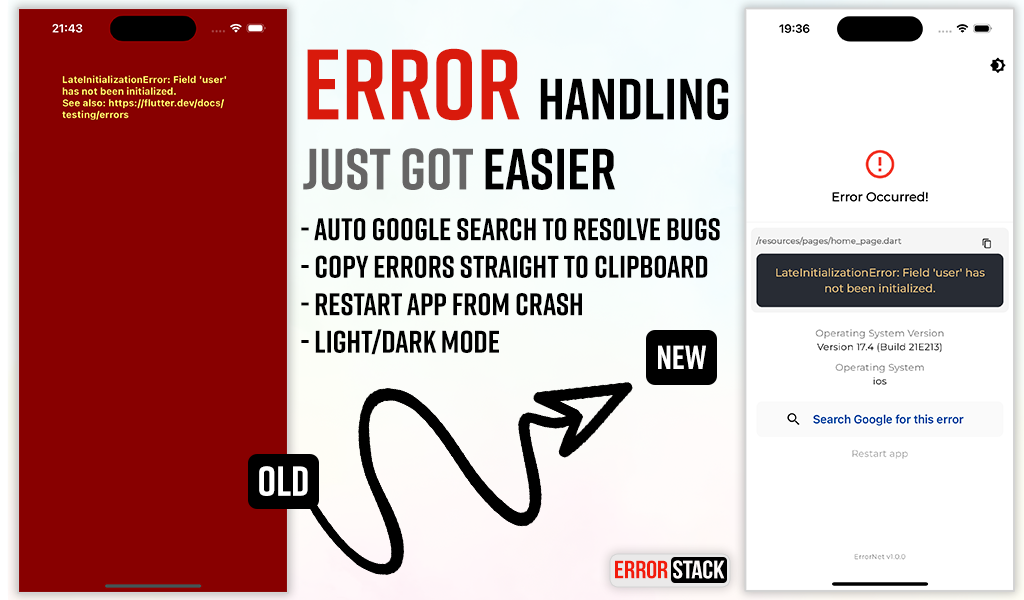
ErrorStack은 오류를 표시하기 위한 사용자 정의 가능한 UI와 강력한 로깅 기능을 제공하여 애플리케이션 내 오류 처리를 간소화하도록 설계된 Flutter 패키지입니다. 개발 및 운영 환경에서 문제를 신속하게 식별하고 해결할 수 있도록 도와주며 디버깅 효율성을 향상시킵니다. 여러 플랫폼을 지원하며 기존 워크플로우에 원활하게 통합됩니다. 예외 발생 시 명확하고 실행 가능한 피드백을 제공함으로써 생산성을 높입니다.
사용 사례
런타임 오류 디버깅
사용자 친화적인 오류 메시지 표시
분석을 위해 예외 로깅
앱 안정성 향상
생산 환경에서의 크래시 모니터링
개발자 워크플로우 향상
주요 기능
사용자 정의 가능한 오류 UI
내장 오류 로깅
크로스 플랫폼 지원
Flutter 앱과의 간편한 통합
실시간 오류 보고
사용자 정의 가능한 오류 처리 동작
적합한 대상
Flutter 개발자
CI/CD 파이프라인을 사용하는 팀
강력한 오류 모니터링이 필요한 앱
실패 시 사용자 경험에 집중하는 개발자
엄격한 오류 추적 요구 사항을 가진 프로젝트
디버깅 속도를 우선시하는 프론트엔드 팀
고려 사항
완전한 기능을 사용하려면 구성이 필요합니다
앱 크기가 약간 증가할 수 있습니다
로그 설정이 올바르게 이루어져야 함
사용자 맞춤 설정 없이 프로덕션 환경에서 사용하기 위한 것이 아님
오류 표시 및 로깅 범위에 제한됨
다른 모니터링 도구와 함께 사용하는 것이 가장 좋습니다
원본 README
연결된 소스 저장소의 README 원문 스냅샷입니다. 최신 내용은 저장소에서 확인하세요.
Error Stack for Flutter
Error Stack is a comprehensive error handling and debugging toolkit for Flutter. It provides beautiful error screens in debug mode with actionable information, customizable error pages for production, and a powerful dev panel for runtime debugging.
Features
Beautiful debug error screens with Google search links and stack traces
Customizable production error pages
Light and dark mode support
Dev Panel - Runtime debugging tool with:
API request/response logging
Console logging with severity levels
Navigation route tracking
Local storage viewer (Secure Storage & Shared Preferences)
UI debugging overlays (grid, layout bounds, etc.)
Dio interceptor for automatic HTTP logging
SOLID architecture with dependency injection support
Option 1: Long-press the "Dev Mode" bar at the bottom of the screen
Option 2: Call programmatically:
ErrorStack.showDevPanel(context);
API Tab
View HTTP requests and responses with timing, headers, and body data.
Dio Integration
import'package:error_stack/error_stack_dio.dart';
final dio = Dio();
dio.interceptors.add(ErrorStackDioInterceptor());
// All requests are automatically loggedfinal response = await dio.get('https://api.example.com/users');
Console logs with filtering by severity level. Tap the copy icon on any log entry to copy the full entry (level, timestamp, tag, message, and stack trace) to the clipboard.
import'package:error_stack/error_stack.dart';
// Log at different levelsDevPanelStore.instance.debug('Debug message');
DevPanelStore.instance.info('User logged in', tag: 'auth');
DevPanelStore.instance.warning('Cache miss for key');
DevPanelStore.instance.error('Failed to load data', stackTrace: trace.toString());
// With metadataDevPanelStore.instance.info(
'Payment processed',
tag: 'payments',
metadata: {'amount': 99.99, 'currency': 'USD'},
);
Routes Tab
Navigation history with route names, arguments, and actions. Tap a route to open its details sheet, where you can copy the route name to the clipboard.
Route tracking is automatic when using ErrorStackNavigatorObserver:
View all local storage data from both Secure Storage and Shared Preferences. Tap an entry to open the edit modal, where you can copy the key or value to the clipboard or update the stored value.
UI Debug Tools
The dev panel includes visual debugging overlays:
Tool
Description
Grid Paper
Overlay grid for alignment checking
Layout Bounds
Show widget boundaries
Text Scale
Override text scale (0.5-3.0x)
Color Blindness
Simulate protanopia, deuteranopia, tritanopia
Slow Animations
5x animation slowdown
Performance Overlay
Flutter performance metrics
Safe Areas
Visualize safe area boundaries
Control programmatically:
final store = DevPanelStore.instance;

store.toggleGridPaper(true);
store.setGridSpacing(24.0);
store.toggleLayoutBounds(true);
store.setTextScaleFactor(1.5);
store.setColorBlindnessMode(ColorBlindnessMode.protanopia);
store.toggleSlowAnimations(true);
store.togglePerformanceOverlay(true);
store.toggleSafeAreas(true);

// Reset all to defaults
store.resetUIDebugSettings();
Architecture
Error Stack follows SOLID principles with a modular design: