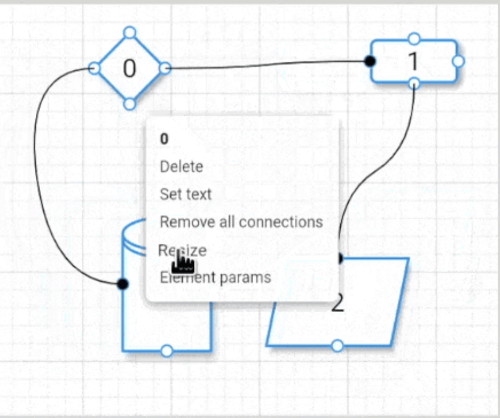
Flutter Flow Chart는 노드, 커넥터 및 스타일과 같은 사용자 정의 가능한 요소를 사용하여 상호작용 가능한 흐름도 다이어그램을 만들 수 있는 시각화 패키지입니다. 동적 레이아웃 조정을 지원하며, 미래에 사용하기 위해 대시보드를 저장할 수 있어 워크플로우의 연속성을 향상시킵니다. 프로세스나 데이터 흐름을 도식적으로 표현해야 하는 애플리케이션에 적합하며, Android, iOS, Web, macOS, Windows, Linux 등 모든 주요 플랫폼에서 작동합니다. Flutter 앱에 원활하게 통합되어 복잡한 시각화에 유연성과 확장성을 제공합니다.
사용 사례
프로세스 모델링
데이터 흐름 시각화
인터랙티브 대시보드
워크플로우 설계
교육 도구
시스템 아키텍처 다이어그램
주요 기능
사용자 정의 가능한 노드 및 커넥터
대시보드 저장/로드
크로스 플랫폼 지원
인터랙티브 다이어그램 편집
반응형 레이아웃
확장 가능한 디자인 시스템
적합한 대상
다이어그램이 많은 앱을 개발하는 개발자
시각 학습 자료를 만드는 교육자
비즈니스 분석가가 워크플로우를 설계하고 있습니다
소프트웨어 아키텍트가 시스템을 시각화하고 있습니다
고려 사항
고급 레이아웃을 위해 수동 구성이 필요합니다
제한된 내장 템플릿
큰 다이어그램에서는 성능이 달라질 수 있습니다
복잡한 상호작용에 대한 학습 곡선
내장된 내보내기 기능 없음
원본 README
연결된 소스 저장소의 README 원문 스냅샷입니다. 최신 내용은 저장소에서 확인하세요.
Flutter Flow Chart
A package that let you draw a flow chart diagram with different kinds of customizable elements. Dashboards can be saved for later use.
then use the _dashboard_ variable to add, remove, resize, etc. elements or load/save the dashboard.

In the [example](https://github.com/alnitak/flutter_flow_chart/blob/master/example/lib/main.dart), the [StarMenu](https://pub.dev/packages/star_menu) package is used to easily interact with user inputs.
The Dashboard
The **Dashboard** object contains all the methods described below used to interact with the flow chart.

| **relevant methods**       | **description**                                                                                                          |
| -------------------------- | ------------------------------------------------------------------------------------------------------------------------ |
| _setGridBackgroundParams_  | set grid background parameters                                                                                           |
| _setHandlerFeedbackOffset_ | set the feedback offset to help on mobile device to see the end of arrow and not hiding behind the finger when moving it |
| _setElementResizable_      | set the element as resizable. A handle will be displayed on the bottom right and will disappear when finish resizing     |
| _addElement_               | add a _FlowElement_ to the dashboard                                                                                     |
| _removeAllElements_        | remove all elements                                                                                                      |
| _removeElementConnection_  | remove the given handler connection of the given element                                                                 |
| _removeElementConnections_ | remove all the connections from the given element                                                                        |
| _removeElementById_        | remove all the elements with the given id from the dashboard                                                             |
| _removeElement_            | remove the given element                                                                                                 |
| _addNextById_              | make a connection from the given sourceElement to the elements with the given id                                         |
| _recenter_                 | Recenter the dashboard relative to the first element in the element array                                                |
| _saveDashboard_            | save the dashboard into the given file path                                                                              |
| _loadDashboard_            | clear the dashboard and load the new one                                                                                 |
| _setZoomFactor_            | Zoom the entire dashboard and content by the given factor corresponding to the given epicenter                           |
| _dissectElementConnection_ | Dissect the connection into two segments from the given point. Only available on ArrowStyle.segmented                    |
| _dissectElementConnection_ | Remove dissection by the given pivot                                                                                     |
| _setArrowStyle_            | Update arrow style for single connection using the source and destination elements                                       |
The FlowElement
The _FlowElement_ defines the element kind with its position, size, colors and so on.

| **properties**    | **type**               | **description**                                                              |
| ----------------- | ---------------------- | ---------------------------------------------------------------------------- |
| _position_        | Offset                 | The position of the _FlowElement_                                            |
| _size_            | Size                   | The size of the _FlowElement_                                                |
| _text_            | String                 | Element text                                                                 |
| _textColor_       | Color                  | Text color                                                                   |
| _fontFamily_      | String                 | Text font family                                                             |
| _textSize_        | double                 | Text size                                                                    |
| _textIsBold_      | bool                   | Makes text bold if true                                                      |
| _kind_            | ElementKind            | Element shape: enum {rectangle, diamond, storage, oval, parallelogram}       |
| _handlers_        | List<Handler>          | Connection handlers: enum {topCenter, bottomCenter, rightCenter, leftCenter} |
| _handlerSize_     | Size                   | The size of element handlers                                                 |
| _backgroundColor_ | Size                   | Background color of the element                                              |
| _borderColor_     | Size                   | Border color of the element                                                  |
| _borderThickness_ | Size                   | Border thickness of the element                                              |
| _elevation_       | Size                   | Shadow elevation                                                             |
| _next_            | List<ConnectionParams> | Shadow elevation                                                             |

| **relevant methods** | **description**                                                                                                                      |
| -------------------- | ------------------------------------------------------------------------------------------------------------------------------------ |
| _setIsResizing_      | When setting to true, a handler will disply at the element bottom right to let the user to resize it. When finish it will disappear. |
| _setText_            | Set element text                                                                                                                     |
| _setTextColor_       | Set text color                                                                                                                       |
| _setTextSize_        | Set text size                                                                                                                        |
| _setTextIsBold_      | Set text bold                                                                                                                        |
| _setBackgroundColor_ | Set background color                                                                                                                 |
| _setBorderColor_     | Set border color                                                                                                                     |
| _setBorderThickness_ | Set border thickness                                                                                                                 |
| _setElevation_       | Set elevation                                                                                                                        |
| _changePosition_     | Change element position in the dashboard                                                                                             |
| _changeSize_         | Change element size                                                                                                                  |
Examples
Add an element to Dashboard
Dashboard dashboard = Dashboard();
////////////////////////////////////// Define 2 elementsFlowElement element1 = FlowElement(
/// position in the local dashboard coordinates
position: constOffset(100, 100),
/// element size
size: constSize(100, 100),
/// text to show
text: 'diamond',
/// rectangle, diamond, storage, oval or parallelogram element kind
kind: ElementKind.diamond,
/// which handler to make active
handlers: [
Handler.bottomCenter,
Handler.topCenter,
Handler.leftCenter,
Handler.rightCenter,
]);
FlowElement element2 = FlowElement(
position: constOffset(300, 100),
size: constSize(100, 150),
text: 'rect',
kind: ElementKind.rectangle,
handlers: [
Handler.bottomCenter,
Handler.topCenter,
Handler.leftCenter,
Handler.rightCenter,
]);
////////////////////////////////////// Add the element to Dashboard
dashboard.addElement(element);
////////////////////////////////////// Connect right handler of element1/// to the left handler of element2
dashboard.addNextById(
element1,
element2.id,
ArrowParams(
thickness: 1.5,
color: Colors.Black,
startArrowPosition: Alignment.centerRight,
endArrowPosition: Alignment.centerLeft,
),
);
////////////////////////////////////// Save/load dashboardDirectory appDocDir = await path.getApplicationDocumentsDirectory();
dashboard.saveDashboard('${appDocDir.path}/FLOWCHART.json');
dashboard.loadDashboard('${appDocDir.path}/FLOWCHART.json');
Adding custom data to FlowElement
The library supports attaching arbitrary data to each element via the generic elementData field. To preserve this data across JSON save/load you must provide a serializer when creating the Dashboard. The serializer implements the DataSerializer<T, JSON> mixin and converts between your data type and a JSON-compatible representation (typically Map<String, dynamic>).
Notes
The Dashboard, FlowChart and FlowElement must use the same generic type T.
If no serializer is provided, elementData will be treated as JSON serializable as it is, but will cause an error when the data is not serializable.
Minimal example
// Serializer that converts ExampleData <-> Map<String, dynamic>classExampleDataSerializerwithDataSerializer<ExampleData, Map<String, dynamic>> {
@overrideExampleData? fromJson(Map<String, dynamic>? source) {
if (source == null) returnnull;
returnExampleData(
name: source['name'] asString,
value: source['value'] asint,
);
}
@overrideMap<String, dynamic>? toJson(ExampleData? data) {
if (data == null) returnnull;
return <String, dynamic>{
'name': data.name,
'value': data.value,
};
}
}
classExampleData{
ExampleData({ requiredthis.name, requiredthis.value });
finalString name;
finalint value;
}
// Create a dashboard that knows how to (de)serialize ExampleDatafinalDashboard<ExampleData> dashboard = Dashboard<ExampleData>(
dataSerializer: ExampleDataSerializer(),
);
// Use the same generic type for the FlowChartFlowChart<ExampleData>(
dashboard: dashboard,
onDashboardTapped: ((context, position) {}),
onDashboardLongtTapped: ((context, position) {}),
onElementLongPressed: (context, element) {},
onElementPressed: (context, element) {},
onHandlerPressed: (context, position, handler, element) {},
onHandlerLongPressed: (context, position, handler, element) {},
onScaleUpdate: (newScale) {},
);
// Create an element with custom datafinalFlowElement<ExampleData> element = FlowElement<ExampleData>(
position: constOffset(300, 100),
size: constSize(100, 150),
text: 'rect',
kind: ElementKind.rectangle,
handlers: [
Handler.bottomCenter,
Handler.topCenter,
Handler.leftCenter,
Handler.rightCenter,
],
elementData: ExampleData(value: 42, name: 'Example Data'),
);
// Save/load will preserve `elementData` thanks to the provided serializerawait dashboard.saveDashboard('${appDocDir.path}/FLOWCHART.json');
await dashboard.loadDashboard('${appDocDir.path}/FLOWCHART.json');
This preserves your custom data across persistence and ensures type-safety when interacting with elements in the UI.
Adding custom element to FlowChart
The library supports custom elements via ElementKind.custom.
When you use ElementKind.custom, provide a customElementBuilder to the FlowChart constructor. The builder is called for each element with kind == ElementKind.custom and must return a Widget.
Minimal example
// flow chart constructionFlowChart(
dashboard: dashboard,
// ...callbacks...// custom element builder: receives (BuildContext, FlowElement<T>)
customElementBuilder: (context, element) =>
SomeCustomWidget(text: element.text),
);
// new element (same as any other element)
dashboard.addElement(
FlowElement(
position: position,
size: constSize(100, 150),
text: '${dashboard.elements.length}',
handlerSize: 25,
handlers: [
Handler.bottomCenter,
Handler.leftCenter,
Handler.rightCenter,
],
elementData: ExampleData(name: 'Example', value: 42),
kind: ElementKind.custom,
),
);
Multiple custom element types
The library does not provide multiple custom builders. Use elementData as a discriminator: store a type/id in your custom data and inspect it inside customElementBuilder to render different widgets.
// element with discriminator
dashboard.addElement(
FlowElement(
position: position,
size: constSize(100, 150),
text: '1',
handlers: [Handler.bottomCenter],
elementData: ExampleData(name: 'Example', value: 42, type: 'STAR'),
kind: ElementKind.custom,
),
);
// builder inspects element.elementDataFlowChart(
dashboard: dashboard,
customElementBuilder: (context, element) {
final data = element.elementData asExampleData?;
if (data?.type == 'STAR') returnStarWidget(data: data);
if (data?.type == 'CIRCLE') returnCircleWidget(data: data);
returnDefaultCustomWidget(text: element.text);
},
);
This keeps the API simple while letting you implement any number of custom element views.