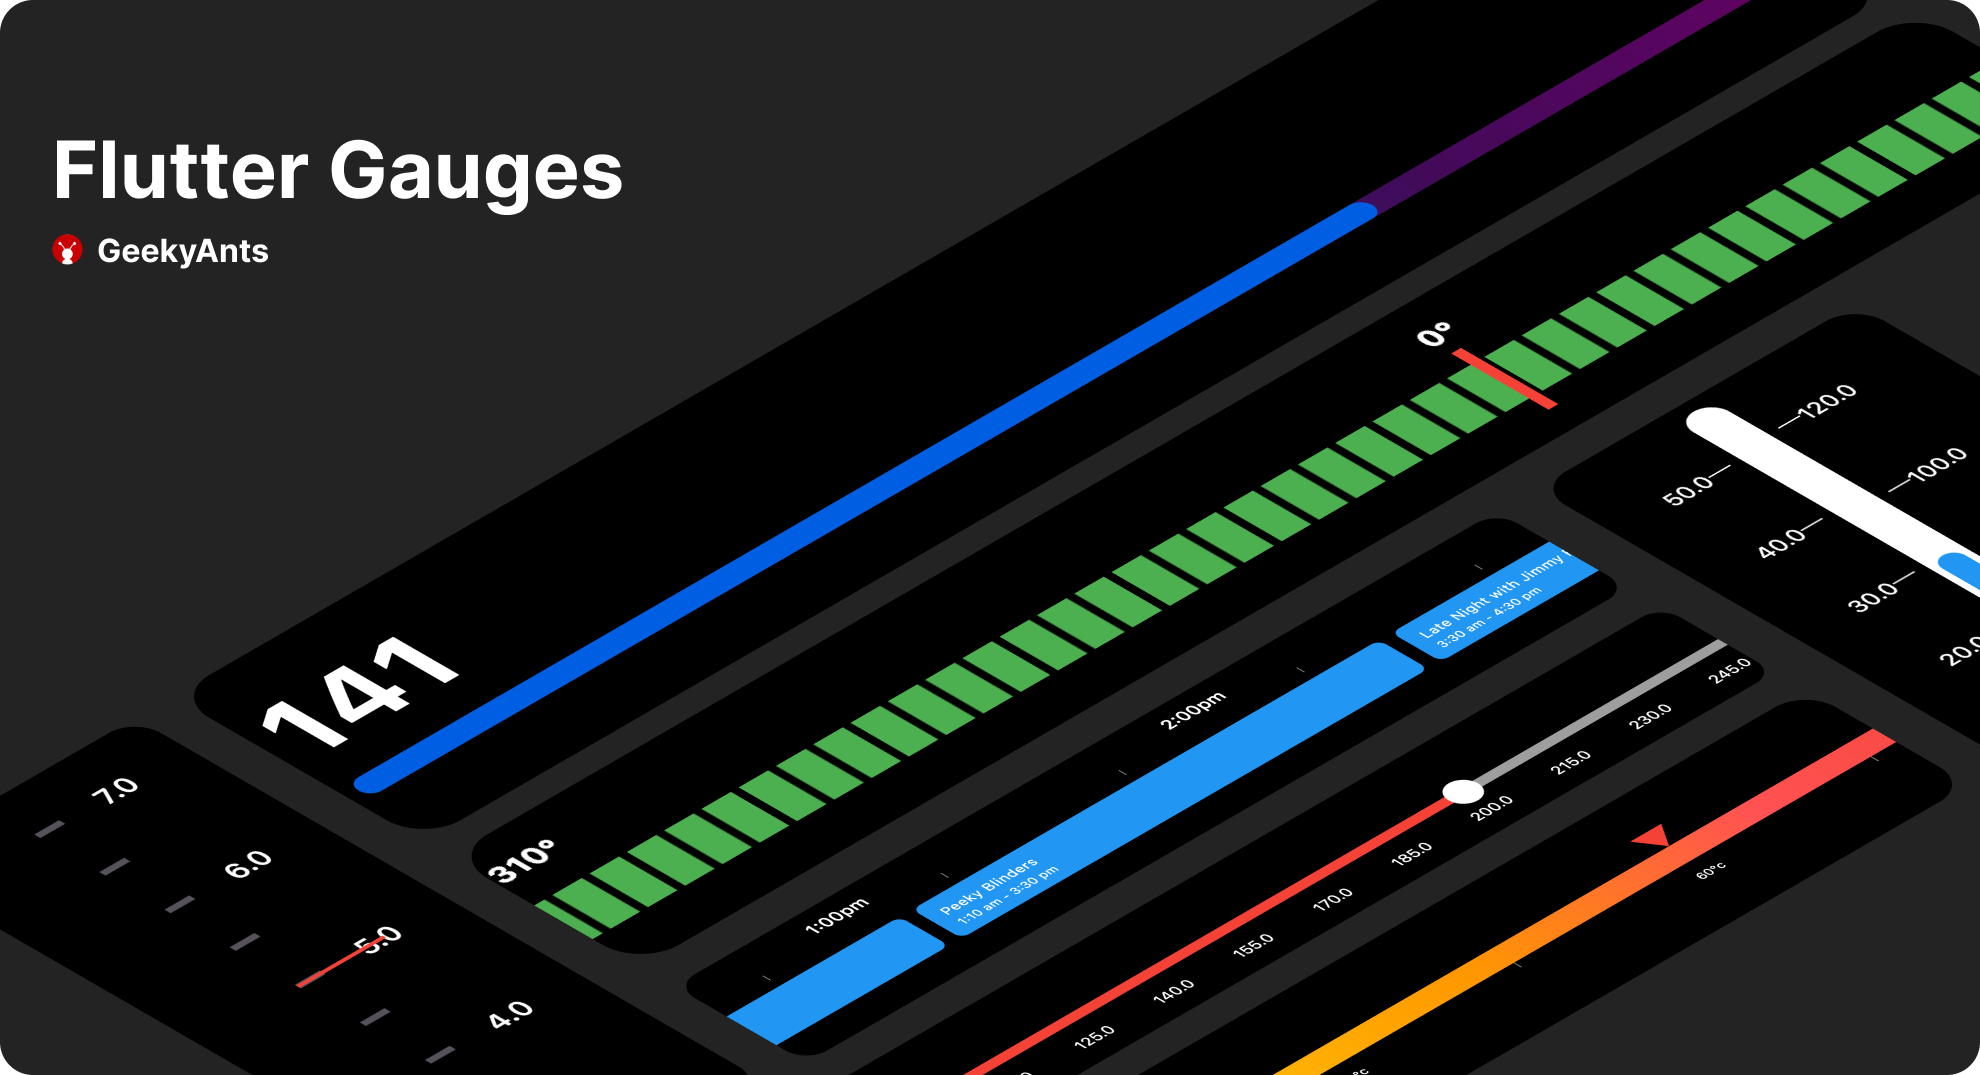
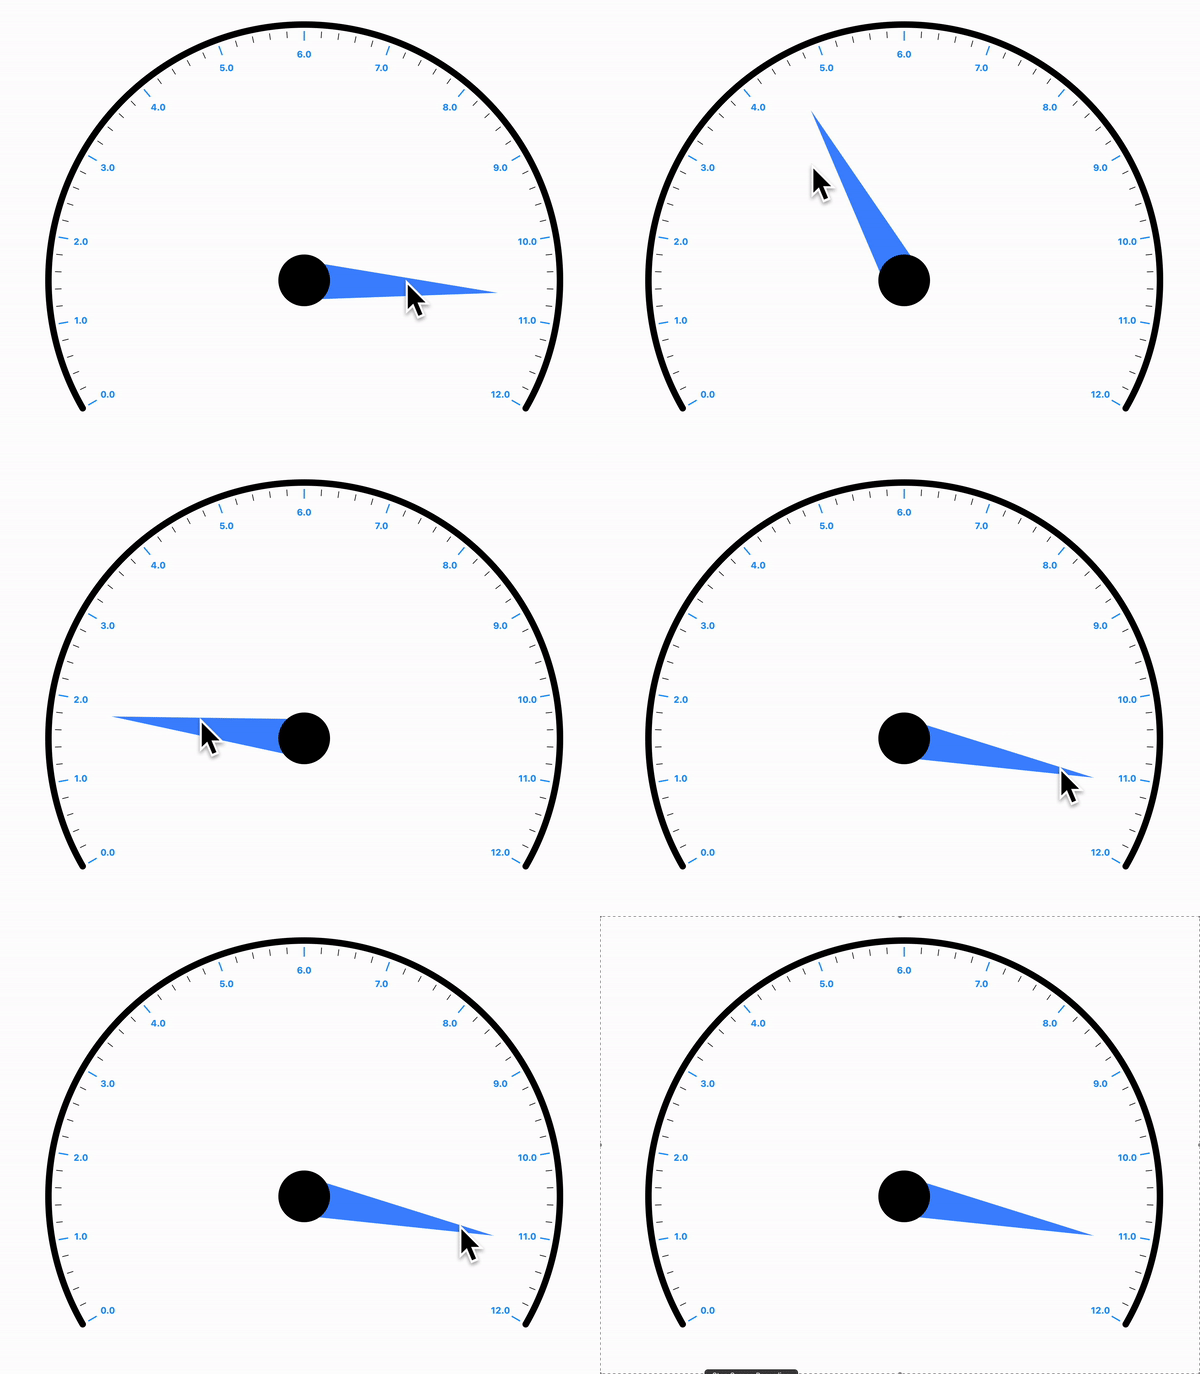
Flutter용 사용자 정의 가능한 선형 게이지 패키지로, 진행 상황이나 데이터 값을 시각적으로 표현하도록 설계되었습니다. 외관과 동작에 다양한 스타일링 옵션을 지원하여 대시보드, 헬스 트래커 또는 성능 지표에 적합합니다. Android, iOS, Web, macOS, Windows, Linux 등 다양한 플랫폼에서 반응형으로 작동합니다. 직관적인 구성으로 개발자는 앱에 부드럽고 애니메이션된 진행률 표시를 쉽게 통합할 수 있습니다.
사용 사례
대시보드 위젯
진행 상황 추적
성능 모니터링
건강 및 피트니스 앱
다이어그램에서의 데이터 시각화
주요 기능
사용자 정의 가능한 외관
애니메이션 진행 표시
크로스 플랫폼 지원
사용자 정의 범위 및 레이블
반응형 디자인
여러 테마를 지원합니다
적합한 대상
데이터 대시보드를 구축하는 개발자
시각적 진행 상태 표시기가 필요한 앱
크로스 플랫폼 요구 사항이 있는 프로젝트
재사용 가능한 컴포넌트를 찾는 UI 디자이너
고려 사항
선형 게이지에 한정됨(원형 변형 없음)
동적 업데이트를 수동으로 처리해야 합니다
복잡한 레이아웃을 위해 추가 스타일링이 필요할 수 있습니다
원본 README
연결된 소스 저장소의 README 원문 스냅샷입니다. 최신 내용은 저장소에서 확인하세요.
Gauges
A gauge, in science and engineering, is a device used to make measurements or in order to display certain dimensional information. A wide variety of tools exist which serve such functions, ranging from simple pieces of material against which sizes can be measured to complex pieces of machinery.Here in Flutter you can use this package to plot a machinery information effortlessly.
Demo Application
To fully explore the capabilities of our Linear Gauge, we recommend checking out our Demo Application which consists of Use Cases and Playgrounds for Linear Gauge
DEMO APPLICATION
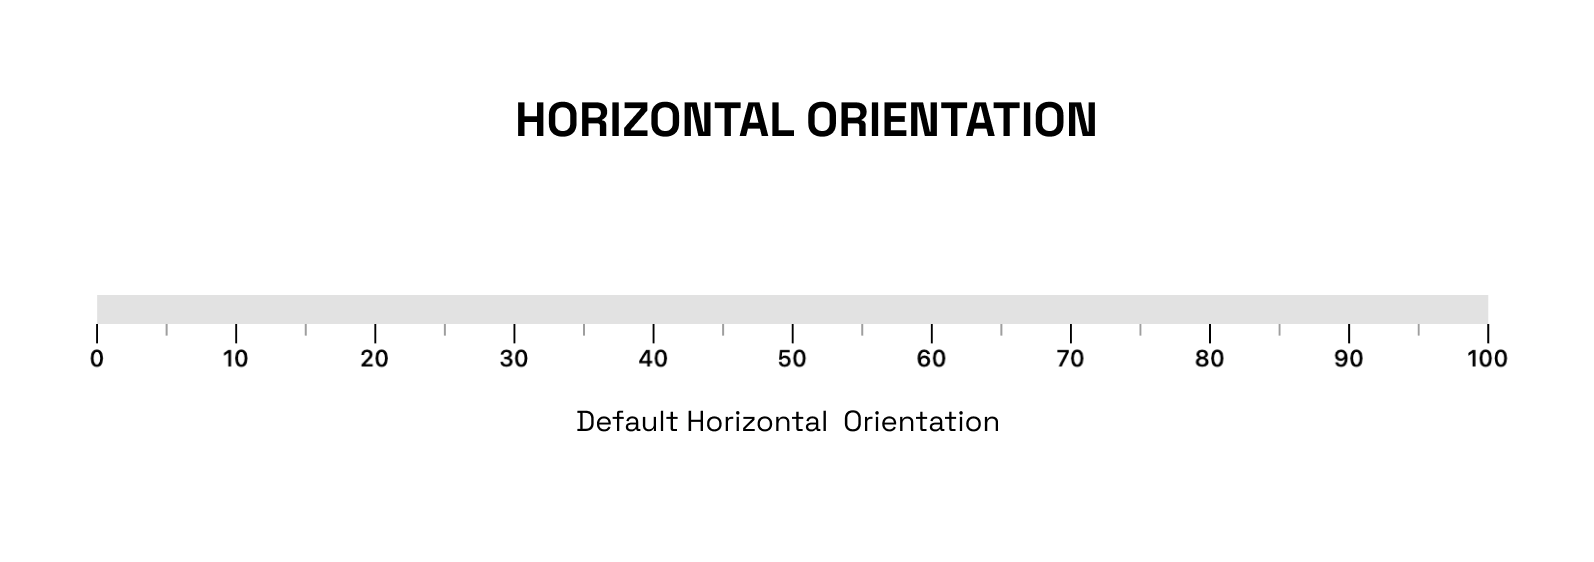
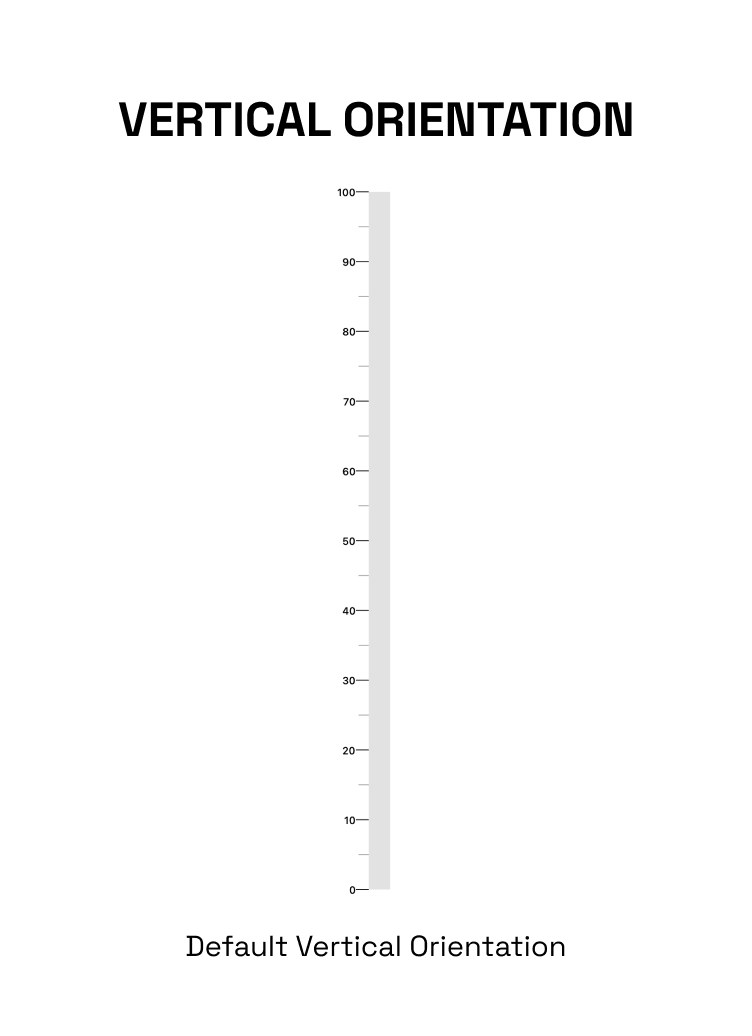
The linearGauge can be oriented vertically or horizontally. The orientation can be set using the Gaugeorientation property in the Linear Gauge. The possible values for the orientation property are:
GaugeOrientation.horizontal: The gauge will be oriented horizontally, with the minimum value on the left and the maximum value on the right.
GaugeOrientation.vertical: The gauge will be oriented vertically, with the minimum value at the bottom and the maximum value at the top.
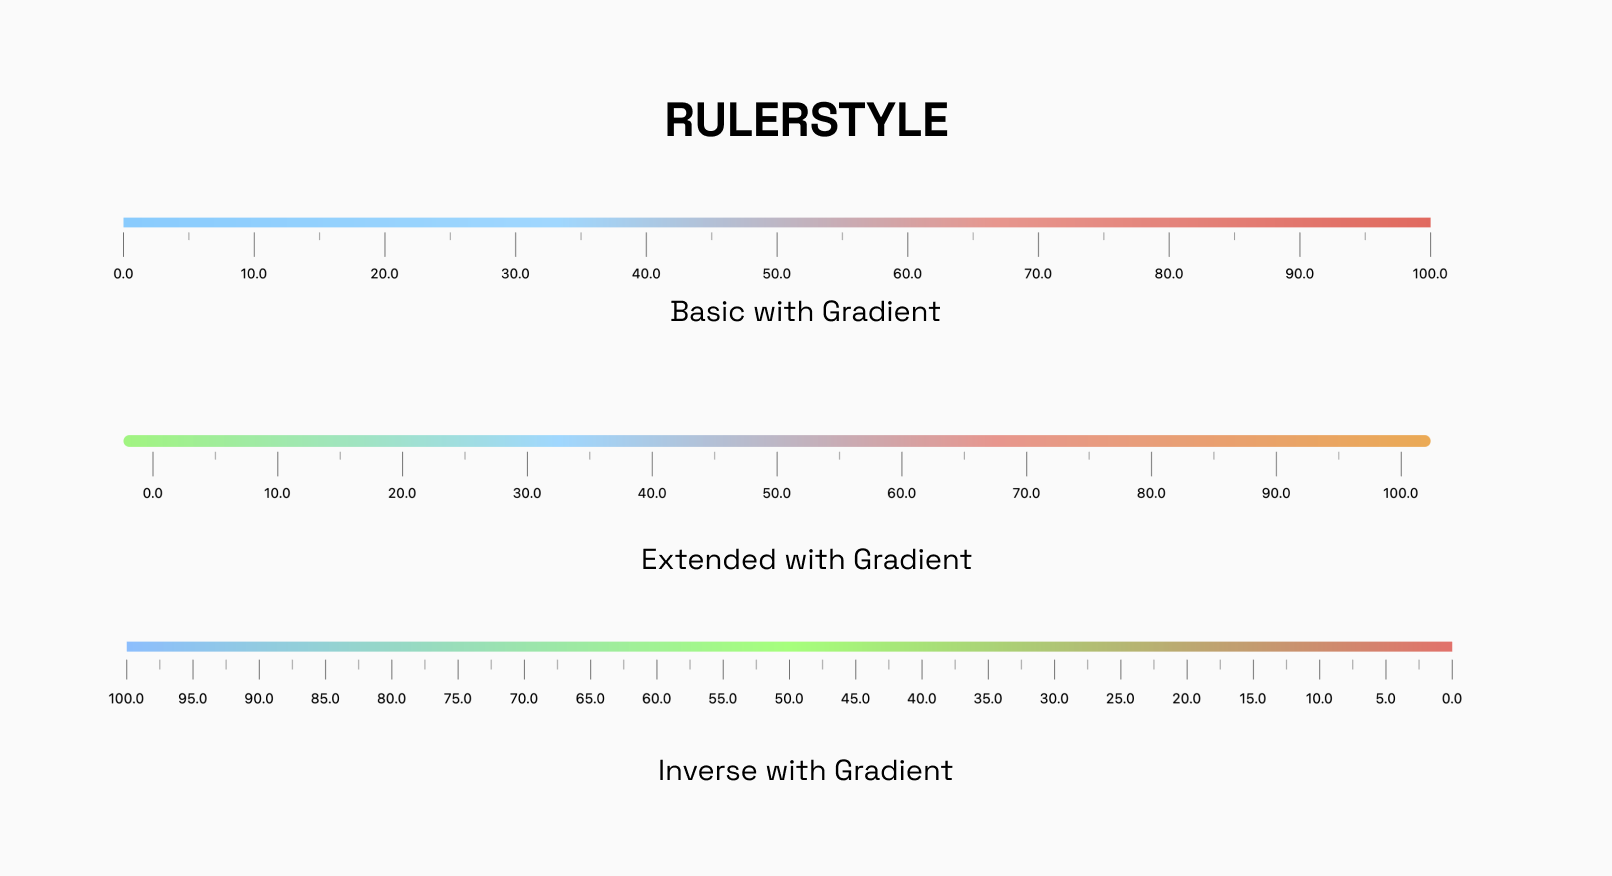
RulerStyle:
The RulerStyle class allows you to customize the appearance of the ruler used in the LinearGauge. With properties such as RulerPosition, showLabel, inverseRuler, and many more, you can customize the ruler in various ways to suit your needs.
Pointer:
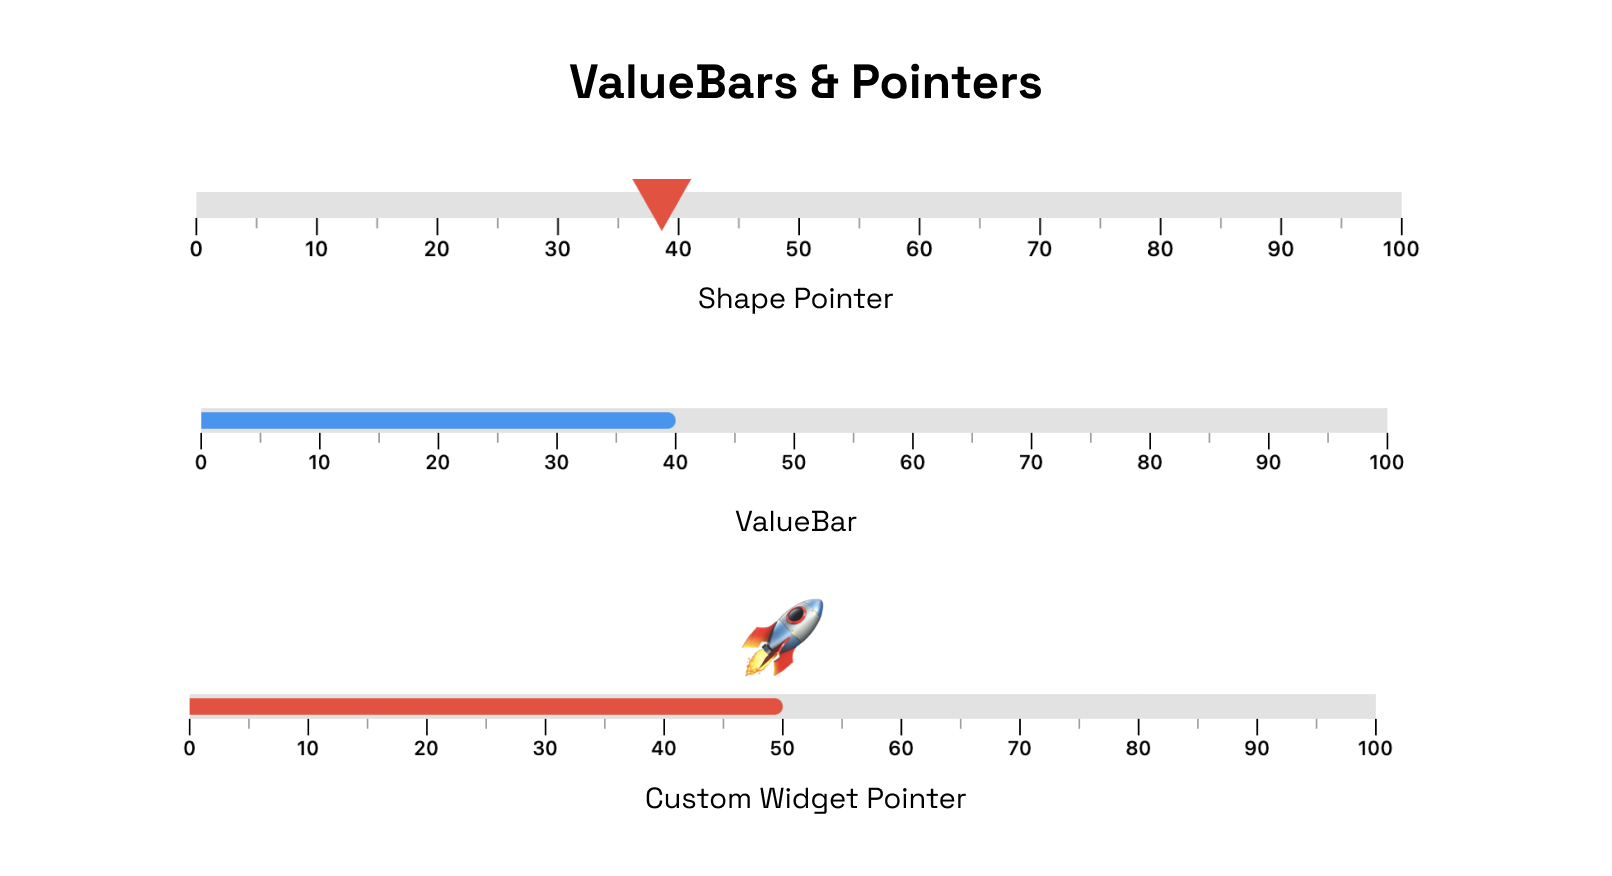
The Pointer is used to indicate a specific value on the gauge. The gauge can have multiple pointers with various shapes and values
ValueBar
The ValueBar in the LinearGauge is the component that displays the actual value of the gauge. It has properties such as color, offset, and thickness that can be customized to fit your needs.
There are different customization options available for pointers and value bar.
RangeLinearGauge
The RangeLinearGauge class enables you to customize the ruler appearance in the LinearGauge. You can display multiple ranges by providing a list of RangeLinearGauge values, and customize the color, start, and end values to match your requirements.
CustomCurve
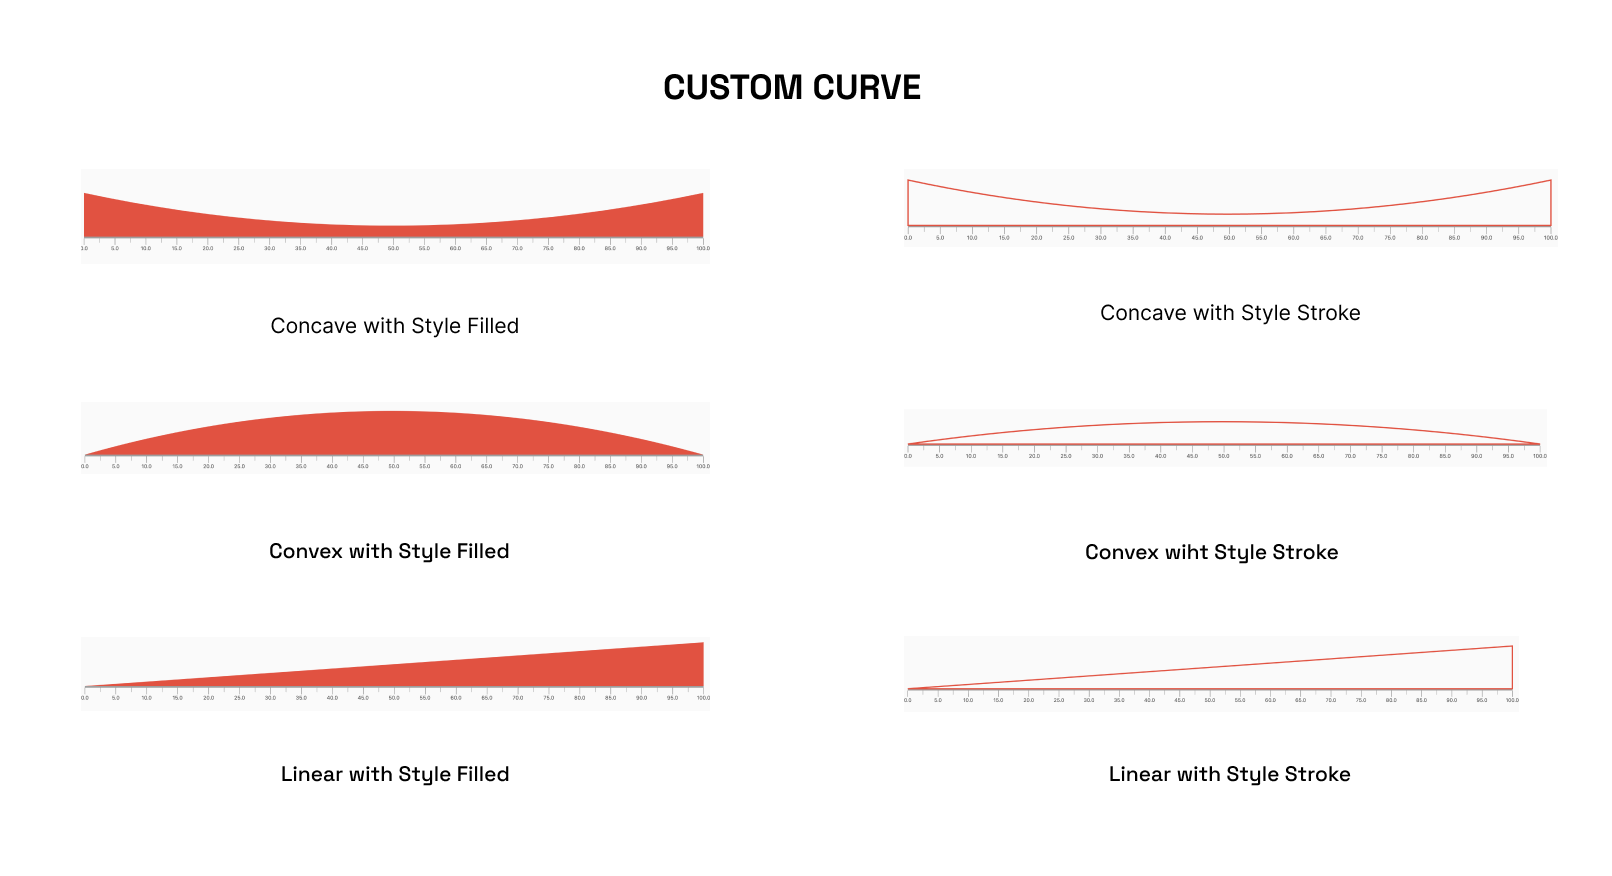
The CustomCurve class allows you to draw Bezier and Straight curves on the LinearGauge, providing a high degree of customization for visualizing data.
Animations
The LinearGauge class includes pre-made animations that can be applied to its pointers, value bars, or the gauge's overall visibility. These animations can help to make the gauge more visually engaging and dynamic.
Interactivity
The Pointer is interactive , it responds to user horizontal & vertical drag.
Radial Gauge
A Radial Gauge is a graphical representation used to visualize and display a value within a circular format. It consists of several components, including a radial track, a needle pointer, and a value bar. The radial track represents the range or scale of values that the gauge can display, with the ability for users to set the start and end points of the track.
Position:
Angles
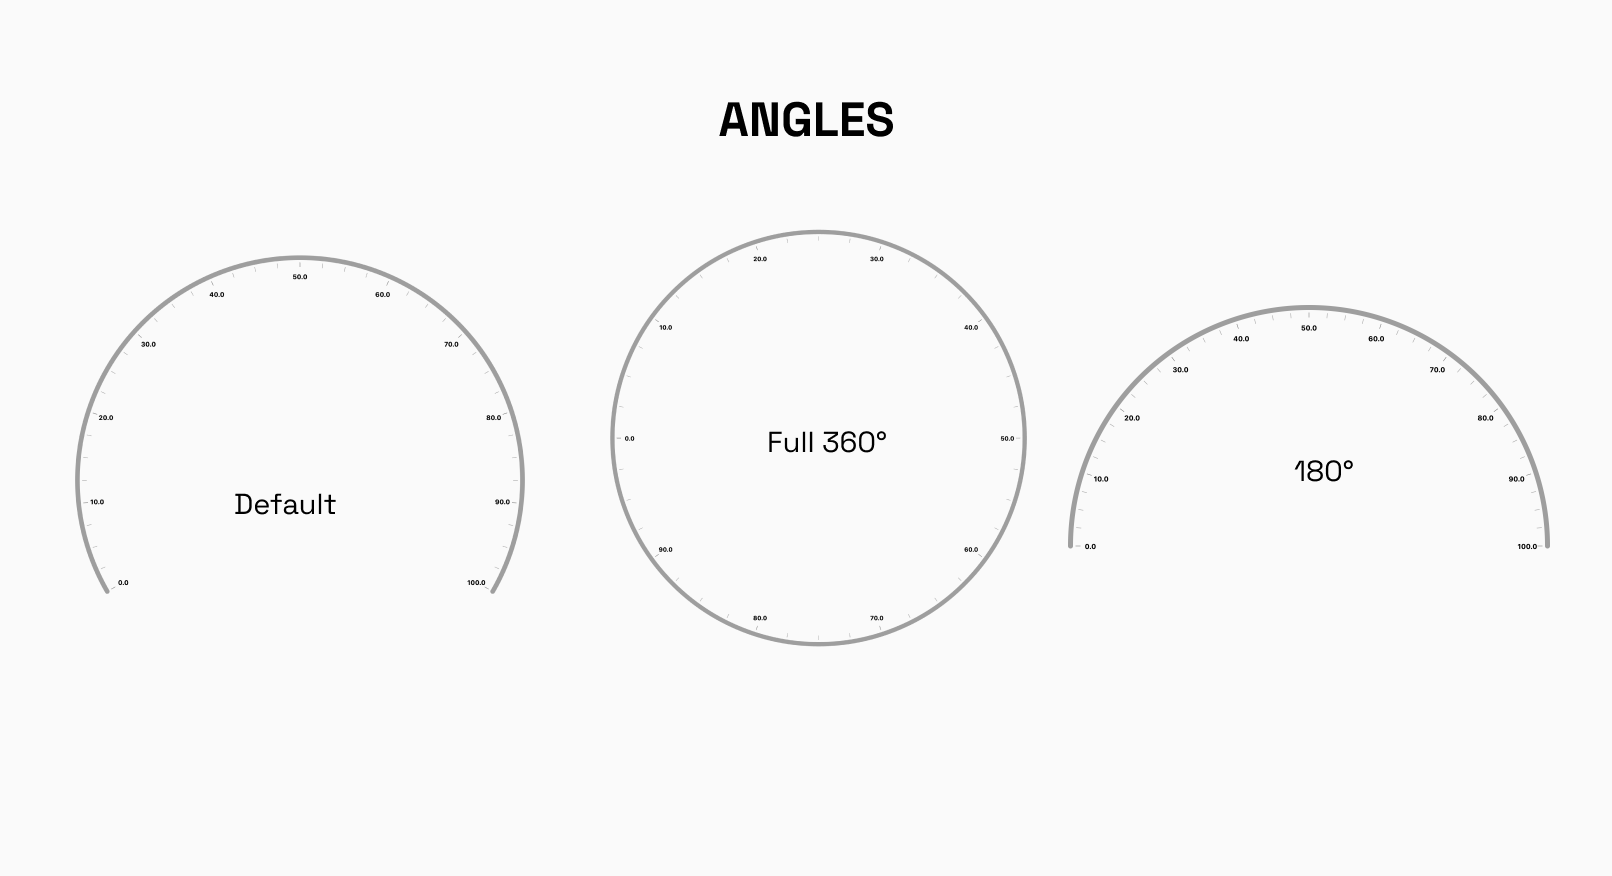
The RadialGauge can be easily laid out at different angles around its center. You have the freedom to specify the starting and ending angles, defining the arc over which the gauge will be displayed. This feature is particularly useful when you want to display multiple gauges side by side or need to emphasize a specific range on the gauge.
Default startAngle : -30°
Default endAngle`: 210°
Custom Track Labels
The labels displayed on the RadialGauge track can easily be formated to your need.
Radii Customization
radiusFactor can be used to size the adjust the scaling factor of the radius and change the radius of the gauge accordingly.
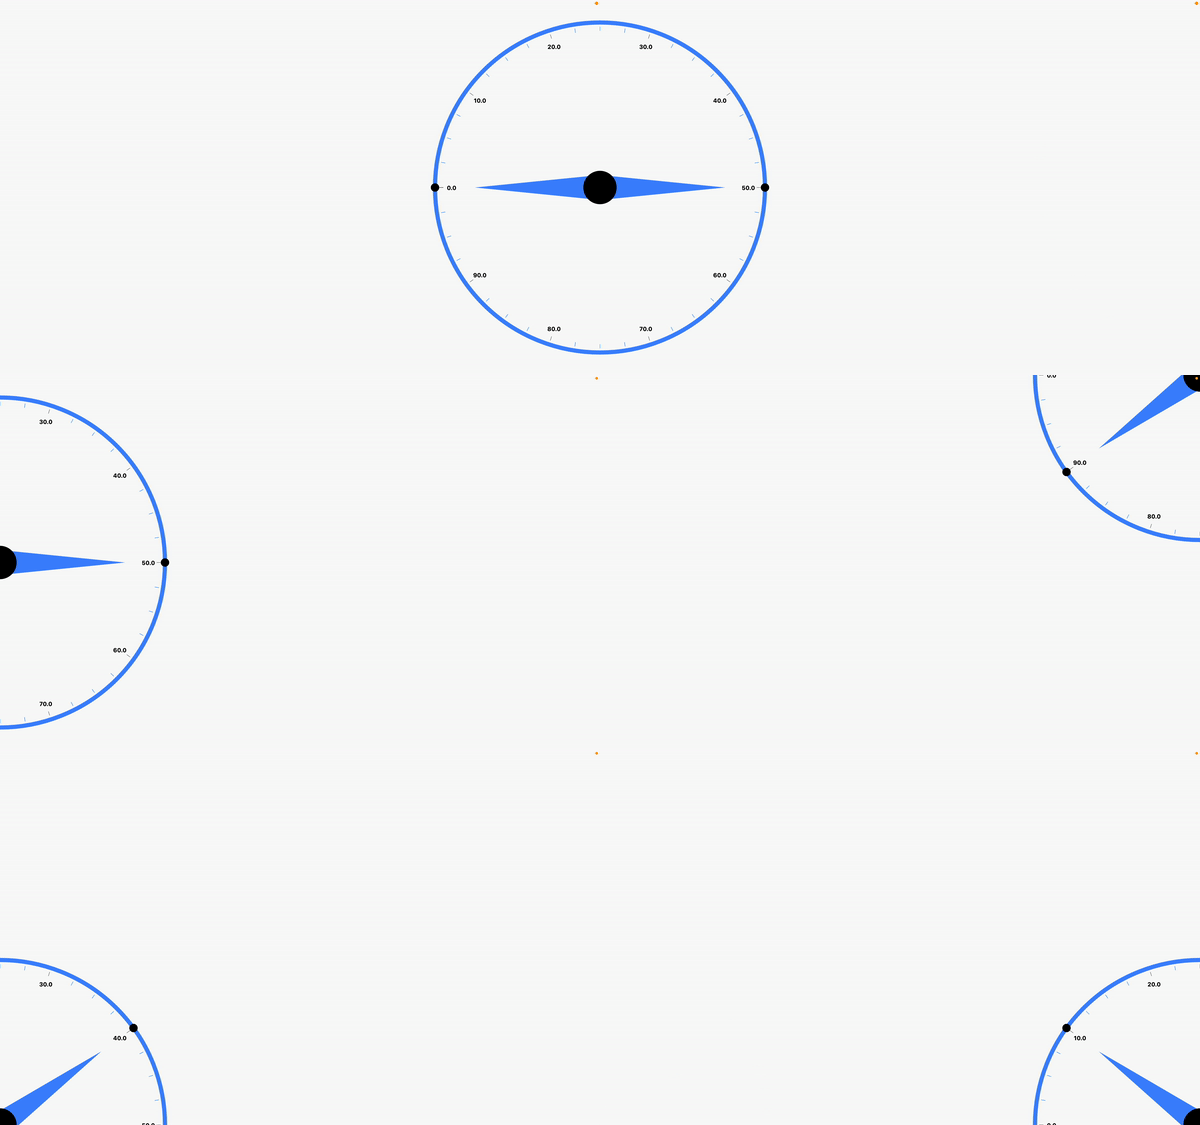
X and Y Coordinates
To precisely position the RadialGauge on your canvas or user interface, you can set the x and y coordinates of its center. This way, you can easily integrate the gauge into your existing layout or place it at specific locations as per your application's design requirements.
By combining these layout options, you can create stunning and interactive radial gauges that effectively present data to your users, whether it's for monitoring, analytics, or any other visualization needs.
Default xCoordinate : 0.5
Default yCoordinate`: 0.5
Needle Pointer
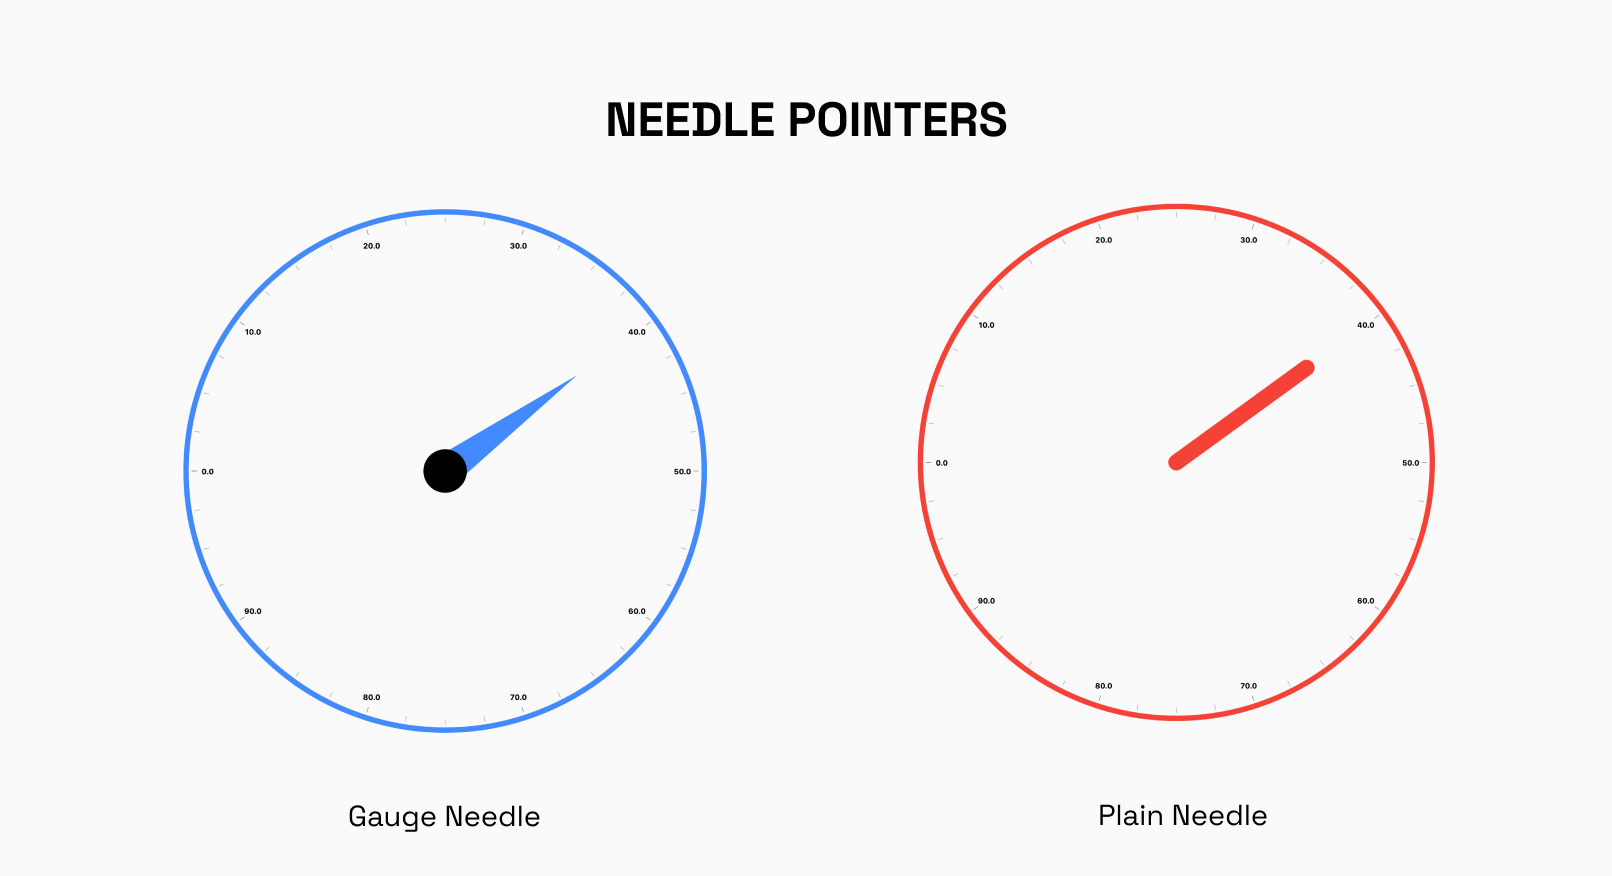
The NeedlePointer is a powerful component that enables you to create and customize Needle Pointers for your gauges. With this widget, you have the flexibility to design multiple Needle Pointers and adjust their styles using the gaugeNeedle and plainneedle enums.
Shape Pointer
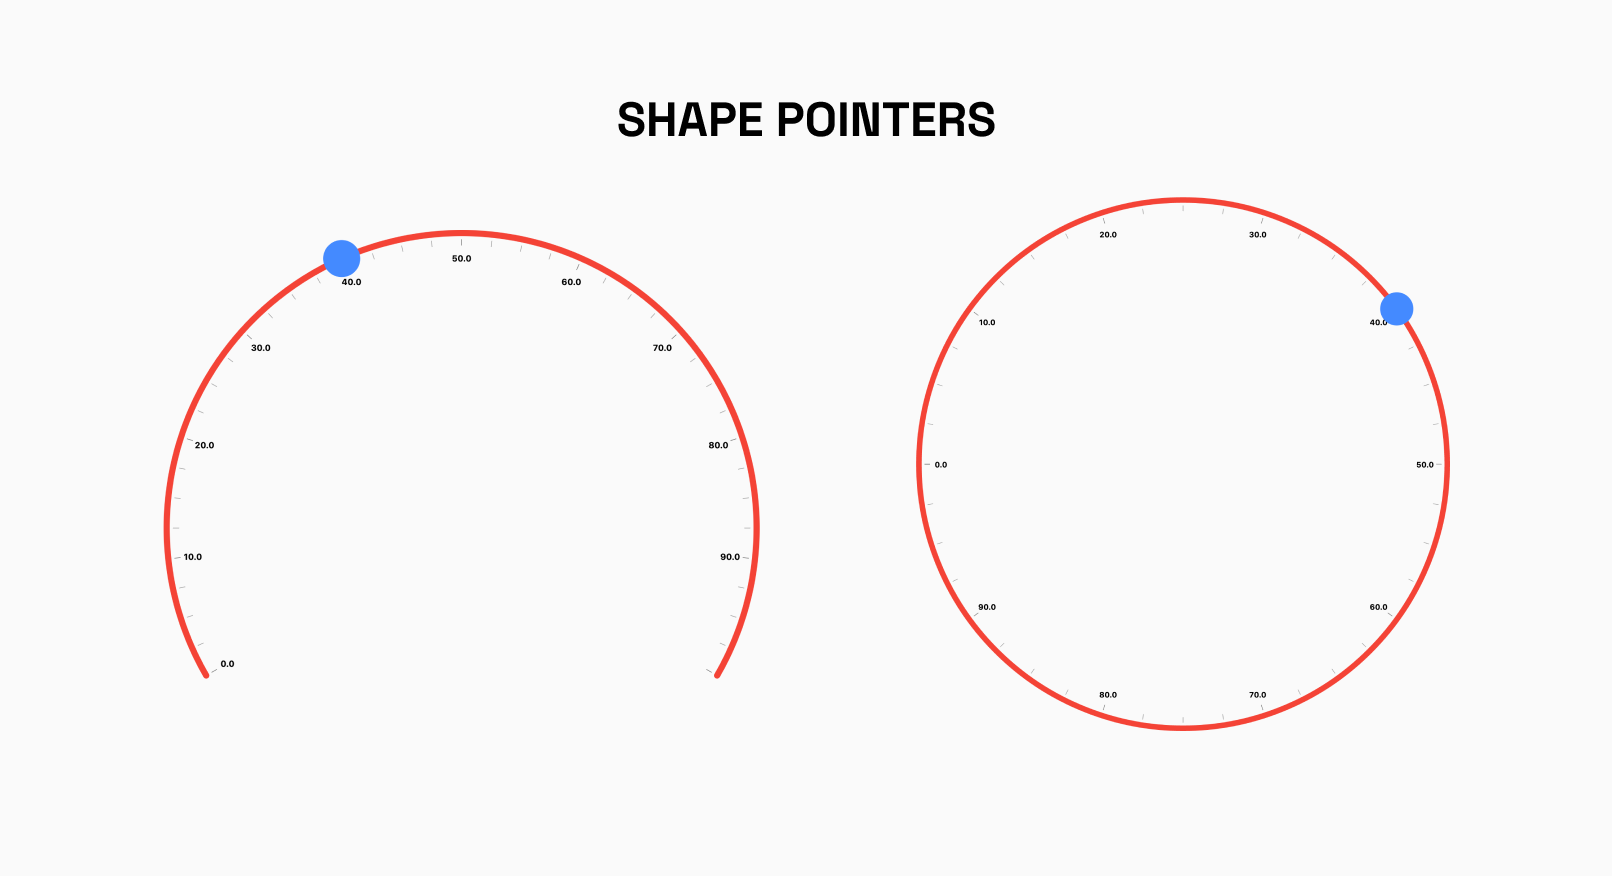
The RadialShapePointer allows you to add Shape Pointer to your Gauge.The shape can be customized using properties such as color, width and height.
Currently, Only Circle Shape is supported
Radial Value Bar
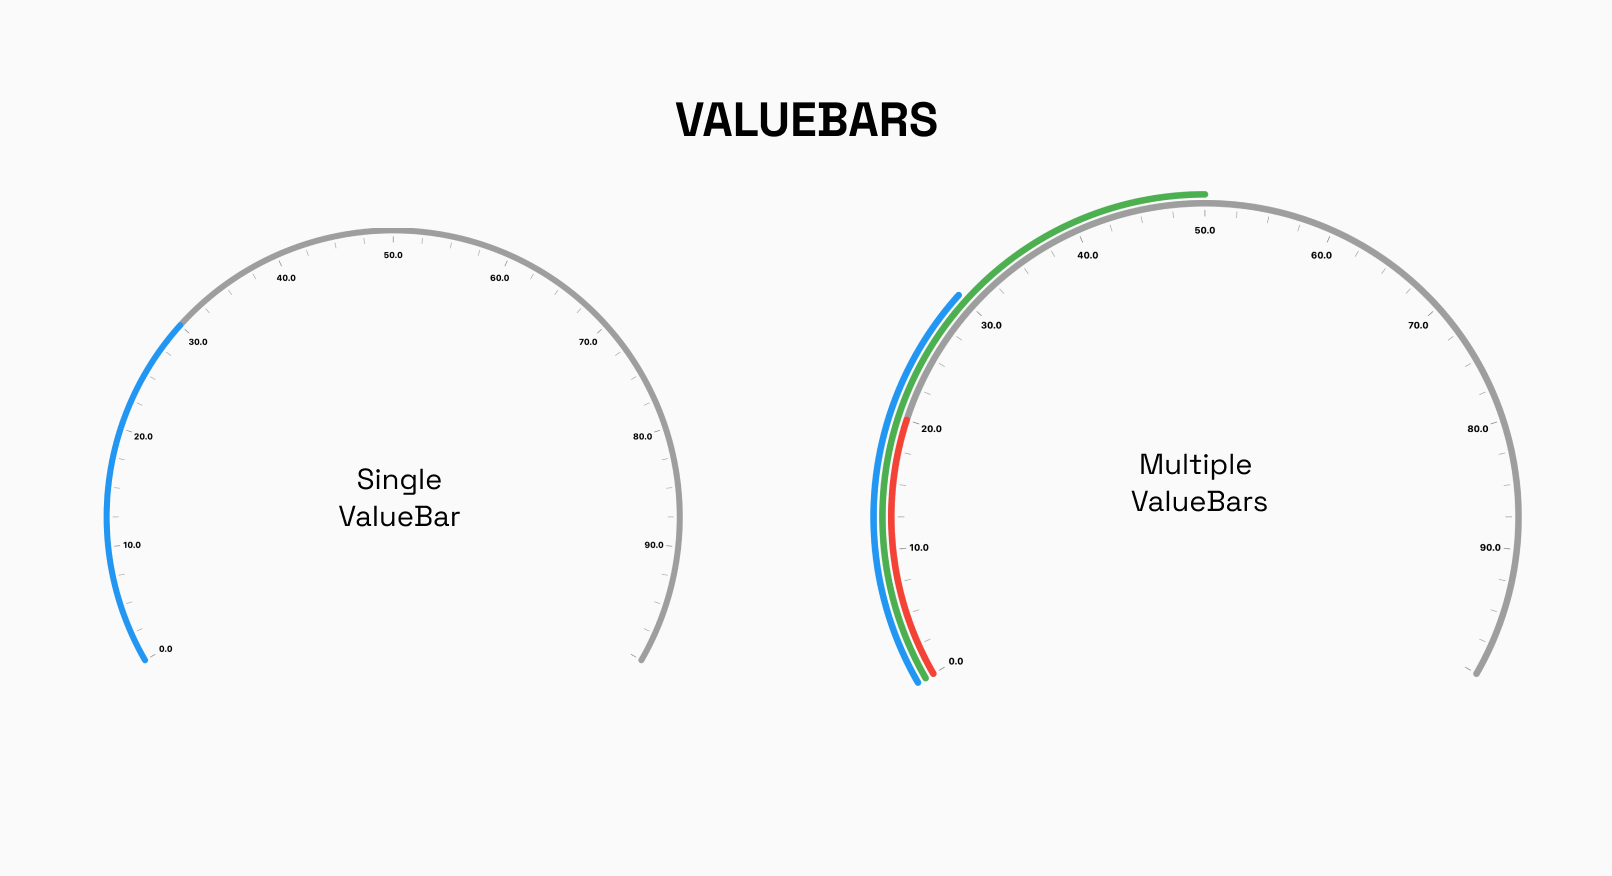
The RadialValueBar is a crucial component used within the RadialGauge to visually represent a specific value on the gauge using a bar. This bar provides users with a clear and intuitive indication of the current value within the defined range of the radial track.
Interactivity Radial
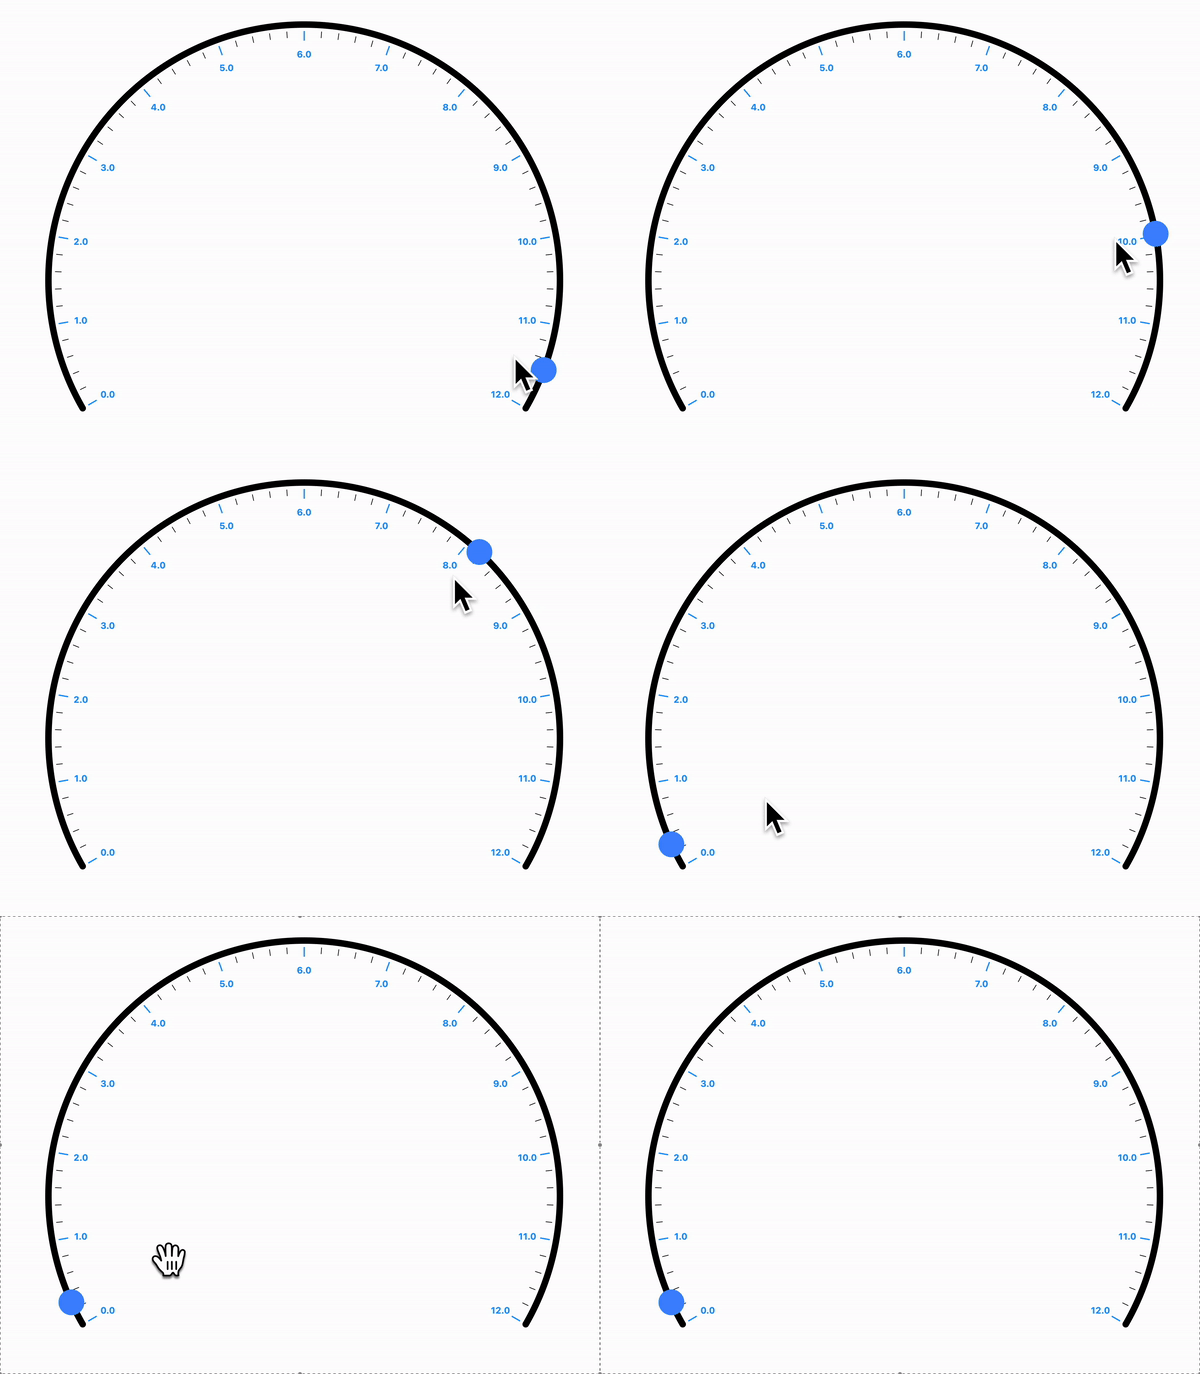
In the Radial Gauge, the NeedlePointer and RadialShapePointer can be set to interactive, making them respond to user's horizontal and vertical drag.