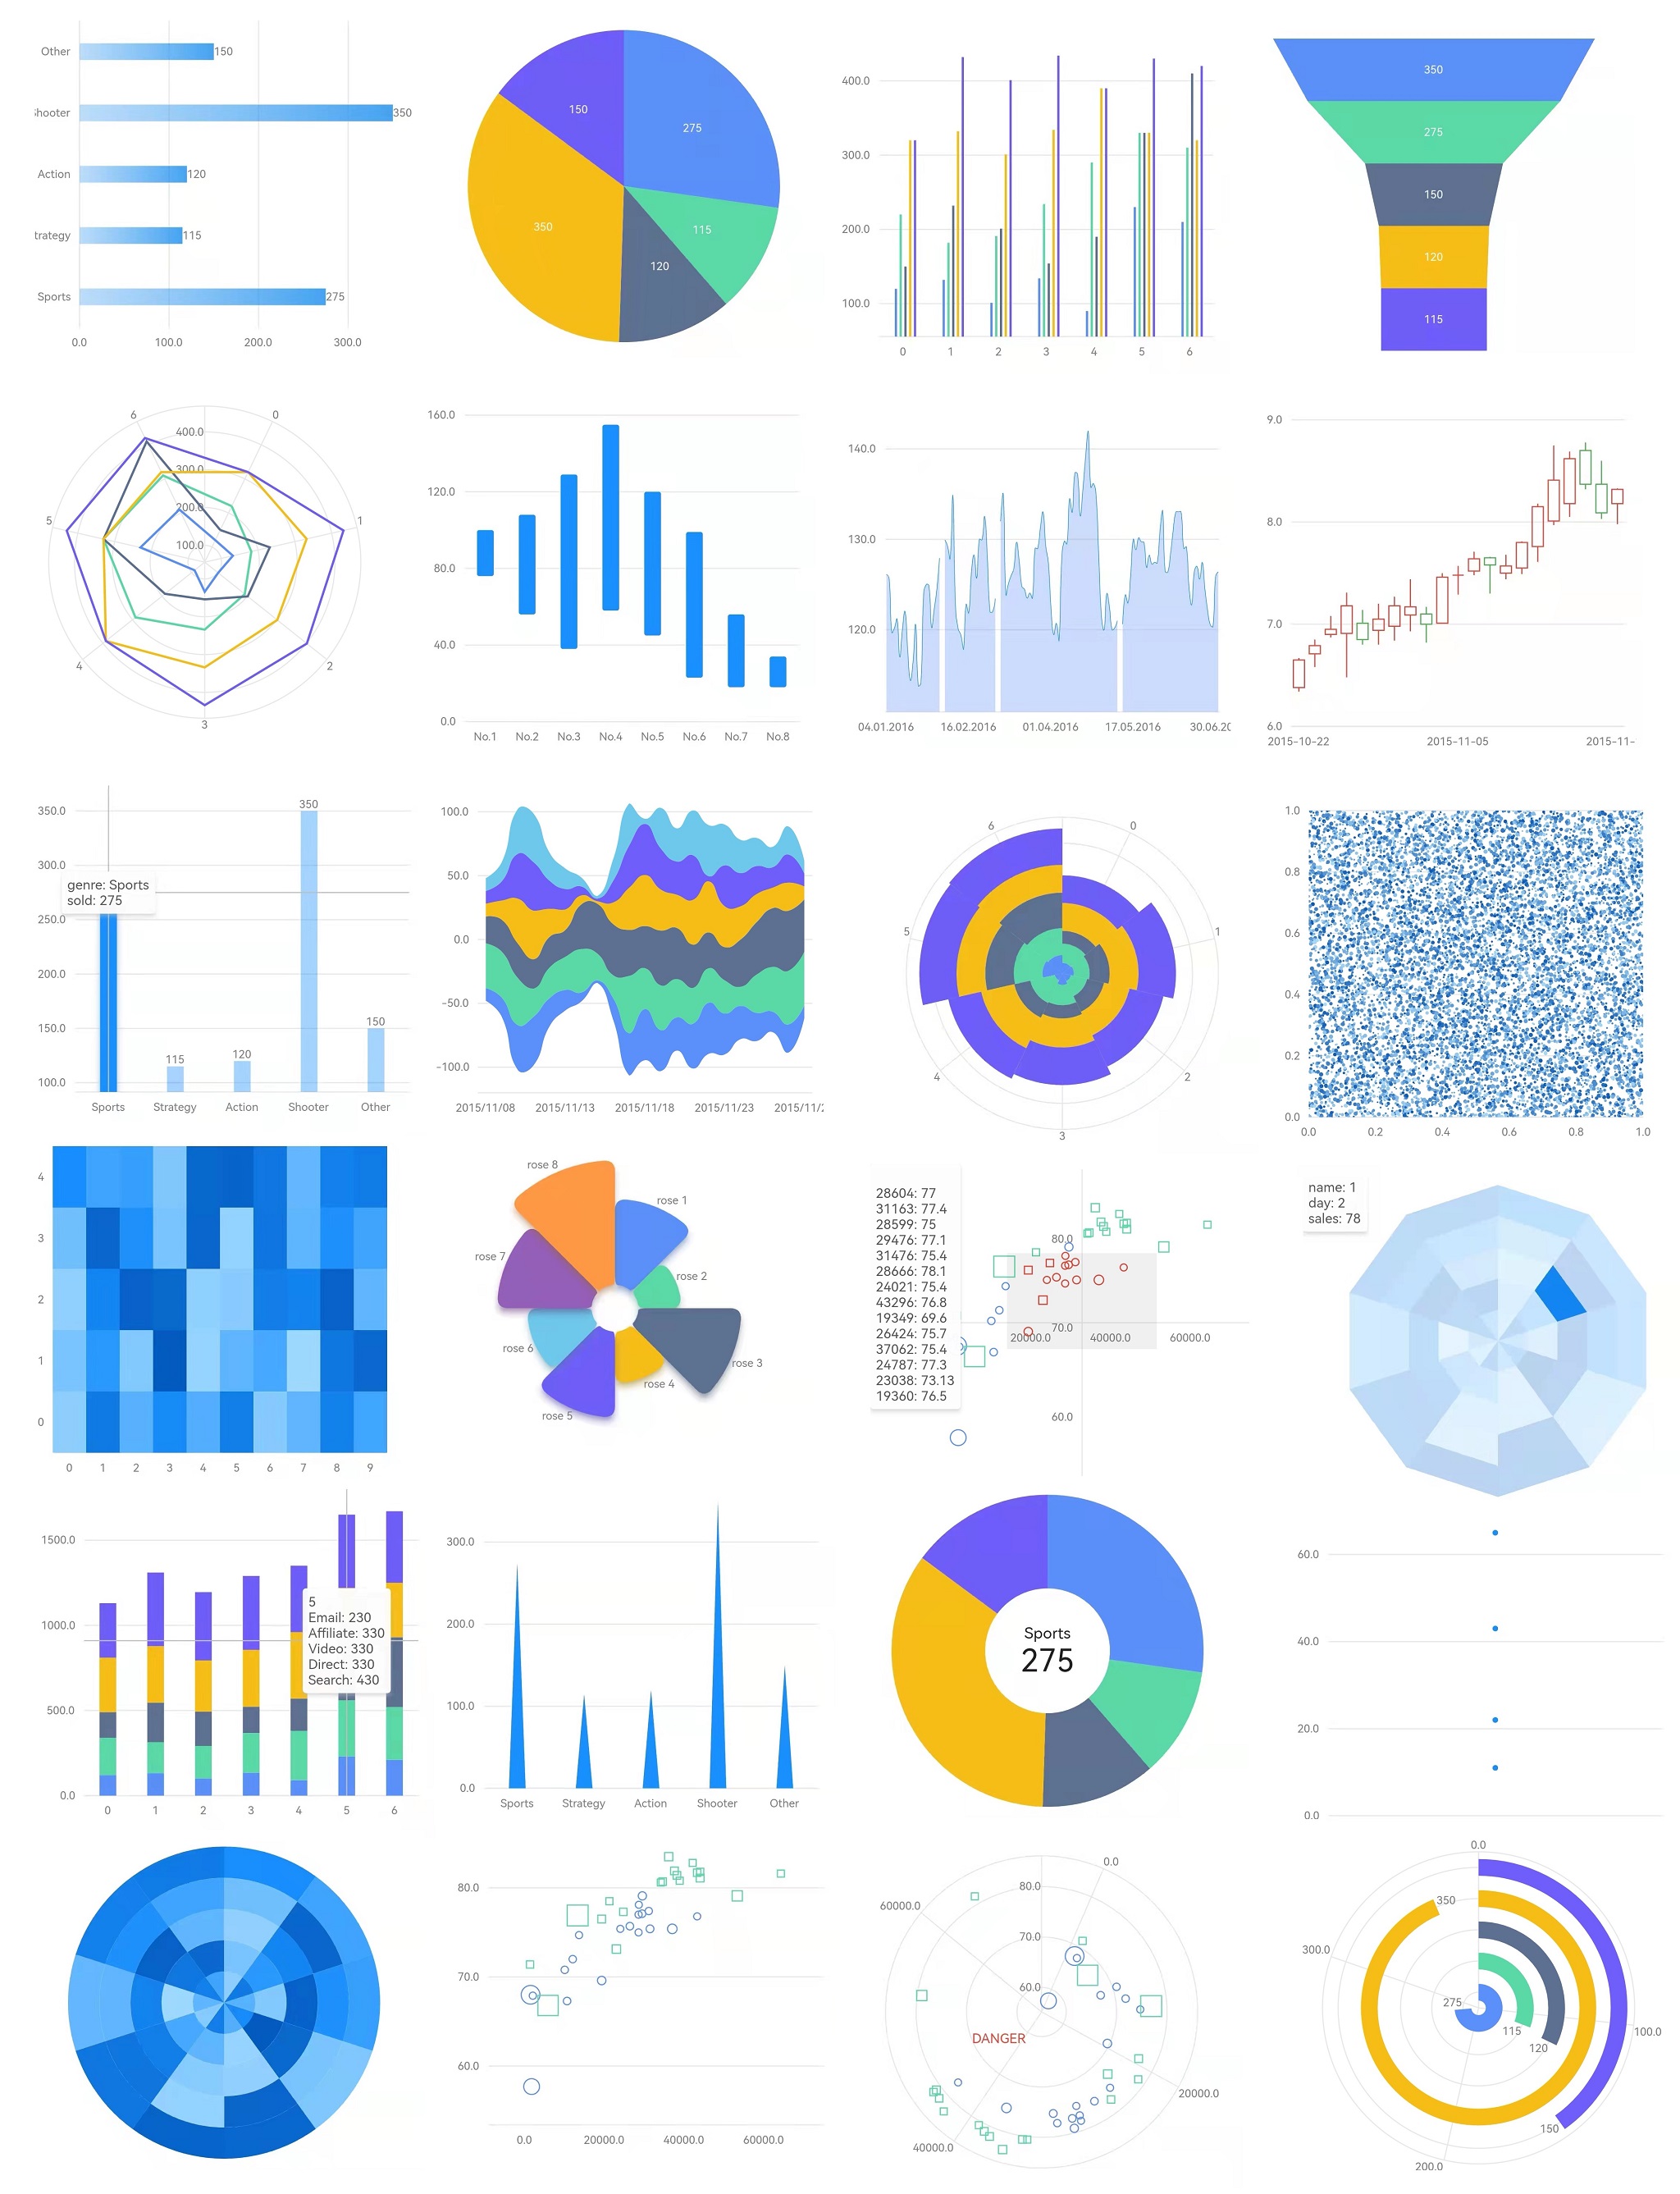
Graphic은 선언적 접근 방식을 통해 표현력 있고 사용자 정의 가능한 차트를 만들 수 있도록 데이터 시각화의 문법을 제공하는 플러터 차트 라이브러리입니다. 유연성과 성능을 위해 설계되었으며, 안드로이드, iOS, 웹, 맥OS, 윈도우, 리눅스 등 다양한 플랫폼을 지원합니다. 구성 가능성과 직관적인 구문에 중점을 두어 간단한 빌딩 블록에서 복잡한 시각화를 쉽게 구축할 수 있습니다. 플러터 앱에 원활하게 통합되며 스타일링 및 상호작용을 위한 광범위한 설정 옵션을 제공합니다.
사용 사례
상호작용형 대시보드 만들기
시계열 데이터 시각화
사용자 정의 데이터 기반 UI 만들기
차트를 사용하여 보고서 생성
실시간 데이터 시각화
주요 기능
선언적 차트 문법
크로스 플랫폼 지원
높은 사용자 정의가 가능한 컴포넌트
내장 애니메이션 지원
확장 가능한 디자인 시스템
적합한 대상
데이터 시각화 개발자
Flutter 앱 제작자
분석 대시보드 빌더
교육 앱 개발자
데이터와 함께 작업하는 UI 디자이너
고려 사항
데이터 시각화 원칙에 대한 이해가 필요합니다
초보자를 위한 학습 곡선이 더 가파릅니다
성숙한 라이브러리에 비해 문서가 제한적
대규모 데이터 세트에서는 성능이 달라질 수 있습니다
사용자 정의 스타일링을 위해서는 Flutter 위젯 시스템에 익숙해야 합니다
원본 README
연결된 소스 저장소의 README 원문 스냅샷입니다. 최신 내용은 저장소에서 확인하세요.
Graphic
Graphic is a grammar of data visualization and Flutter charting library.
Flexible declarative grammar: This visualization grammar derives from Leland Wilkinson's The Grammar of Graphics, and tries to balance between theoretical beauty and practicability. Data processing steps and mark shapes can be composed freely in a declarative specification, not limited to certain chart types. And shape draw methods are customizable.
Interaction: With the event and selection definition, the chart is highly interactive, such as highlighting selected items, popping a tooltip, or scaling the coordinate.
Animation: Mark transition animation can be set when a chart is built or changed. The entrance animation has various forms.
Skill for AI coding
Add the following skill, and your coding agent will be an expert of charting with this library: