패키지, 저장소 및 앱 카테고리 검색

k_chart_plus_deeping 표지
패키지 상세v1.0.2-5.2.2.3

k_chart_plus_deeping

거래 애플리케이션에서 캔들 차트와 딥 차트를 그릴 수 있는 차트 라이브러리. 새로운 기회를 열어둔 경험이 풍부한 소프트웨어 개발자입니다. Telegram @sandaohaizi 로 연락주세요.

AndroidiOSWebmacOSWindowsLinux
30일 다운로드
103
좋아요
120
Pub 점수
140

패키지 설치

flutter pub add k_chart_plus_deeping

패키지 개요

공개 정보를 바탕으로 생성한 선택 가이드입니다.

k_chart_plus_deeping은 거래 애플리케이션에 적합한 캔들스틱 및 딥 차트를 포함하여 고급 금융 차트를 구축하기 위해 설계된 Flutter 패키지입니다. 실시간 데이터 업데이트를 지원하며 부드럽고 사용자 정의 가능한 시각화를 제공합니다. 경험 많은 개발자를 위한 것으로, 다양한 플랫폼에서 거래 또는 금융 중심 앱에 원활하게 통합될 수 있습니다. 이 라이브러리는 오픈소스이며, Telegram을 통해 협업을 환영하는 개발자가 유지 관리하고 있습니다.

사용 사례

  • 거래 플랫폼 인터페이스
  • 암호화폐 거래소 대시보드
  • 실시간 시장 데이터 시각화
  • 재무 분석 도구
  • 포트폴리오 추적 애플리케이션

주요 기능

  • 캔들스틱 차트 렌더링
  • 딥 차트 시각화
  • 크로스 플랫폼 호환성
  • 고성능 렌더링
  • 사용자 정의 가능한 테마 및 스타일
  • 실시간 데이터 스트리밍 지원

적합한 대상

  • 경험 많은 플러터 개발자
  • 금융 및 암호화폐 애플리케이션 개발자
  • 거래소 플랫폼 팀
  • 데이터 시각화 전문가
  • 상호작용 차트가 필요한 앱

고려 사항

  • 금융 차트 개념에 대한 이해가 필요합니다
  • 복잡한 트레이딩 UI에 가장 적합
  • 추가 상태 관리가 필요할 수 있습니다
  • GitHub 저장소 외 문서가 제한적
  • 직접 지원을 위해 텔레그램 연락처가 필요합니다

원본 README

연결된 소스 저장소의 README 원문 스냅샷입니다. 최신 내용은 저장소에서 확인하세요.

K Chart Plus Package Deeping

简体中文 | English

Feature

2024-08-01 Update: Display double volume
2024-07-18 Update: Gesture zoom functionality | Scientific notation support
2024-07-17 Update: EMA indicator added
2024-07-16 Update: Skeleton screen functionality

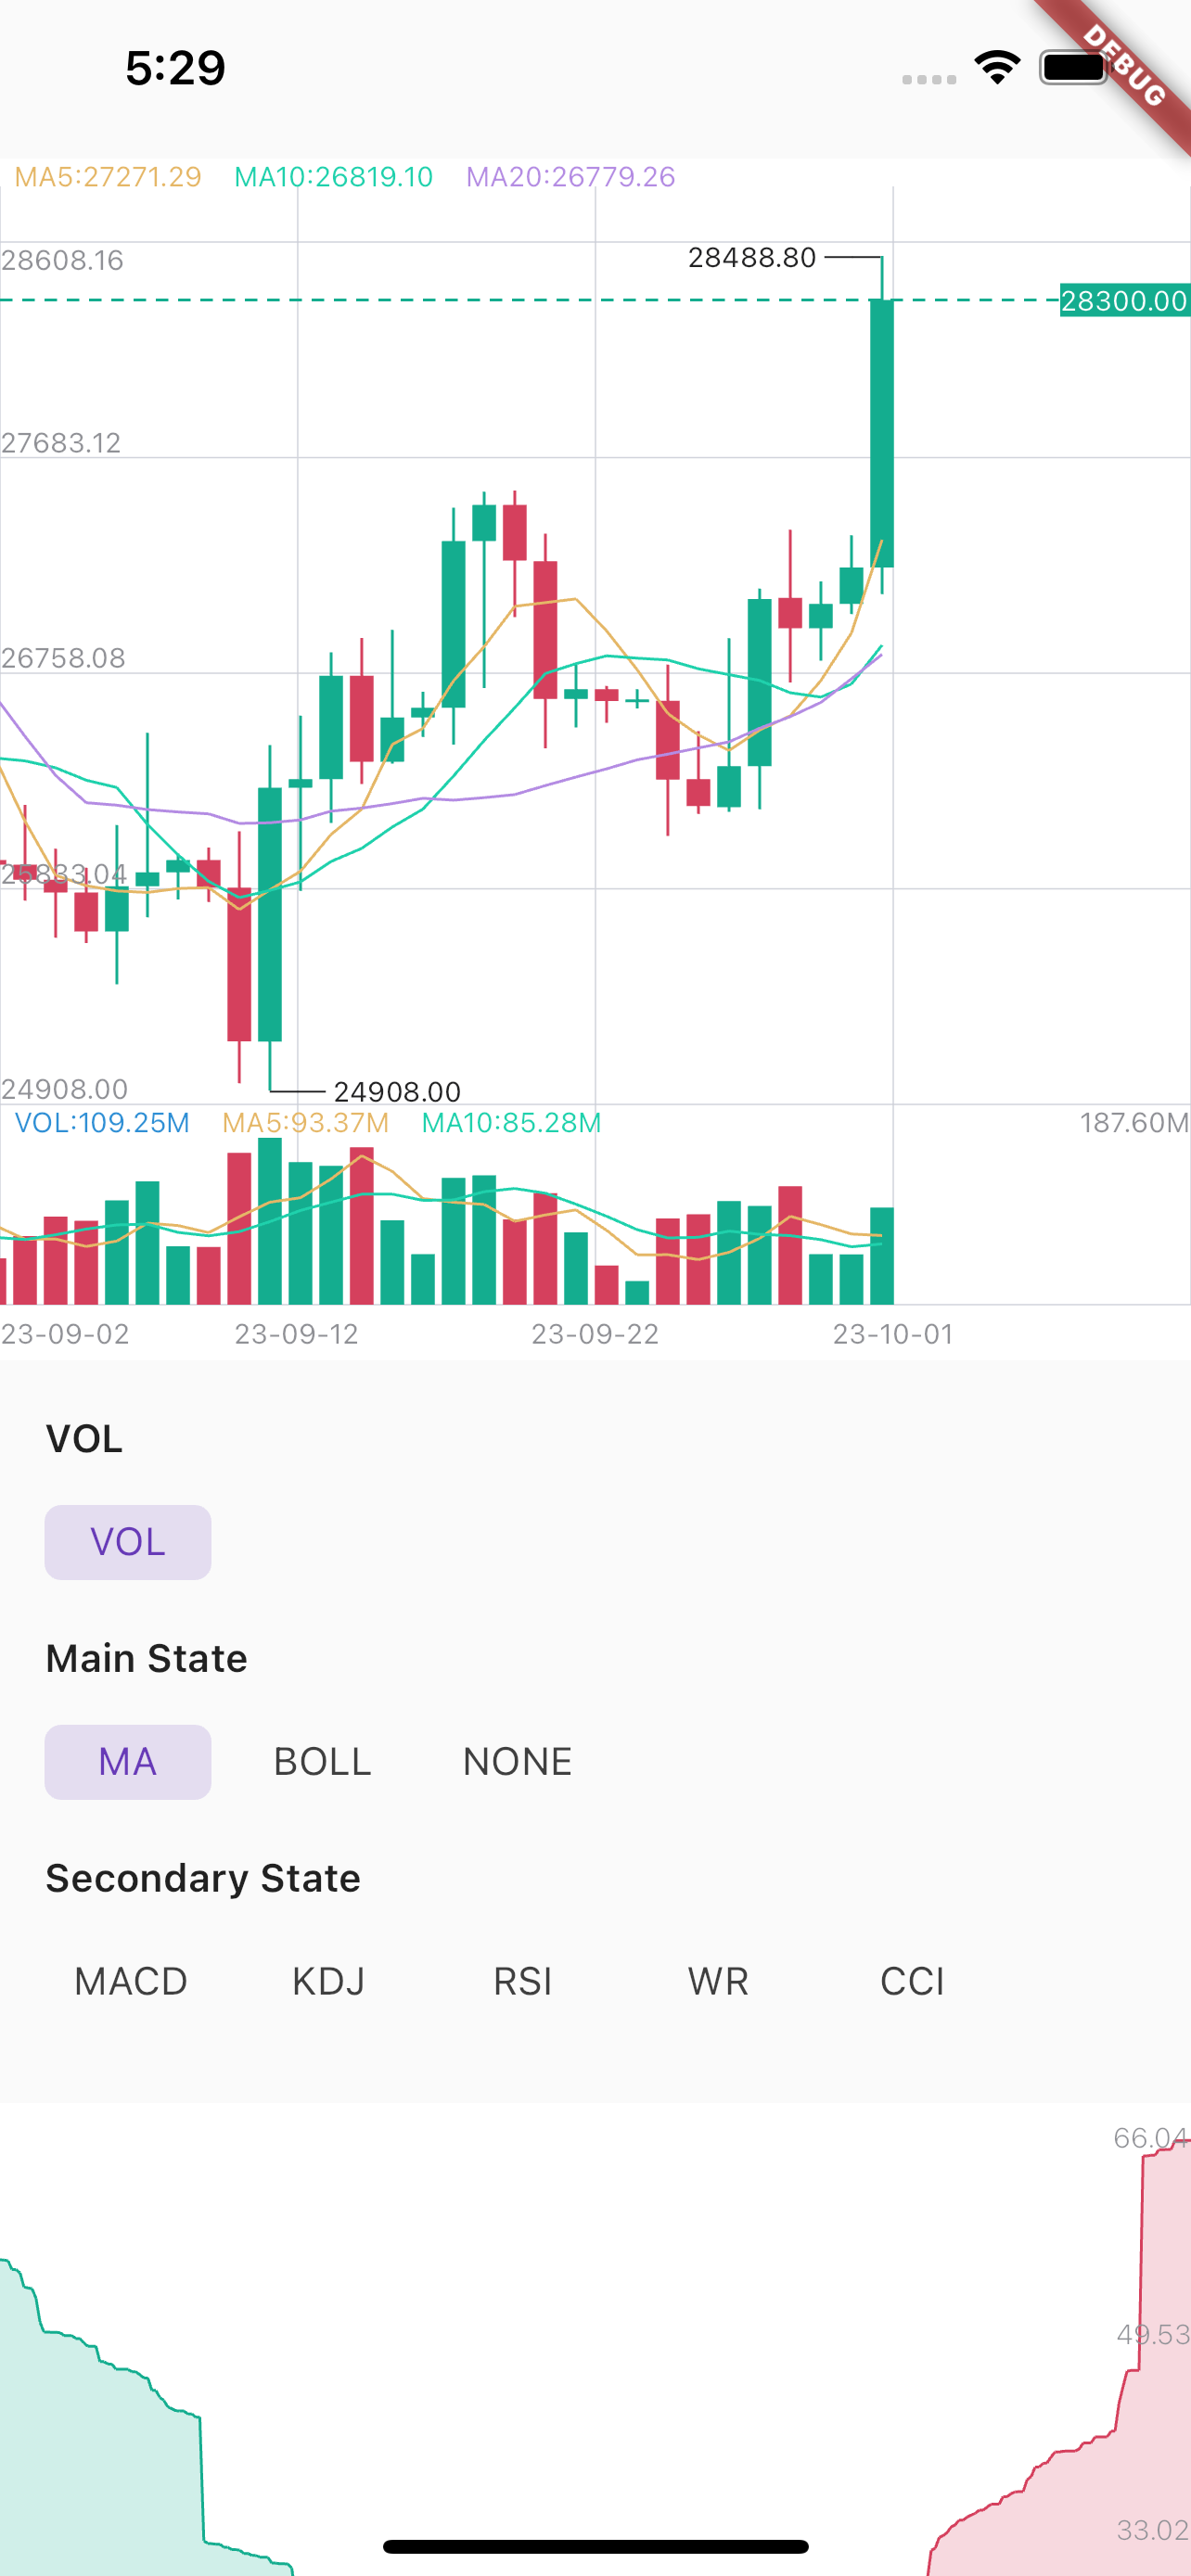
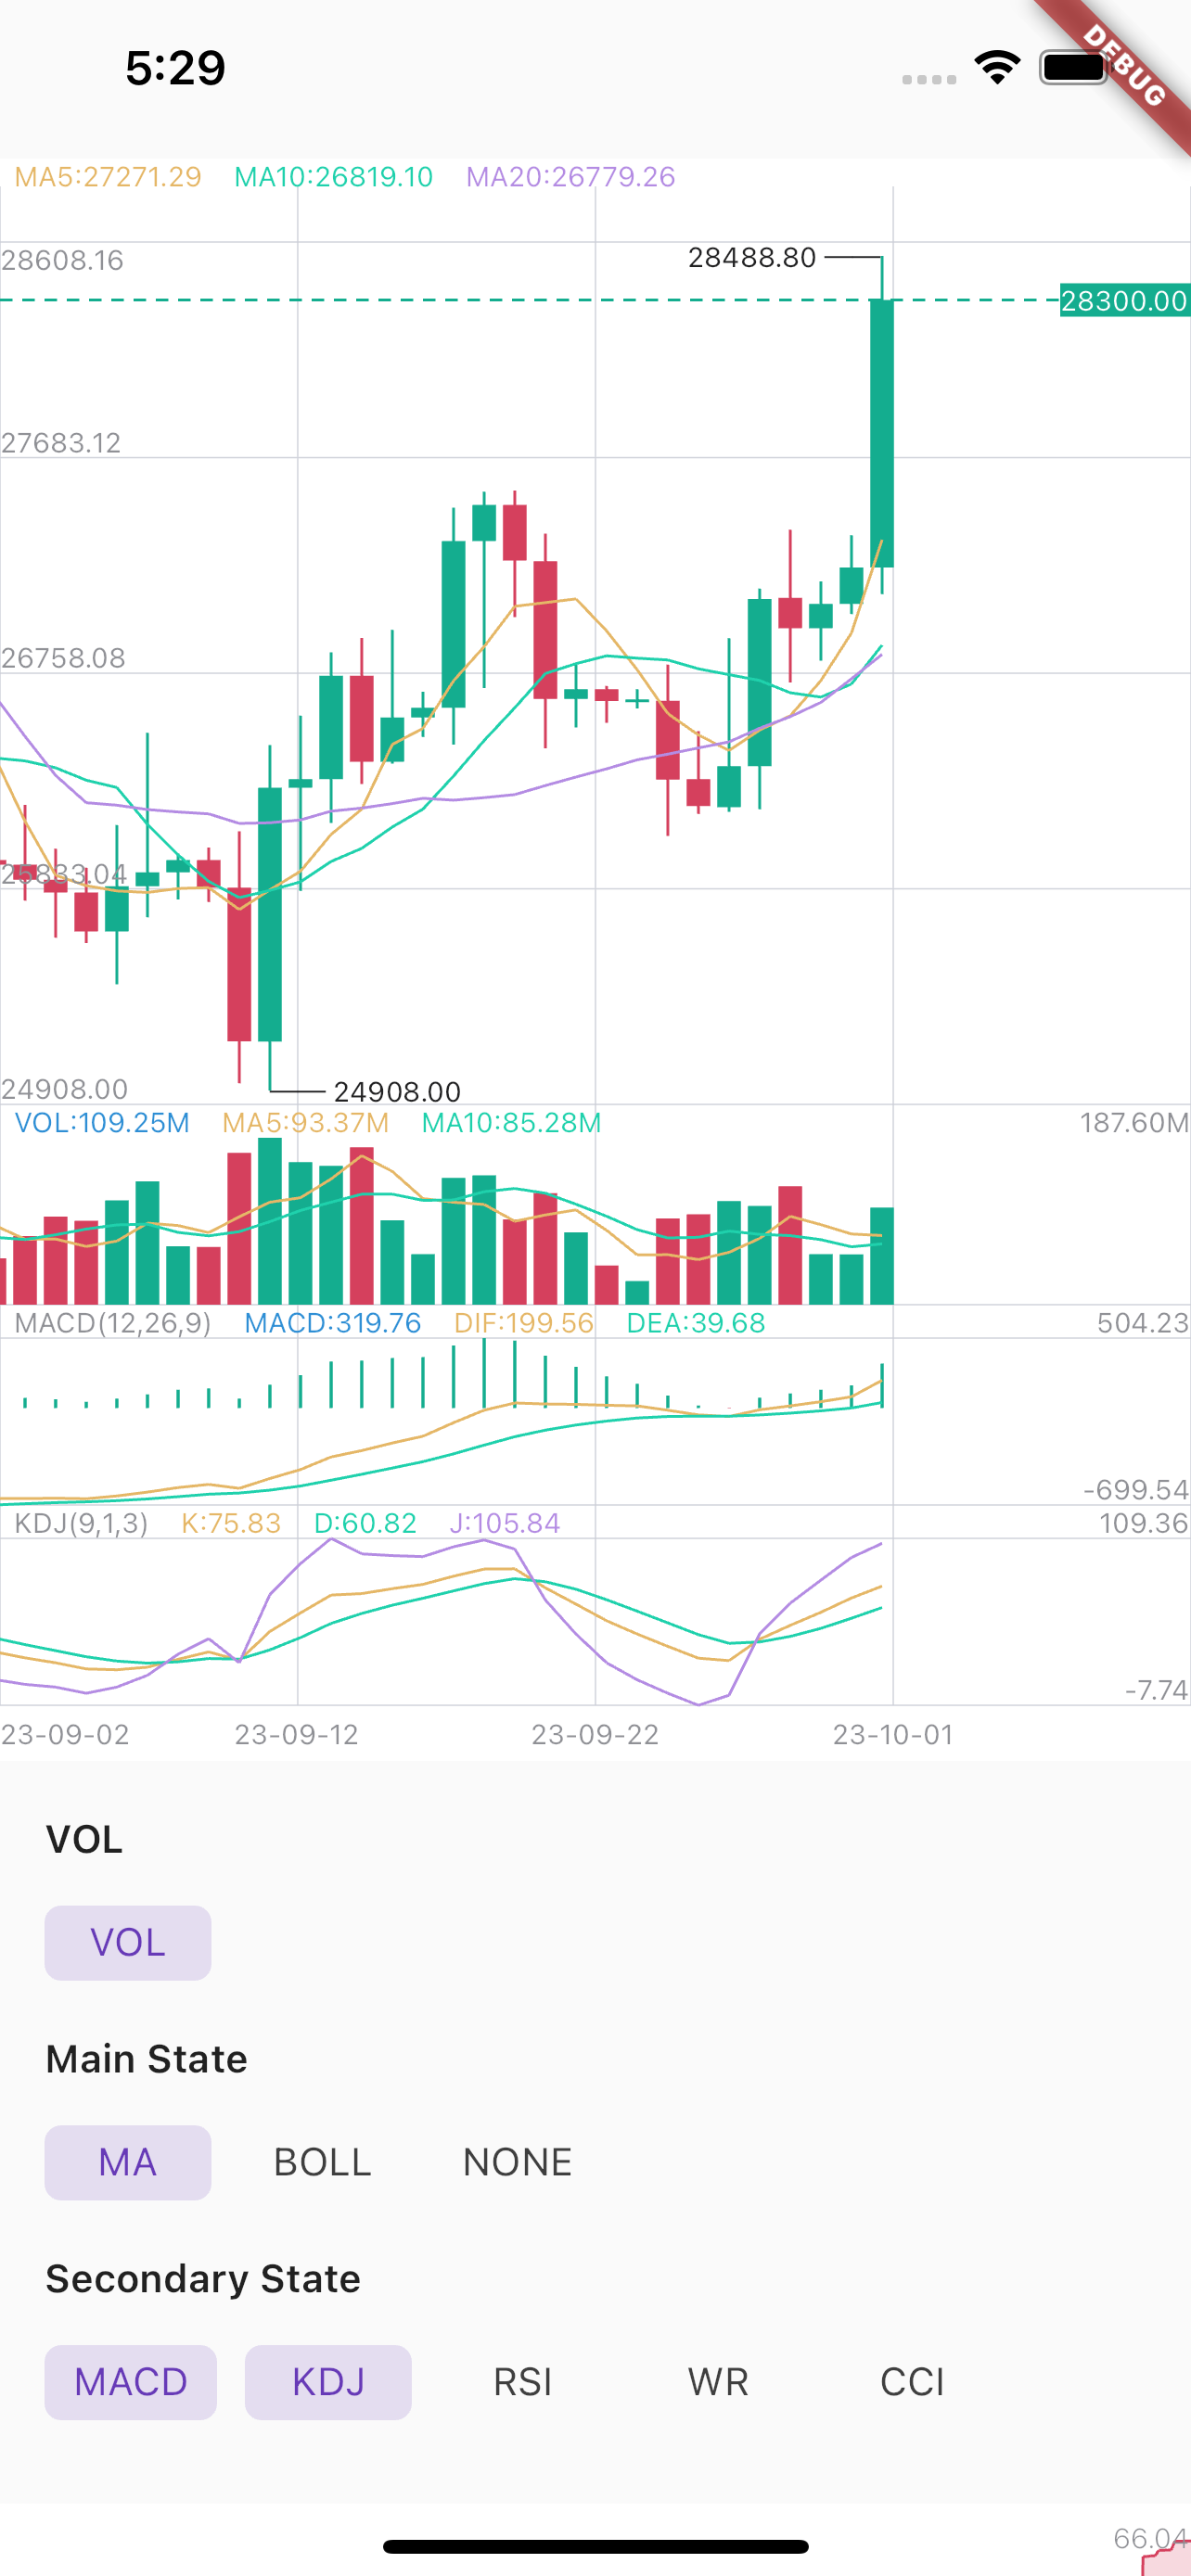
Maybe this is the best k chart in Flutter.Support drag,scale,long press,fling.And easy to use.

Example1 Example2

Installation

First, add k_chart_plus as a dependency in your pubspec.yaml file.

k_chart_plus_deeping: ^1.0.0-tomo+2

If you don't want to support selecting multiple secondary states, you need to use:

flutter_k_chat_plus:
   git:
     url: https://github.com/sawwas/flutter_k_chat_plus
     ref: single #branch name

Usage

When you change the data, you must call this:

DataUtil.calculate(datas); //This function has some optional parameters: n is BOLL N-day closing price. k is BOLL param.
Use K line chart
KChartWidget(
    chartStyle, // Required for styling purposes
    chartColors,// Required for styling purposes
    datas,// Required,Data must be an ordered list,(history=>now)
    mBaseHeight: 360, //height of chart (not contain Vol and Secondary) 
    isLine: isLine,// Decide whether it is k-line or time-sharing
    mainState: _mainState,// Decide what the main view shows
    secondaryStateLi: _secondaryStateLi,// Decide what the sub view shows
    fixedLength: 2,// Displayed decimal precision
    timeFormat: TimeFormat.YEAR_MONTH_DAY,
    onLoadMore: (bool a) {},// Called when the data scrolls to the end. When a is true, it means the user is pulled to the end of the right side of the data. When a
    // is false, it means the user is pulled to the end of the left side of the data.
    maDayList: [5,10,20],// Display of MA,This parameter must be equal to DataUtil.calculate‘s maDayList
    volHidden: false,// hide volume
    showNowPrice: true,// show now price
    isOnDrag: (isDrag){},// true is on Drag.Don't load data while Draging.
    isTrendLine: false, // You can use Trendline by long-pressing and moving your finger after setting true to isTrendLine property. 
    xFrontPadding: 100 // padding in front
),
Use Depth chart
DepthChart(_bids, _asks, chartColors) //Note: Datas must be an ordered list,
Dark | Light Theme

ChartColor helped to set the color for the chart. You need to flexibly change according to your theme configuration to ensure UI.

If you need to apply multi theme, you need to change at least the colors related to the text, border, grid and background color

late ThemeData themeData = Theme.of(context);
late ChartColors chartColors = ChartColors(
  bgColor: themeData.colorScheme.background,
  defaultTextColor: themeData.textTheme.labelMedium?.color ?? Colors.grey,
  gridColor: themeData.dividerColor,
  hCrossColor: themeData.textTheme.bodyMedium?.color ?? Colors.white,
  vCrossColor: themeData.disabledColor.withOpacity(.1),
  crossTextColor: themeData.textTheme.bodyMedium?.color ?? Colors.white,
  selectBorderColor: themeData.textTheme.bodyMedium?.color ?? Colors.black54,
  selectFillColor: themeData.colorScheme.background,
  infoWindowTitleColor: themeData.textTheme.labelMedium?.color ?? Colors.grey,
  infoWindowNormalColor: themeData.textTheme.bodyMedium?.color ?? Colors.white,
);

Apply in k line chart:


KChartWidget(
    data,
    ChartStyle(),
    ChartColors().init(), ///custom chart color
    chartTranslations: ChartTranslations(
        date: 'Date'
        open: 'Open',
        high: 'High',
        low: 'Low',
        close: 'Close'
        changeAmount: 'Change',
        change: 'Change%',
        amount: 'Amount',
        vol: 'Volume',
    ),
    mBaseHeight: 360,
    isTrendLine: false,
    mainState: mainState,
    secondaryStateLi: secondaryStates,
    fixedLength: 2,
    timeFormat: TimeFormat.YEAR_MONTH_DAY,
);
Thanks

TrangLeQuynh/k_chart_plus

gwhcn/flutter_k_chart

OpenFlutter/k_chart

카테고리

의존성

의존성 목록 3 개

소스 저장소

이 패키지를 사용하는 프로젝트

아직 데이터가 없습니다.