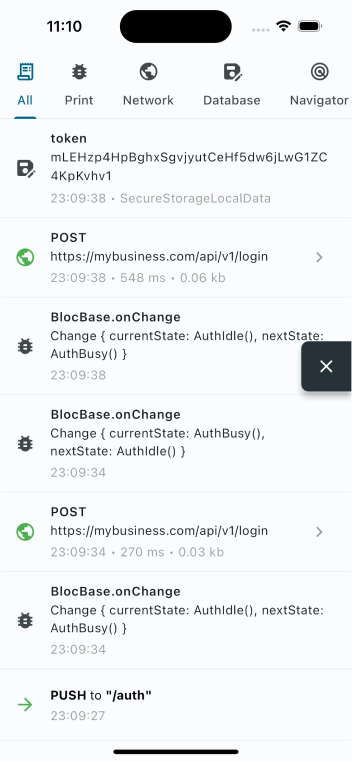
Logarte는 Flutter 애플리케이션을 위한 포괄적인 내부 디버그 콘솔로, 실시간 로깅, 네트워크 검사, 스토리지 모니터링 및 민감한 데이터를 보호하기 위한 비밀번호 보호 접근 기능을 제공합니다. 개발자를 위해 설계된 이 도구는 Android, iOS, Web, macOS, Windows, Linux 등 다양한 플랫폼에서 개발 및 테스트 중 앱의 동작을 추적할 수 있는 직관적인 인터페이스를 제공합니다. 주요 도구들을 하나의 안전한 인터페이스에 통합함으로써 디버깅 효율성을 높여주며, 터미널 로그에만 의존하지 않고도 문제를 쉽게 진단할 수 있게 해줍니다.
사용 사례
Flutter 앱의 실시간 디버깅
네트워크 요청 및 응답 모니터링
로컬 스토리지 및 공유 설정 검사
비밀번호 보호로 디버그 도구 보안 강화
다양한 플랫폼에서 앱 동작 테스트
주요 기능
풍부한 UI를 갖춘 앱 내 디버그 콘솔
네트워크 요청 인스펙터
로컬 데이터 저장소 모니터
비밀번호로 보호된 액세스
크로스 플랫폼 지원 (Android, iOS, Web, macOS, Windows, Linux)
적합한 대상
활발한 개발 중인 플러터 개발자
안전한 디버그 액세스가 필요한 팀
세부적인 런타임 진단이 필요한 앱
민감한 데이터 처리를 포함하는 프로젝트
복잡한 상태 또는 네트워크 문제 디버깅
고려 사항
생산 릴리스를 위한 것이 아님
디버그 모드에서는 수동 활성화가 필요합니다
앱 크기가 약간 증가할 수 있습니다
비밀번호는 런타임에 설정해야 합니다
개발 및 테스트 환경에 한정
원본 README
연결된 소스 저장소의 README 원문 스냅샷입니다. 최신 내용은 저장소에서 확인하세요.
logarte
In-app debug console and logger for Flutter apps.
📦 Features
🚀 In-app console: Monitor your app inside your app
🔒 Access control: Optional password protection
📡 Network inspector: Track API calls and responses
📁 Storage monitor: Track local storage operations
📤 Copy & export: Share debug logs with your team
📄 Curl command: Copy cURL command for API requests
📱 Screenshots
Console
API Request
Password
🩵 Sponsors
Want to say "thanks"? Check out our sponsors:
🪚 Usage
Add to pubspec.yaml
dependencies:logarte:^0.2.1
Then run flutter pub get.
Initialize
Create a global Logarte instance:
finalLogarte logarte = Logarte(
// Protect with password
password: '1234',
// Skip password in debug mode
ignorePassword: kDebugMode,
// Share network request
onShare: (String content) {
Share.share(content);
},
// To have logs in IDE's debug console (default is false)
disableDebugConsoleLogs: false,
// Add shortcut actions (optional)
onRocketLongPressed: (context) {
// e.g: toggle theme mode
}
onRocketDoubleTapped: (context) {
// e.g: change language
}
);
Enable the debug console
In debug mode
Ideally, you should attach the floating button to the widget tree, then click it to open the debug console. This is the preferred way because you don't know when you'll need it and sometimes you might need to go back and forth many times. So, it's better to have it on the UI always.
This will attach the floating button when in debug mode. Curious how you can access it in production when it's not debug mode? Check below.
In production
Logarte is as valuable in production mode as it is in debug mode. Whenever you find a bug, notice something not working, API requests failing, etc., you should be able to check the console and find why.
Two ways to access in production:
Hidden gesture trigger
LogarteMagicalTap is a widget that attaches the floating button to the UI when tapped 10 times. Wrap any non-tappable widget, keep it secret, and make sure you've set a password while initializing.
LogarteMagicalTap(
  logarte: logarte,
  child: Text('App Version 1.0'),
)
Manual trigger
You might also have creative ideas on when and how to open the console. For example, I used a shake detection plugin and attached the floating button when the device was shaken 3 times consecutively. From my experience, this is extremely valuable. Why? Imagine: you've opened your app, went to deeper screens, and an API call failed. You say 'Thank God I've already integrated logarte. Let's open that console!' But you need to go to the page where you used LogarteMagicalTap, which might be too far or not visible at that stage of the app - maybe you're showing it on the profile page and you are on the login page. So be creative about where to add it and consider using shake detection or anything that would serve you better.
logarte.openConsole(context);
Different from the .attach(context) method, this will directly open the console (password page if set, else the console itself).
While initializing, you can pass a custom tab widget to the Logarte instance. This tab will be shown in the console.
This is useful when you want to add a custom tab to the console, for example, to change the environment, copy device's FCM token, clear local cache, etc.