सार्वजनिक जानकारी से बना चयन मार्गदर्शन। केवल संदर्भ हेतु।
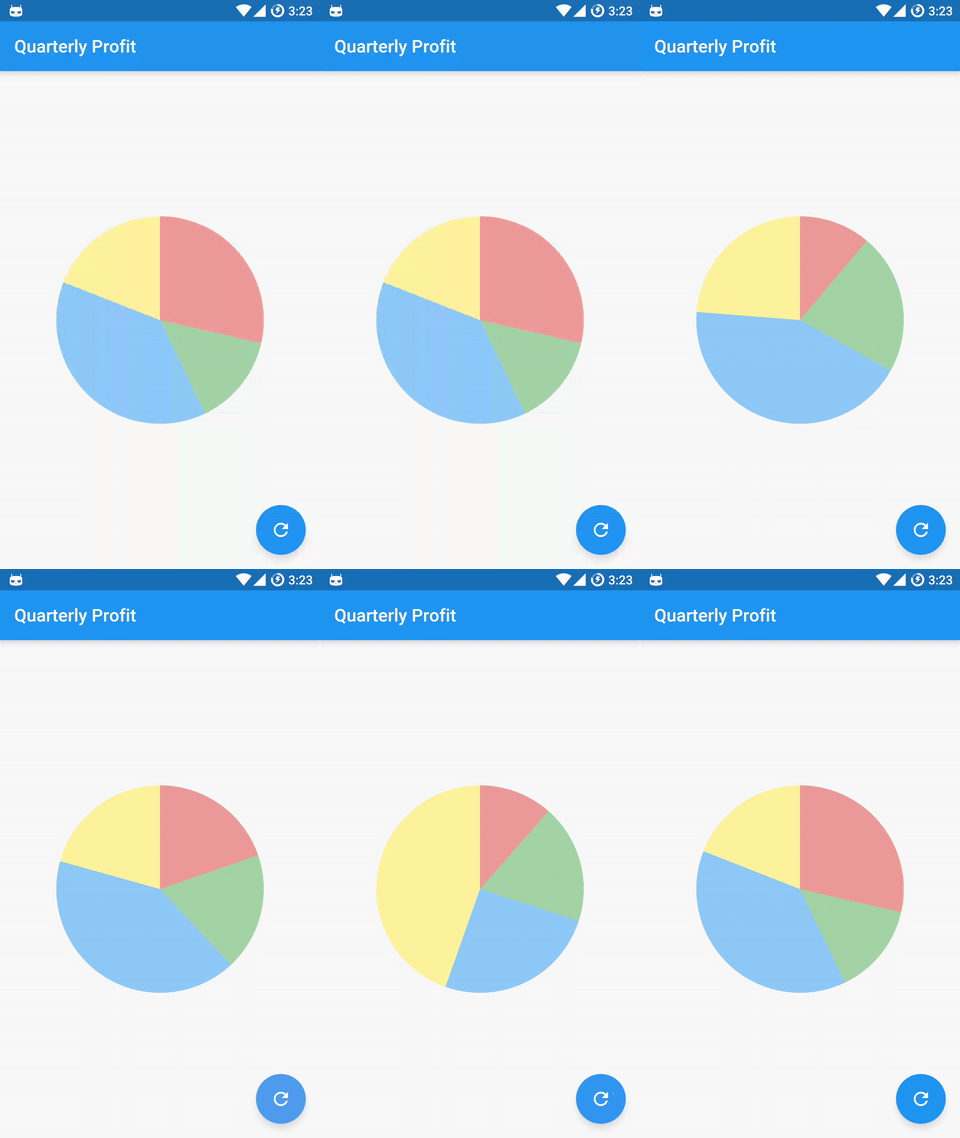
एक एनिमेटेड रेडियल और पाई चार्ट बनाने के लिए फ्लटर पैकेज। यह सुचारू, कस्टमाइज़ करने योग्य विज़ुअलाइज़ेशन प्रदान करता है जो प्रतिशत-आधारित डेटा को संक्षिप्त और दृश्य रूप से आकर्षक ढंग से प्रदर्शित करने के लिए आदर्श है। चार्ट डायनामिक अपडेट्स के समर्थन के साथ डिज़ाइन किए गए हैं और फ्लटर एप्लिकेशन में बिना किसी दिक्कत के एकीकृत होने के लिए डिज़ाइन किए गए हैं। सरल कॉन्फ़िगरेशन विकल्पों के साथ, डेवलपर्स डैशबोर्ड, स्टैटिस्टिक्स या प्रगति सूचकांक के लिए आकर्षक गोलाकार चार्ट आसानी से रेंडर कर सकते हैं।
उपयोग
प्रतिशत डेटा प्रदर्शित करना
डैशबोर्ड विजेट्स बनाएं
प्रगति मापदंडों का दृश्यीकरण
इंटरैक्टिव रिपोर्ट्स बनाना
एनिमेशन के साथ ऐप यूआई में सुधार करना
मुख्य विशेषताएँ
एनिमेटेड ट्रांजिशन
त्रिज्या और पाई चार्ट प्रकार
कस्टमाइज़ किए गए रंग और लेबल
प्रतिक्रियाशील डिज़ाइन
Flutter के साथ आसान एकीकरण
इनके लिए उपयुक्त
डेटा विज़ुअलाइज़ेशन ऐप्स
डैशबोर्ड इंटरफेस
प्रगति ट्रैकिंग सुविधाएँ
शैक्षिक उपकरण
मोबाइल विश्लेषण डैशबोर्ड
विचार योग्य बातें
वृत्त आरेख प्रकार तक सीमित
जटिल लेआउट के लिए न्यूनतम कस्टमाइज़ेशन
कोई बिल्ट-इन टिप्स या इंटरैक्शन नहीं
सरल डेटासेट्स के लिए सबसे उपयुक्त
बड़े डेटा सेट के हैंडलिंग के लिए मैन्युअल हैंडलिंग की आवश्यकता होती है
मूल README
संबंधित सोर्स रिपॉज़िटरी के मूल README का स्नैपशॉट। नवीनतम सामग्री के लिए रिपॉज़िटरी देखें।
Flutter Circular Chart
A library for creating animated circular chart widgets with Flutter, inspired by Zero to One with Flutter.
Overview
Create easily animated pie charts and radial charts by providing them with data objects they can plot into charts and animate between.
Check the examples folder for the source code for the above screenshots.
Charts expect a list of CircularStackEntry objects containing the data they need to be drawn.
Each CircularStackEntry corresponds to a complete circle in the chart. For radial charts that is one of the rings, for pie charts it is the whole pie.
Radial charts with multiple CircularStackEntrys will display them as concentric circles.
Each CircularStackEntry is composed of multiple CircularSegmentEntrys containing the value of a data point. In radial charts a segment corresponds to an arc segment of the current ring, for pie charts it is an individual slice.