सार्वजनिक जानकारी से बना चयन मार्गदर्शन। केवल संदर्भ हेतु।
कस्टमाइज़ेबल, स्क्रॉल करने योग्य स्टैक्ड बार चार्ट बनाने के लिए एक Flutter लाइब्रेरी। विकासकर्ताओं के लिए डिज़ाइन किया गया है जिन्हें लचीले विज़ुअलाइज़ेशन टूल्स की आवश्यकता होती है, यह एंड्रॉइड, आईओएस, वेब, मैकओएस, विंडोज़ और लिनक्स जैसे कई प्लेटफॉर्मों पर डायनामिक डेटा रेंडरिंग सपोर्ट करता है। पैकेज एप्प डिज़ाइन की आवश्यकताओं के अनुरूप चिकनी स्क्रॉलिंग और व्यापक स्टाइलिंग विकल्पों के साथ स्पष्ट डेटा प्रस्तुति की अनुमति देता है। डैशबोर्ड, एनालिटिक्स और रिपोर्टिंग इंटरफ़ेस के लिए आदर्श है जहां परतदार डेटा की तुलना आवश्यक हो।
उपयोग
डेटा डैशबोर्ड
विश्लेषण रिपोर्टिंग
वित्तीय प्रवृत्ति दृश्यकरण
शैक्षिक ऐप्स
इन्वेंटरी ट्रैकिंग
प्रदर्शन निगरानी
मुख्य विशेषताएँ
स्क्रॉल करने योग्य चार्ट
नियंत्रित रंग और शैली
बहु-स्तरीय बार विज़ुअलाइज़ेशन
प्रतिक्रियाशील डिज़ाइन
प्लेटफॉर्म-अनुकूल समर्थन
डायनामिक डेटा अपडेट
इनके लिए उपयुक्त
डेटा-भारी एप्लिकेशन बनाने वाले डेवलपर्स
इंटरैक्टिव चार्ट की आवश्यकता वाले UI डिज़ाइनर
क्रॉस-प्लेटफ़ॉर्म प्रोजेक्ट्स पर काम कर रही टीमें
विश्लेषण-केंद्रित अनुप्रयोग
रियल-टाइम डेटा विज़ुअलाइज़ेशन
विचार योग्य बातें
चार्ट डेटा संरचना के बारे में समझ की आवश्यकता है
जटिल इंटरैक्शन के लिए अतिरिक्त राज्य प्रबंधन की आवश्यकता हो सकती है
बहुत बड़े डेटासेट के साथ प्रदर्शन प्रभाव
सीमित निर्मित-इन सुझाव या टिप्पणियाँ
कस्टम स्टाइलिंग को अतिरिक्त कोड की आवश्यकता हो सकती है
मूल README
संबंधित सोर्स रिपॉज़िटरी के मूल README का स्नैपशॉट। नवीनतम सामग्री के लिए रिपॉज़िटरी देखें।
stacked_bar_chart
A Flutter package for creating different types of charts.This package gives developer the flexibility to customize their graph as well.
Features
Plot graphs
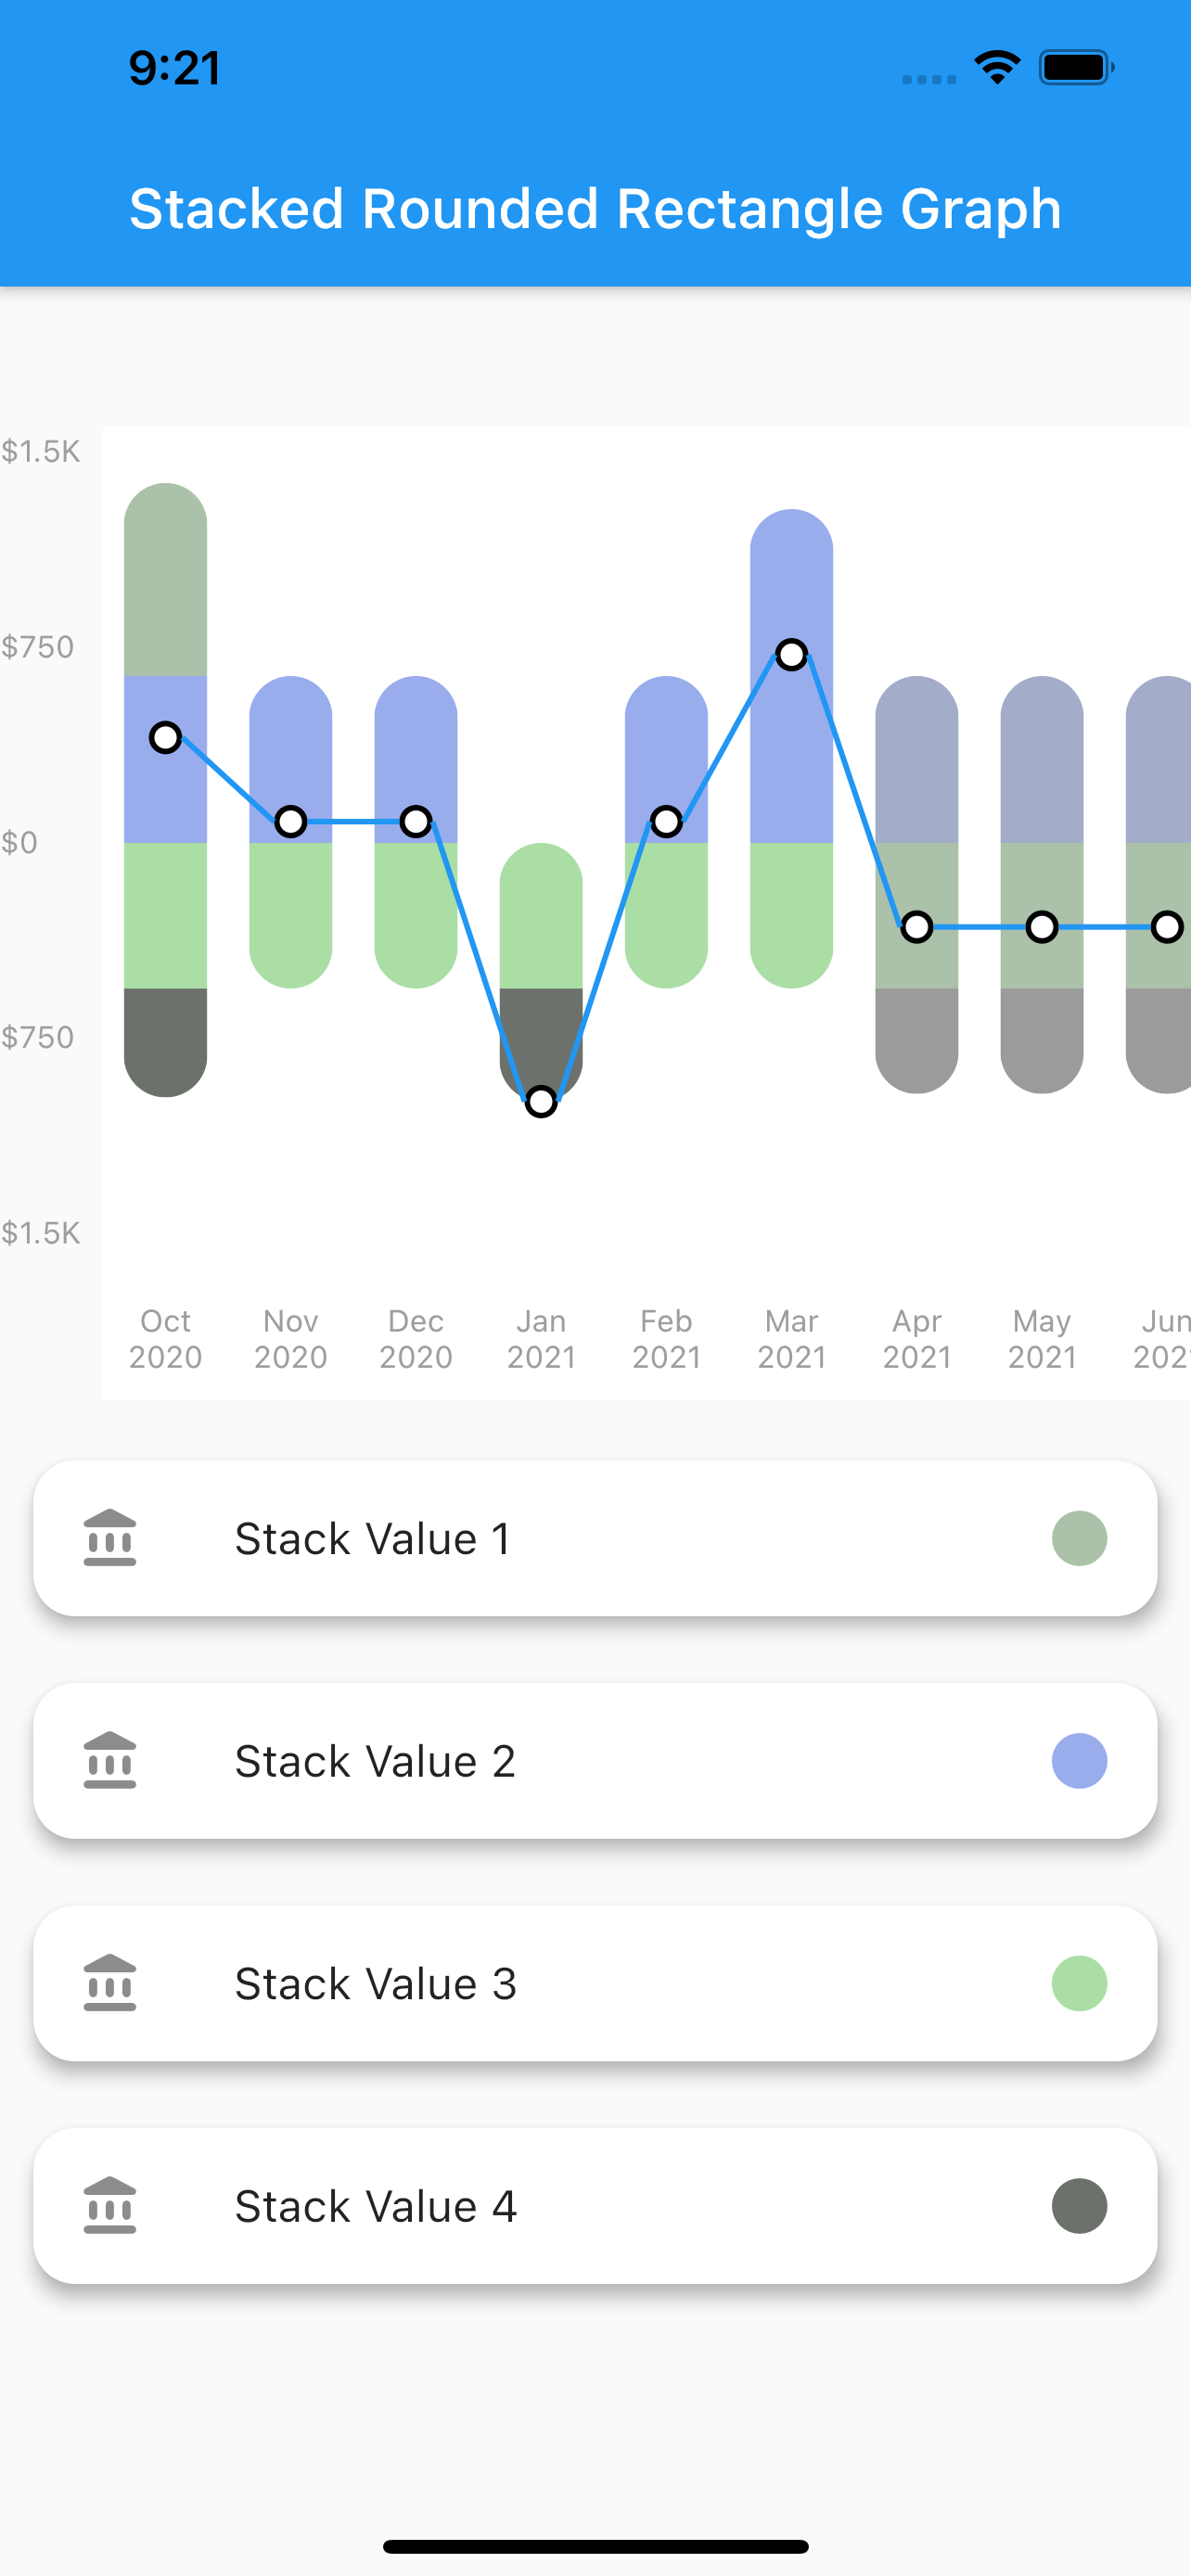
Stacked Rounded Rectangle Graph
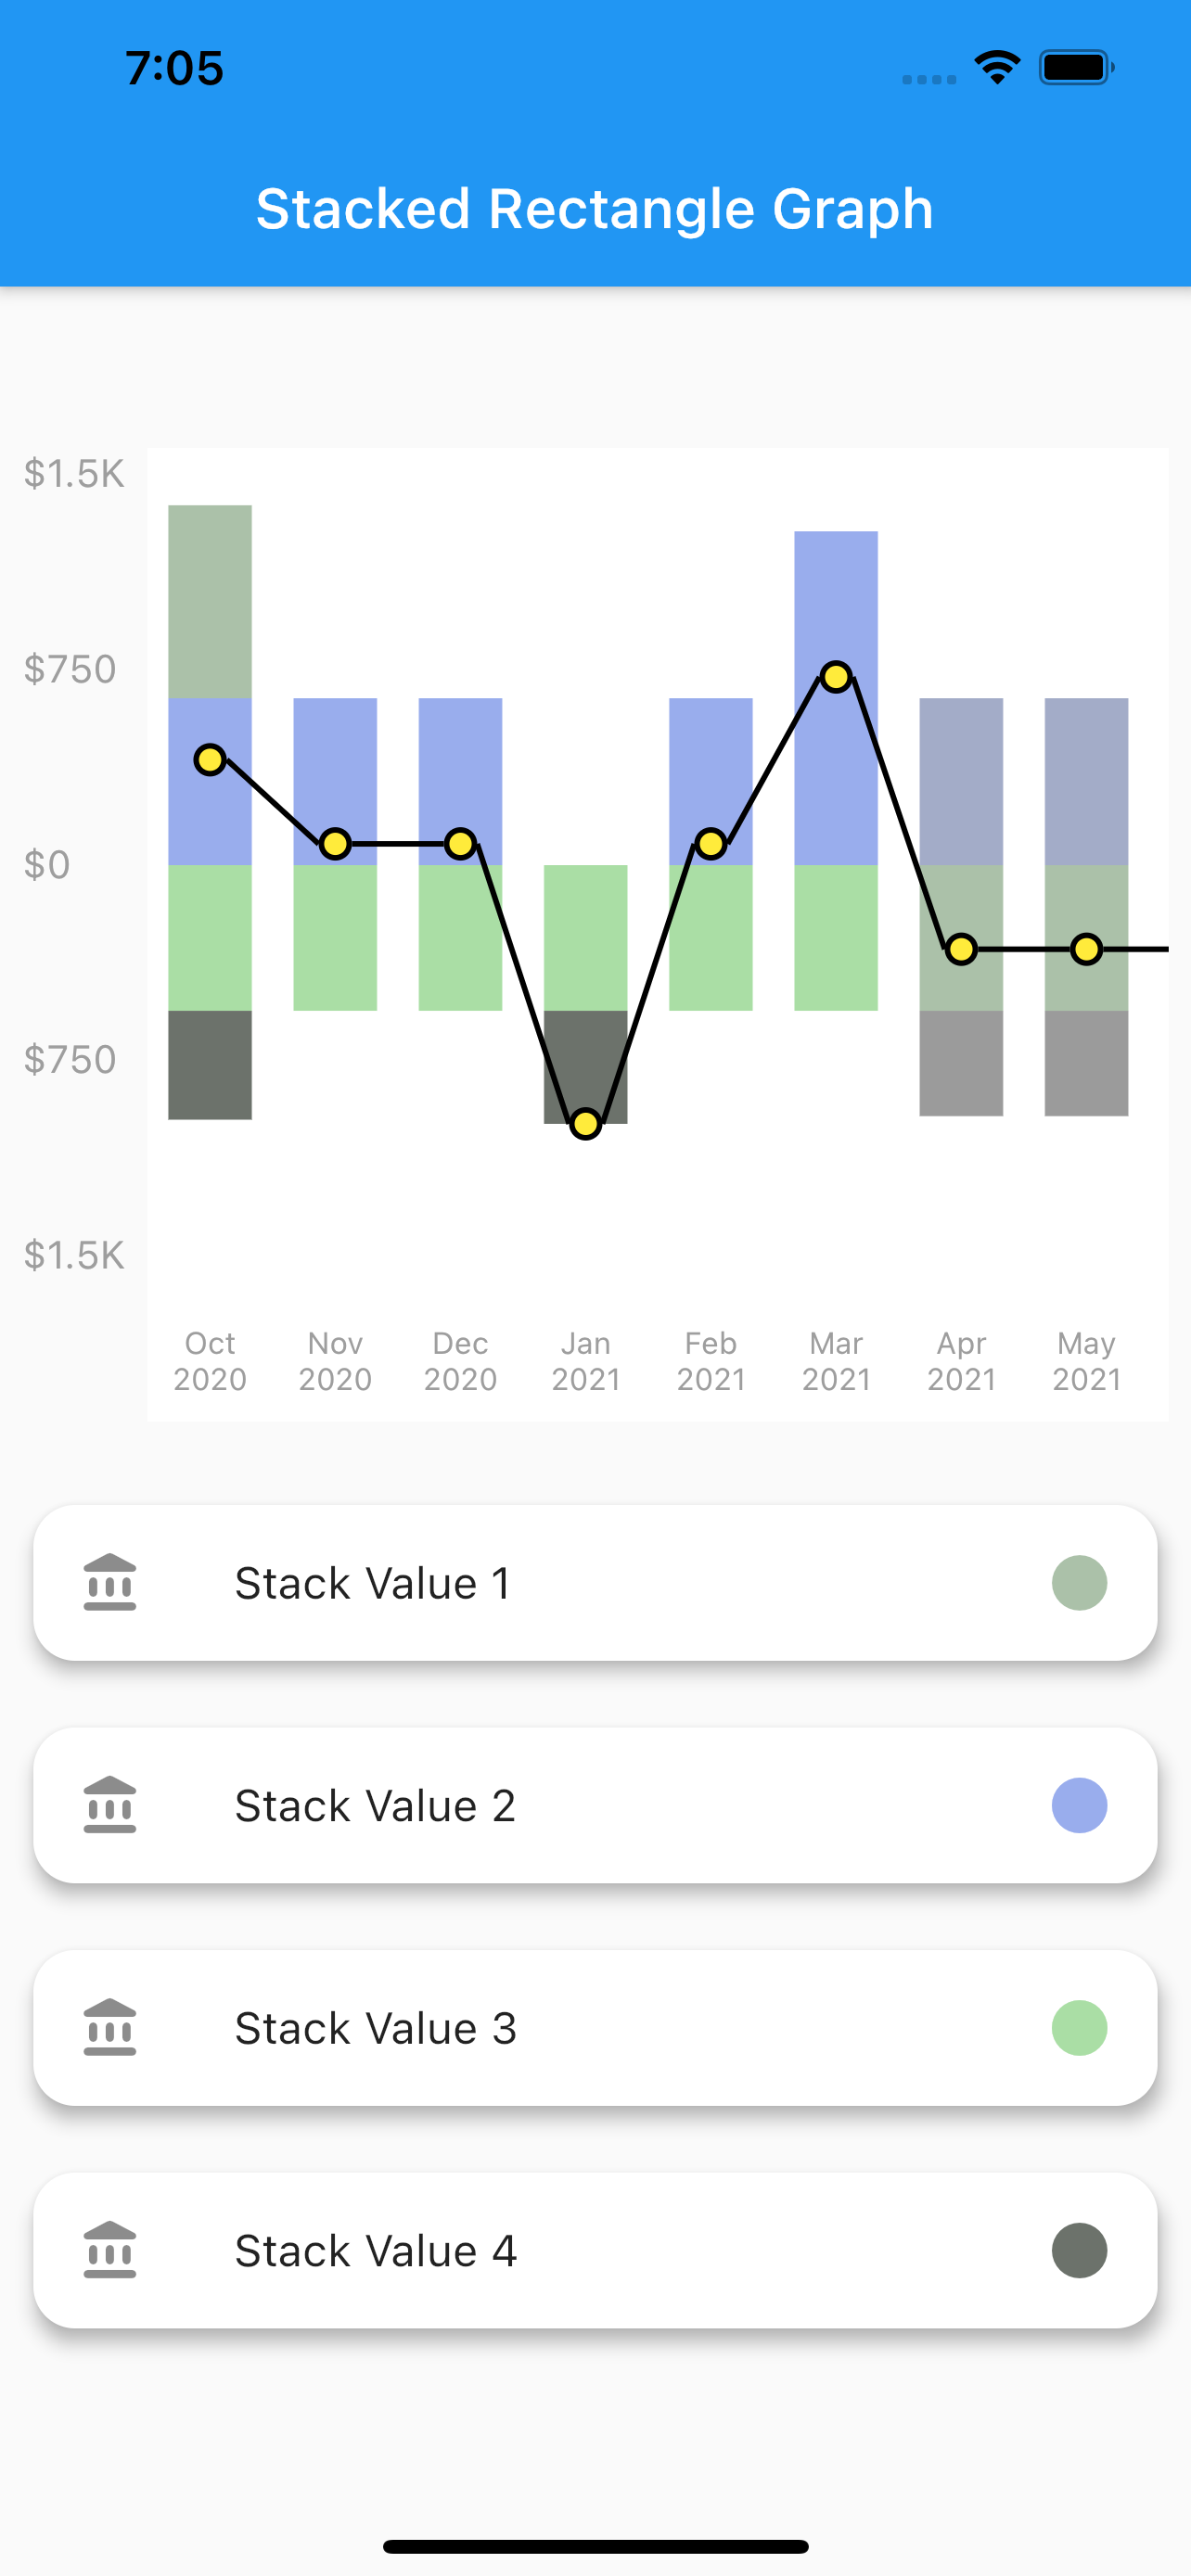
Stacked Rectangele Graph
Net Line Graph
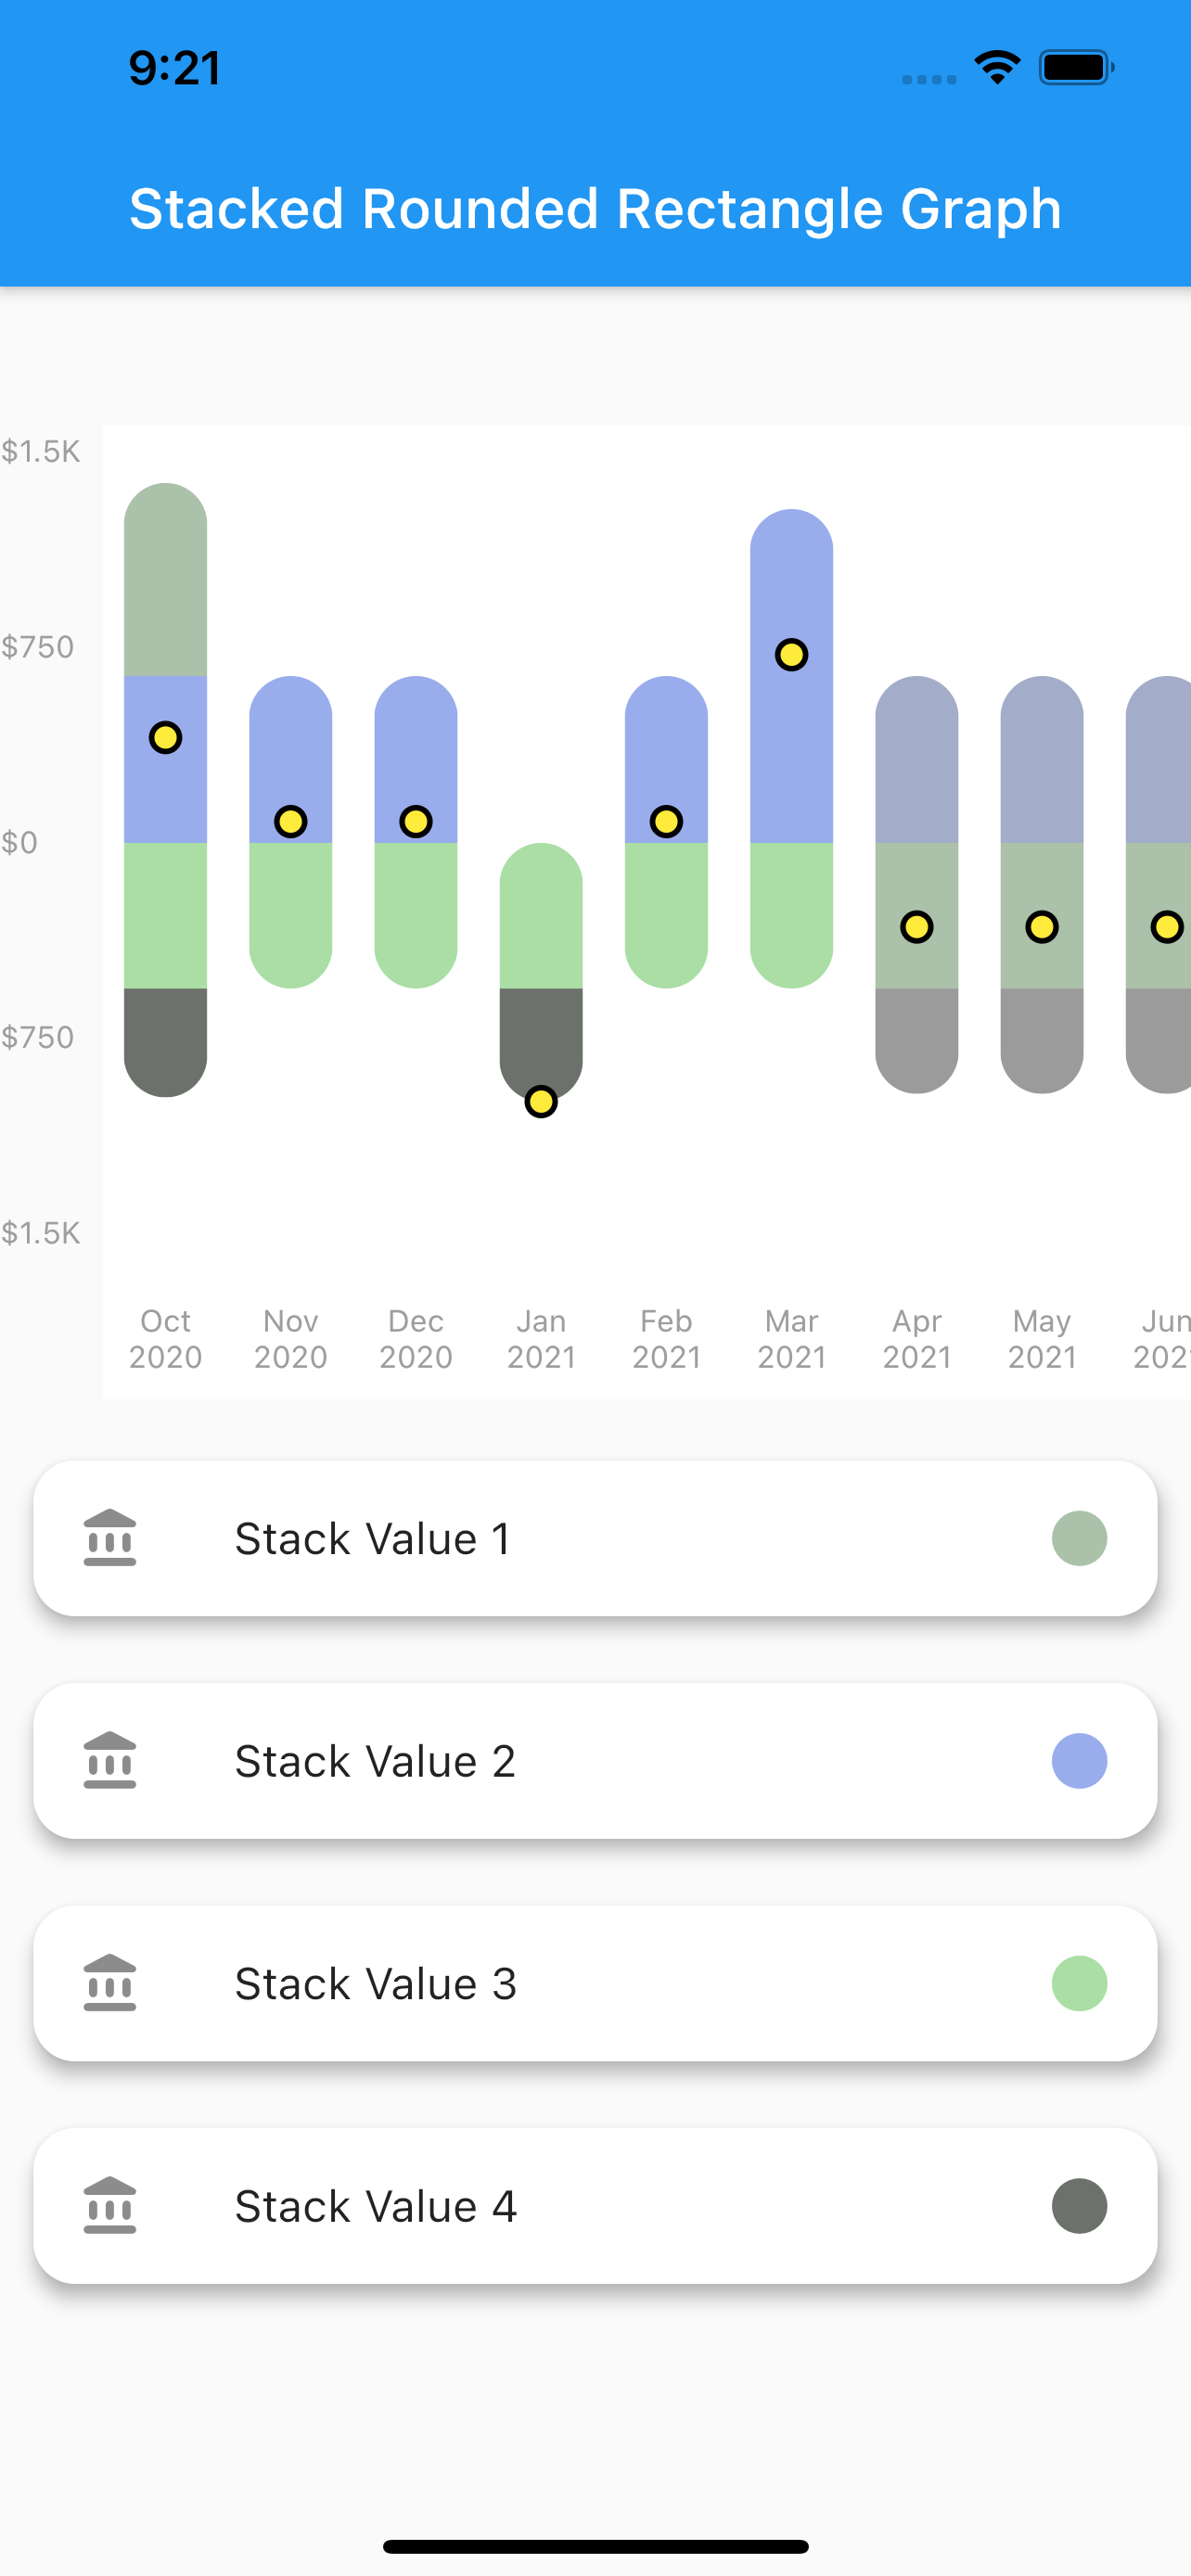
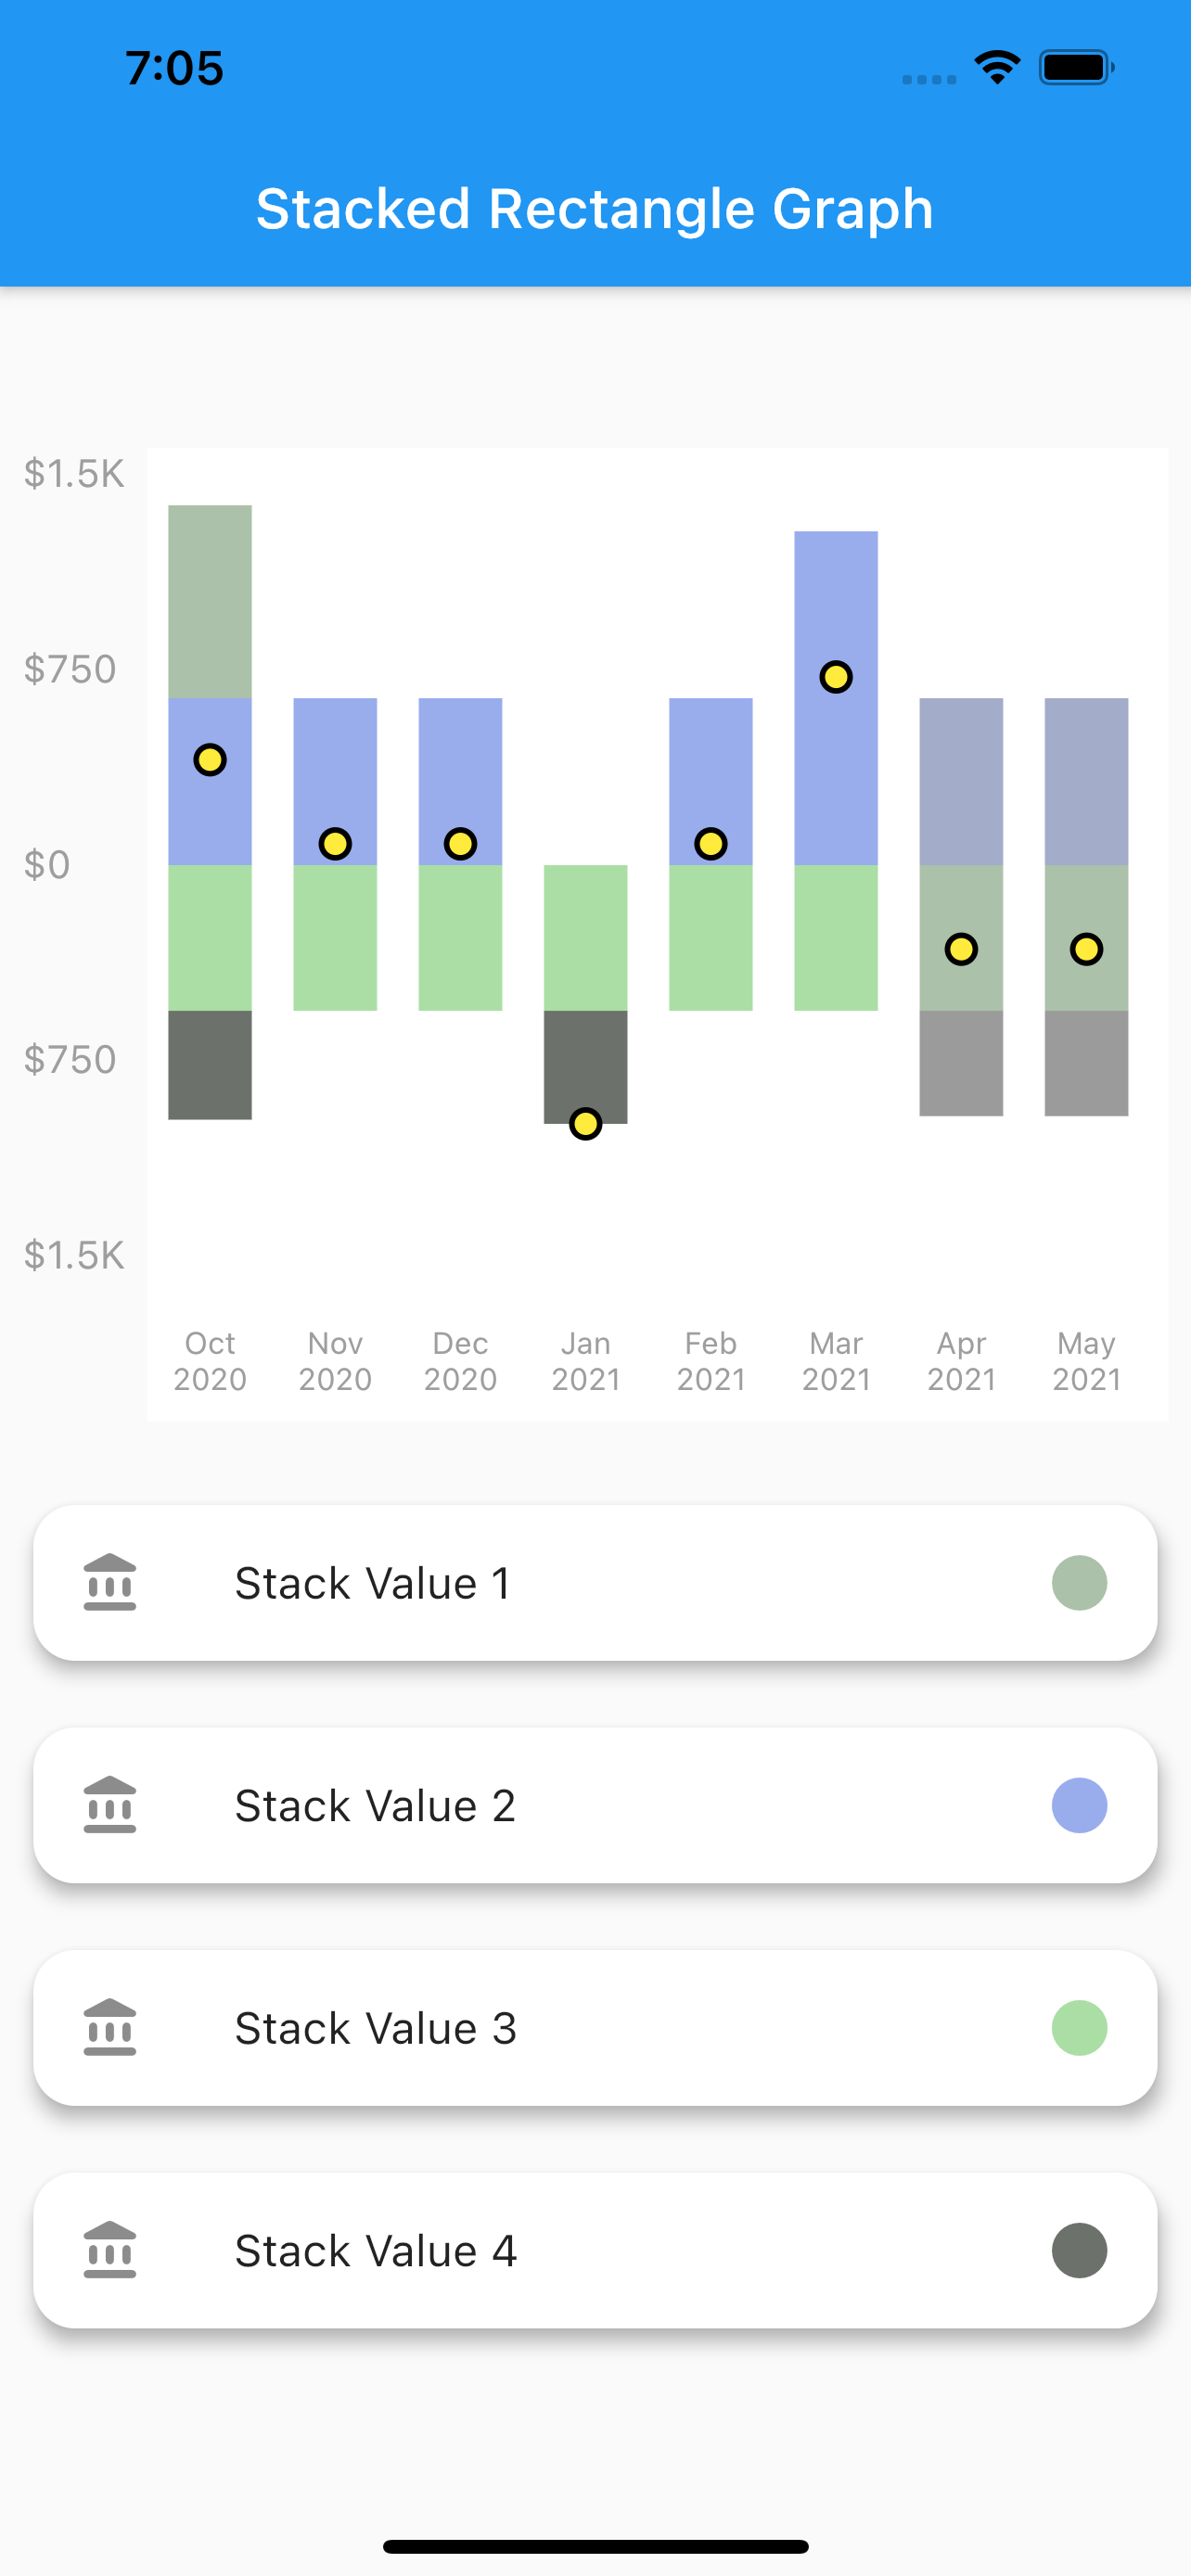
Net Point Graph
Customize your graph
Select if you want to display the net line
change core color,line color as well as line width of the net line
Scrollable
The graphs plotted are scrollable
Provide data in json format
You can use the toMap() and forMap() methods to provide your data in json format
Style your Labels
You can style both you X-axis and Y-axis Labels.
Callback on bar tap
A callback is provided on tap of each bar. Developer can use this feature as per their need.
Installation
In the dependencies: section of your pubspec.yaml, add the following line:
A simple stacked bar graph with no rounded borders. You can customize it in the same way as the stacked rounded rectangle graph.
To plot this graph pass the GraphType.StackedRect in graphType. as shown below
graphType: GraphType.StackedRect
3. Net Line Graph
A simple line graph plotted with the net values of the data provided. The net values of a particular data is calculated and plotted.It can also be customized in the same way as stacked rounded rectangle graph.
To plot this graph pass the GraphType.StackedRect in graphType. as shown below
graphType: GraphType.LineGraph
4. Net Point Graph
A simple plot of the net values of the data.You can customize the point core and it's outer border using the netPoint parameter.
To plot this graph pass the GraphType.StackedRect in graphType. and then pass parameters in netLine to remove the line as shown below