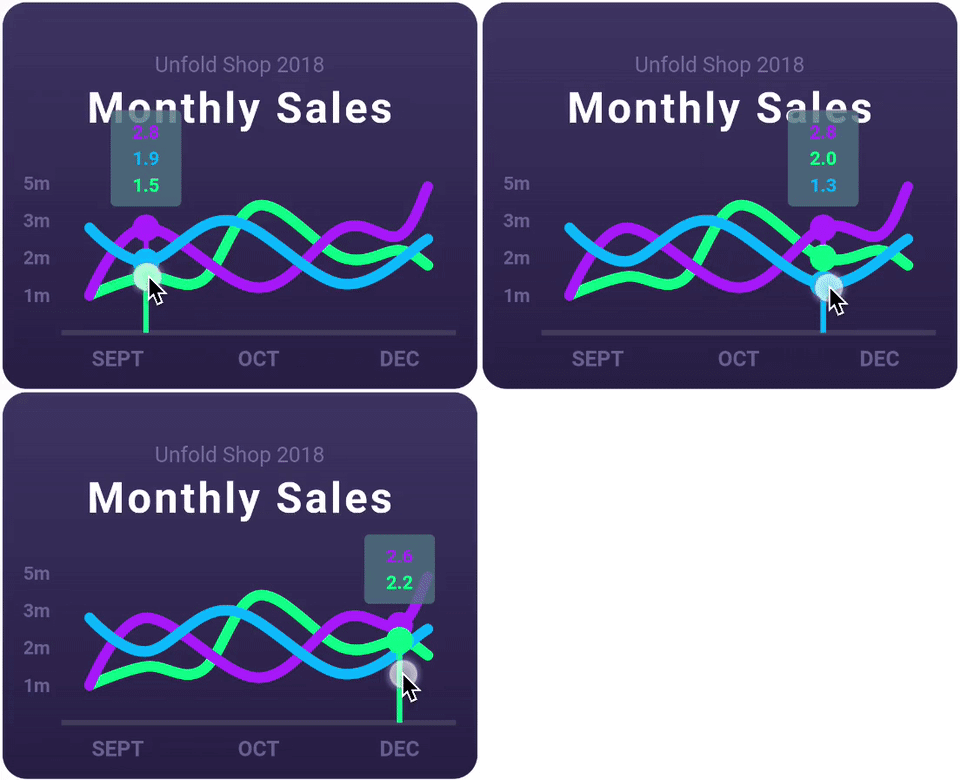
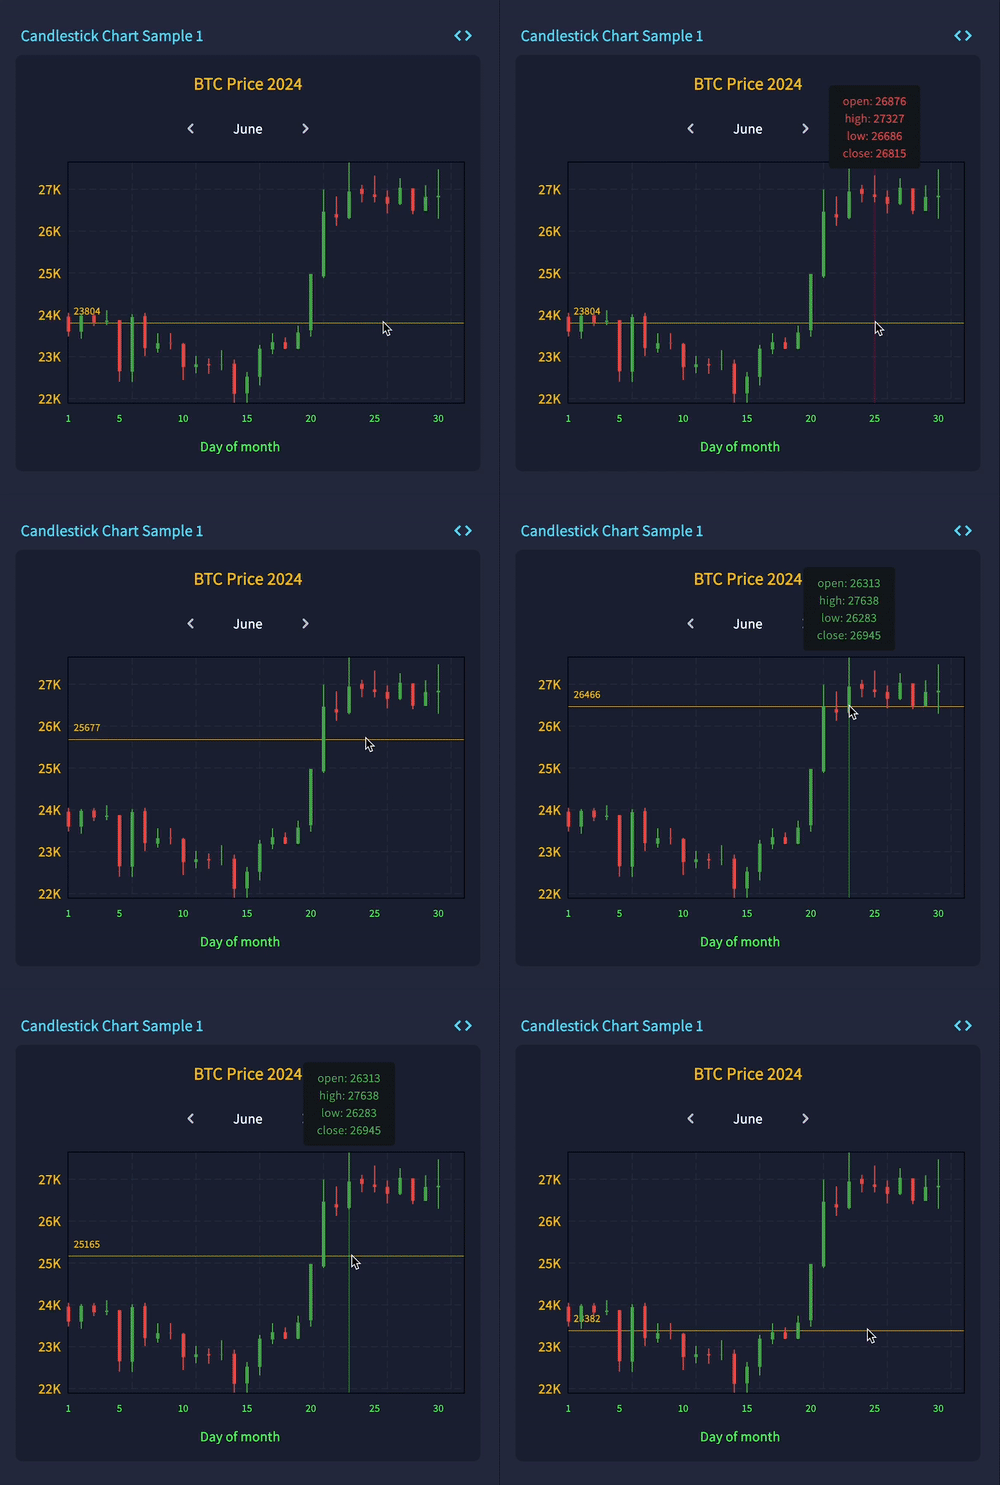
fl_chart는 상호작용적이고 시각적으로 매력적인 차트를 만들기 위한 매우 사용자 정의 가능한 Flutter 라이브러리입니다. 선형, 막대, 원형, 산점도 및 레이더 차트와 같은 다양한 차트 유형을 지원하여 앱에서 데이터 시각화에 이상적입니다. 성능과 유연성을 고려해 설계되었으며 색상, 레이블, 애니메이션 및 터치 인터랙션에 대한 광범위한 사용자 정의 옵션을 제공합니다. 활발히 유지 관리되며 Android, iOS, 웹, macOS, Windows, Linux 등 모든 주요 플랫폼과 호환됩니다. 깔끔한 API와 포괄적인 문서 덕분에 fl_chart는 복잡한 차트를 Flutter 애플리케이션에 쉽게 통합할 수 있도록 도와줍니다.
사용 사례
실시간 데이터 트렌드 표시
사용자 분석 시각화
재무 또는 판매 데이터 제시
상호작용형 대시보드 만들기
교육 데이터 표현
주요 기능
5가지 차트 유형을 지원
높은 사용자 정의 가능한 외관
내장 애니메이션 및 제스처
크로스 플랫폼 호환성
경량이고 성능이 뛰어남
풍부한 구성 옵션
적합한 대상
데이터 기반 애플리케이션
대시보드 및 보고 도구
모바일 및 웹 분석
교육 및 생산성 앱
인터랙티브 시각화 프로토타이핑
고려 사항
차트 고유의 구성에 대한 이해가 필요합니다
대규모 데이터 세트에 대한 최적화가 필요할 수 있습니다
사용자 정의 스타일링은 복잡성을 증가시킬 수 있습니다
제한된 내장 툴팁(사용자 정의 구현 필요)
매우 복잡한 과학적 시각화에는 적합하지 않음
원본 README
연결된 소스 저장소의 README 원문 스냅샷입니다. 최신 내용은 저장소에서 확인하세요.
Our Financial Heroes
Your financial support acts as fuel for fl_chart's development. Support here.
Or if you are a fan of crypto, you can donate me Bitcoins here: 1L7ghKdcmgydmUJAnmYmMaiVjT1LoP4a45
Contributing
:beer: Pull requests are welcome!
Remember that open-source projects thrive on contributions. Every improvement—no matter how small—makes a meaningful difference, even if it’s just a single line.
Our documentation may contain grammatical issues, and if you’re fluent in English, your help in correcting them would be greatly appreciated.
Check out CONTRIBUTING.md, which contains a guide for those who want to contribute to the FL Chart.
Reporting bugs and issues is also a contribution, yes, it is.
Below are the people who have contributed to the FL Chart. We hope we have your picture here soon.