Pakete, Repositories und App-Kategorien suchen

Cover von candlesticks
Paketdetailsv3.0.1

candlesticks

Leistungsstarker, interaktiver Flutter-Kerzenchart für Finanzanwendungen.

AndroidiOSWebmacOSWindowsLinux
30-Tage-Downloads
1490
Likes
141
Pub-Punkte
160

Paket installieren

flutter pub add candlesticks

Paketübersicht

Aus öffentlichen Paketdaten erstellte Orientierung.

Ein leistungsstarkes, interaktives Candlestick-Diagramm-Paket für Finanzanwendungen in Flutter. Es ermöglicht die Echtzeitvisualisierung von Kursbewegungen mit flüssiger Darstellung auf Android, iOS, Web, macOS, Windows und Linux. Das Paket unterstützt Touch-Interaktionen wie Panning und Zooming und ist daher ideal für Handelsplattformen und Finanzdashboards. Auf Dart basiert, integriert es sich nahtlos in Flutter-Anwendungen und nutzt effiziente Rendering-Techniken, um große Datensätze ohne Leistungseinbußen zu verarbeiten.

Anwendungsfälle

  • Echtzeit-Verfolgung von Aktienkursen
  • Analyse des Kryptowährungsmarktes
  • Handelsplattform-UIs
  • Finanzdaten-Dashboards
  • Historische Preisvisualisierung

Hauptmerkmale

  • Interaktives Panning und Zoomen
  • Leistungsstarke Rendering
  • Plattformübergreifende Unterstützung
  • Echtzeit-Datenaktualisierungen
  • Anpassbare Diagramm-Aussehen

Geeignet für

  • Finanz-App-Entwickler
  • Trading-Interface-Designer
  • Datenvisualisierungsingenieure
  • Krypto-Analysetools
  • Aktienmarkt-Überwachungs-Apps

Hinweise

  • Erfordert Verständnis von Finanzdatenstrukturen
  • Am besten geeignet für Zeitreihen-Preisdaten
  • Möglicherweise ist zusätzliche Zustandsverwaltung für dynamische Aktualisierungen erforderlich
  • Beschränkt auf candlestick-spezifische Visualisierungen
  • Hängt von externen Datenquellen für Live-Feeds ab

Original-README

Originaler README-Schnappschuss aus dem verknüpften Quell-Repository. Aktuelle Inhalte finden Sie im Repository.

Candlesticks

A high-performance, interactive Flutter candlestick chart for financial apps.

Flutter Dart pub package version

iOS supported Android supported Web supported macOS supported Windows supported Linux supported

Web Demo · pub.dev · GitHub


candlesticks is a Flutter package for rendering interactive OHLCV candlestick charts.

It supports mobile and desktop gestures, crosshair interaction, panning, zooming, switching between logarithmic and linear price scales, volume bars, controller-based viewport control, lazy loading, and custom chart styling.

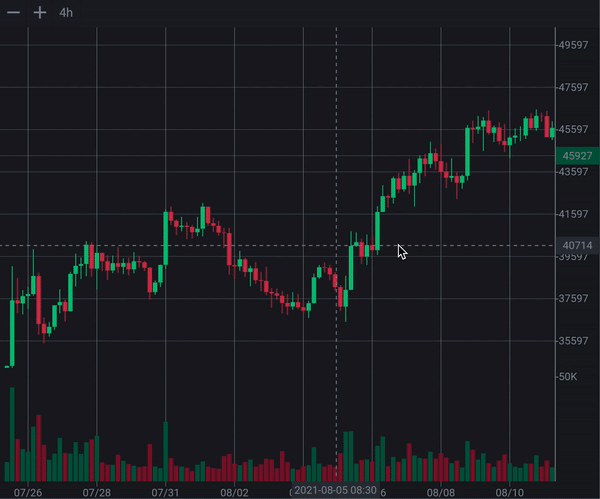
Preview

Web Preview

Try the live web demo:

https://r-mzy47.github.io/candlesticks/master/

On the web, use Alt/Option + scroll for anchored zoom.

Note: Ctrl + scroll is currently avoided on web because browsers may intercept it for page zoom.

Mobile Preview
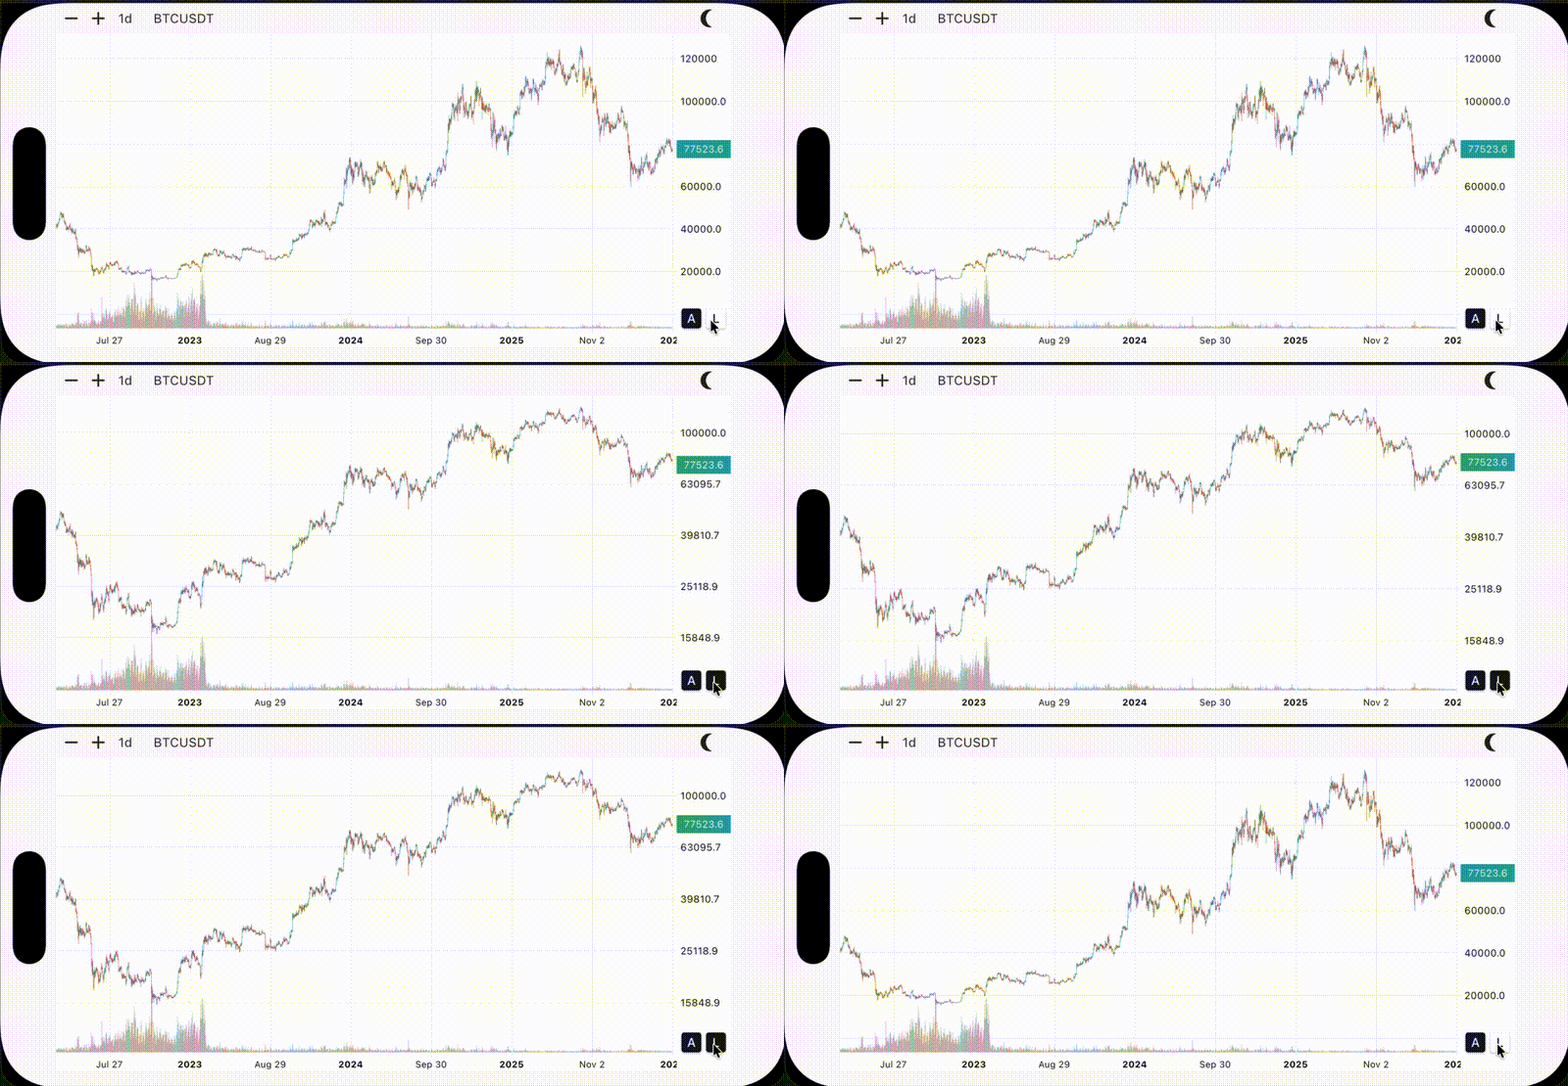
Linear and logarithmic scales
Logarithmic and linear scale demo
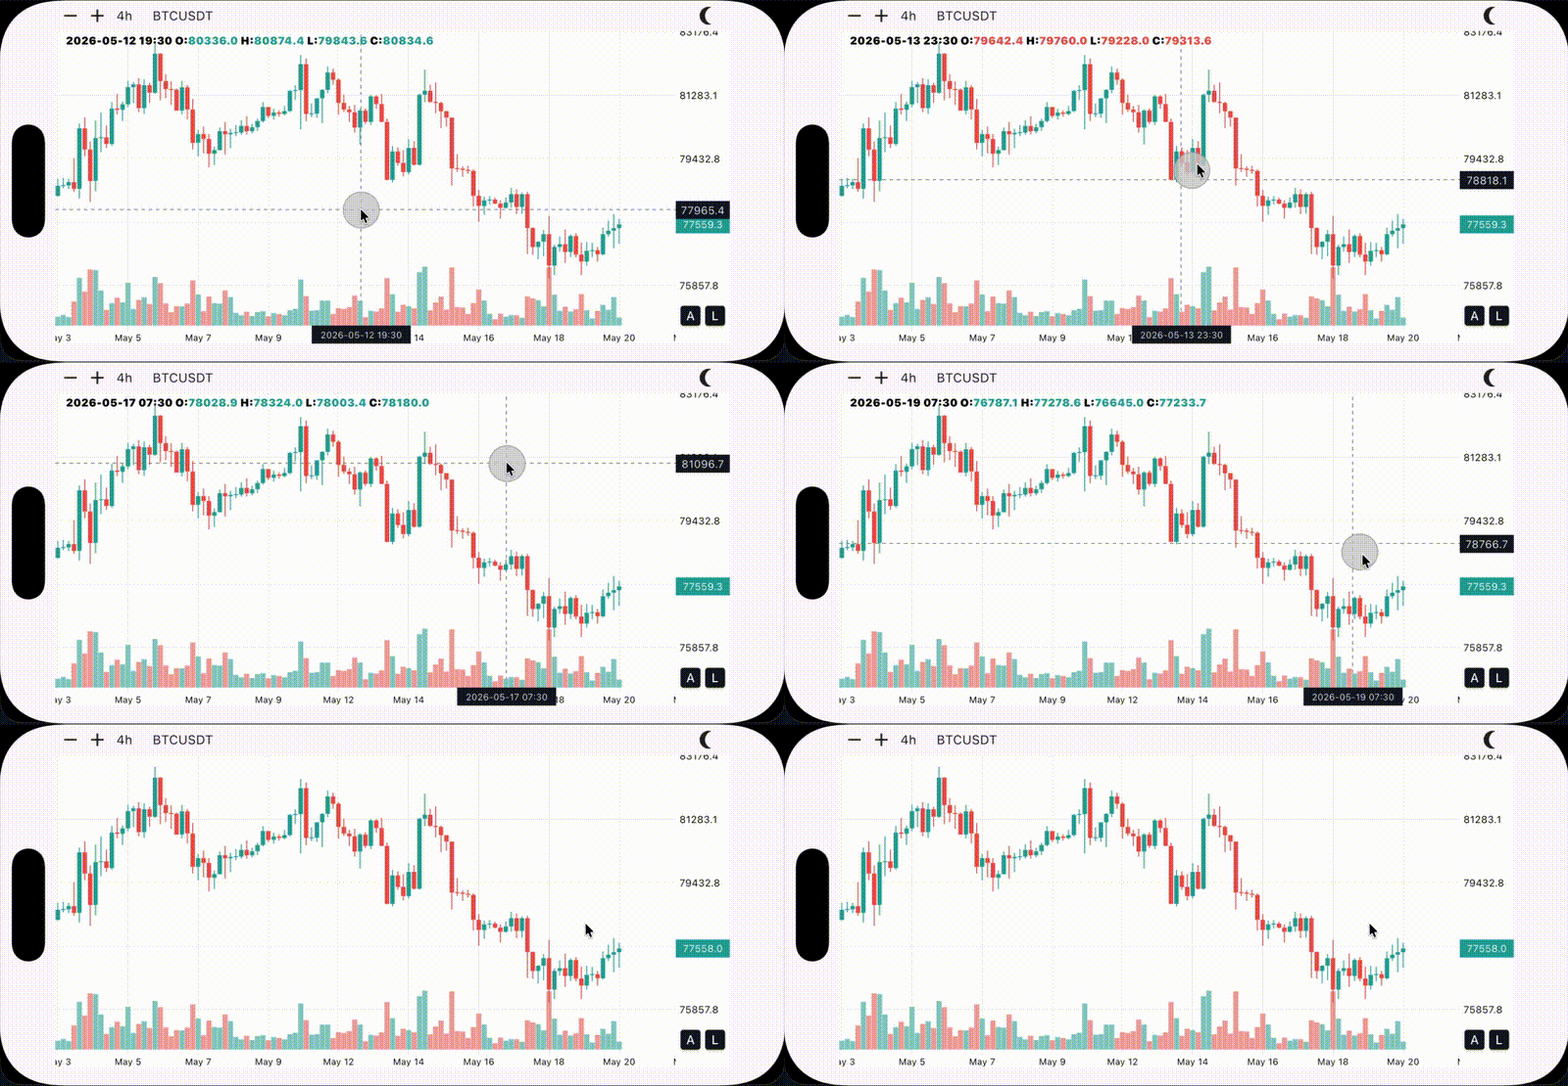
Long press for crosshair
Long press crosshair demo
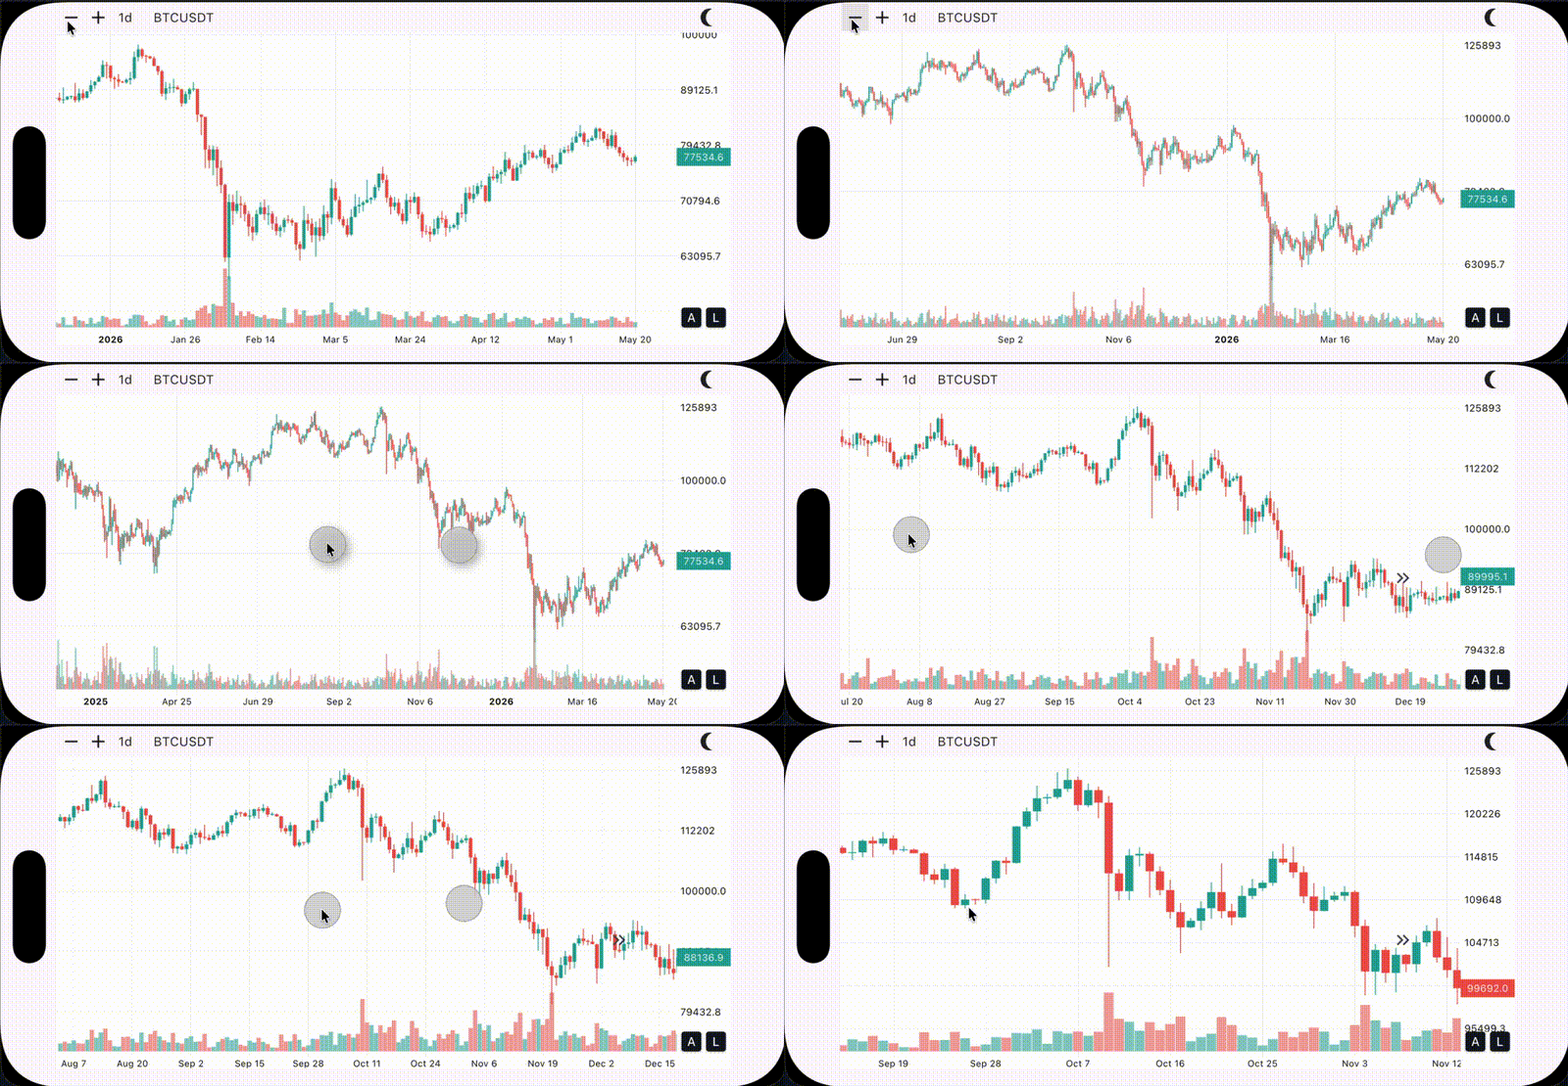
Advanced gestures: pan in any direction
Advanced chart gesture demo
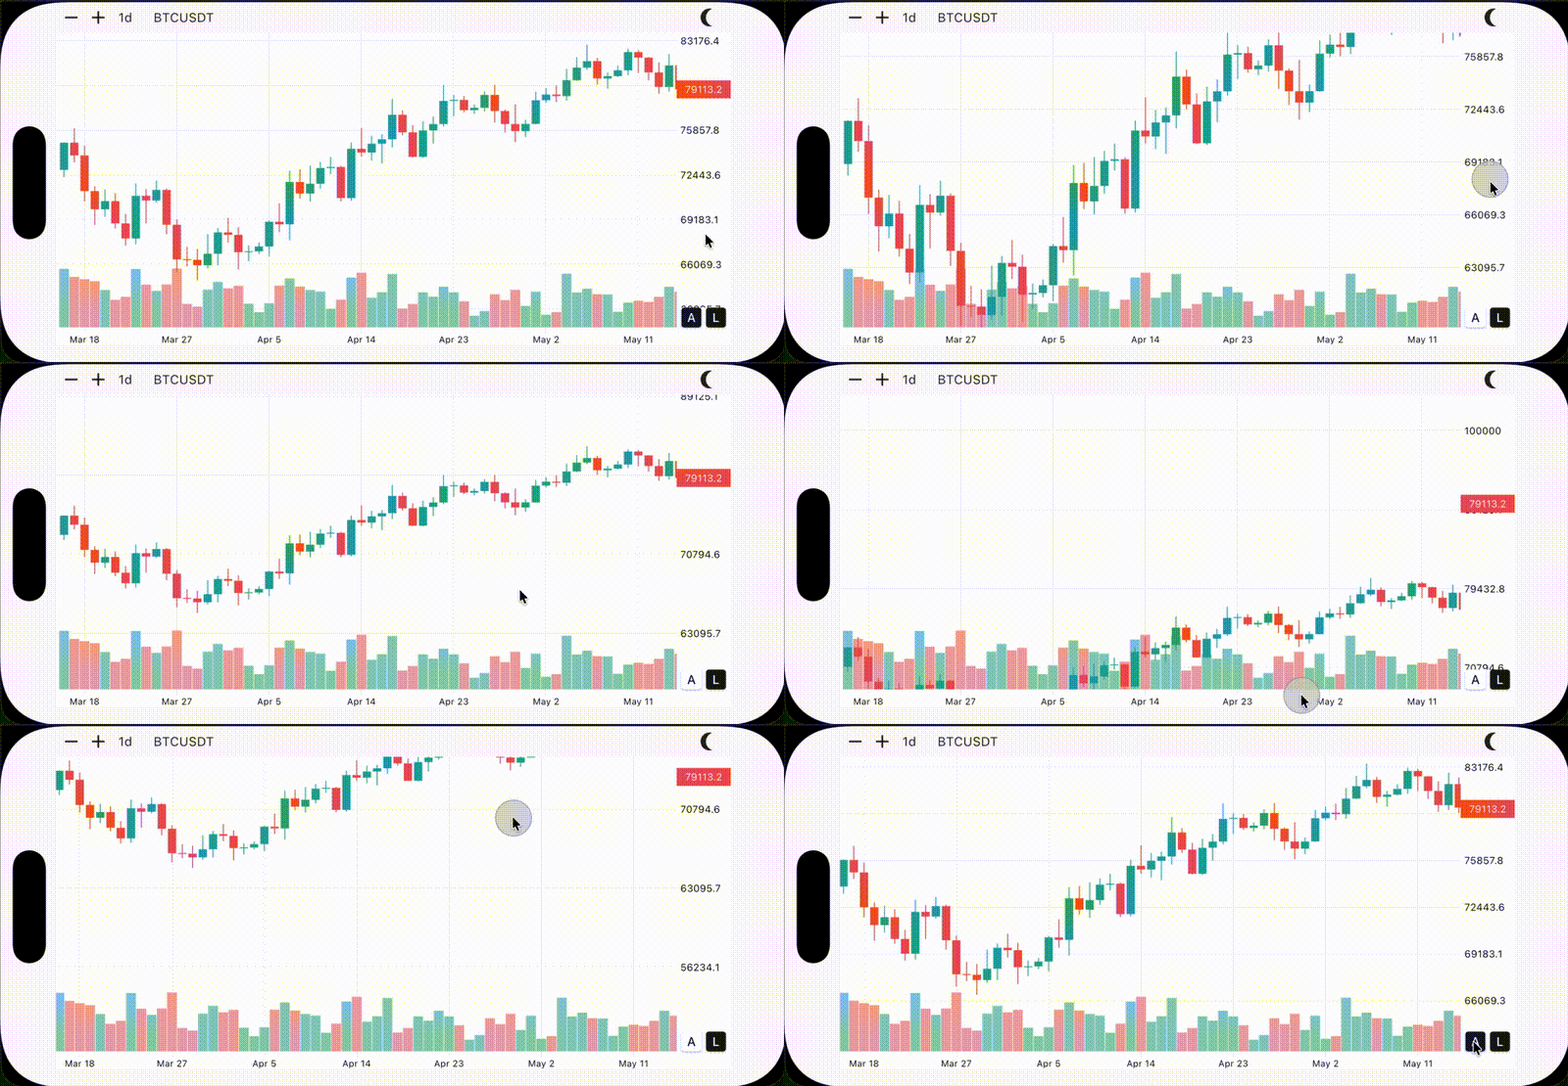
Anchored and regular zoom
Anchored and regular zoom demo

Installation

Add this to your pubspec.yaml:

dependencies:
  candlesticks: ^3.0.1

Then run:

flutter pub get

Import

import 'package:candlesticks/candlesticks.dart';

Basic Usage

import 'package:candlesticks/candlesticks.dart';
import 'package:flutter/material.dart';

class ChartPage extends StatelessWidget {
  const ChartPage({super.key});

  List<Candle> get candles {
    return [
      Candle(
        date: DateTime(2024, 1, 2),
        open: 105,
        high: 115,
        low: 101,
        close: 108,
        volume: 1500,
      ),
      Candle(
        date: DateTime(2024, 1, 1),
        open: 100,
        high: 110,
        low: 95,
        close: 105,
        volume: 1200,
      ),
    ];
  }

  @override
  Widget build(BuildContext context) {
    return Scaffold(
      body: SafeArea(
        child: Candlesticks(
          candles: candles,
        ),
      ),
    );
  }
}

The candle list must be ordered from newest to oldest. The newest candle should be at index 0.

final candles = [
  newestCandle,
  previousCandle,
  olderCandle,
];

Candle Model

Candle represents one OHLCV data point.

final candle = Candle(
  date: DateTime.now(),
  open: 100,
  high: 120,
  low: 90,
  close: 110,
  volume: 5000,
);
Candle Fields
Field Type Description
date DateTime Candle timestamp. Usually the opening time of the candle interval.
open double Opening price.
high double Highest price during the candle period.
low double Lowest price during the candle period.
close double Closing price.
volume double Traded volume.
isBull bool Returns true when open <= close.

Candlesticks Widget

Constructor
const Candlesticks({
  super.key,
  required this.candles,
  this.onLoadMoreCandles,
  this.loadingWidget,
  this.controller,
  this.style,
});
Properties
Property Type Description
candles List<Candle> Candle data. The list must be ordered from newest to oldest.
onLoadMoreCandles Future<void> Function()? Called when the chart scroll position is close to the oldest loaded candle.
loadingWidget Widget? Widget displayed when candles is empty.
controller CandlesticksController? Optional controller for programmatic viewport control.
style CandleSticksStyle? Optional visual style for the chart.
Loading State

When candles is empty, the chart shows a loading indicator by default.

Candlesticks(
  candles: const [],
)

Use loadingWidget to customize it:

Candlesticks(
  candles: const [],
  loadingWidget: const Text('Loading candles...'),
)
Load More Candles

Use onLoadMoreCandles to fetch older candles when the user scrolls near the end of the loaded history.

Candlesticks(
  candles: candles,
  onLoadMoreCandles: () async {
    final olderCandles = await repository.fetchOlderCandles();

    setState(() {
      candles.addAll(olderCandles);
    });
  },
)

Older candles should be added to the end of the list.

candles = [
  newestCandle,
  previousCandle,
  olderCandle,
  evenOlderCandle,
];
Controller

Use CandlesticksController when you want to control the chart viewport manually.

final controller = CandlesticksController();
Candlesticks(
  candles: candles,
  controller: controller,
)

Dispose the controller if you create it inside a State object:

@override
void dispose() {
  controller.dispose();
  super.dispose();
}
Controller Example
class ControlledChartPage extends StatefulWidget {
  const ControlledChartPage({super.key});

  @override
  State<ControlledChartPage> createState() => _ControlledChartPageState();
}

class _ControlledChartPageState extends State<ControlledChartPage> {
  final CandlesticksController controller = CandlesticksController();

  @override
  void dispose() {
    controller.dispose();
    super.dispose();
  }

  @override
  Widget build(BuildContext context) {
    return Column(
      children: [
        Row(
          children: [
            IconButton(
              onPressed: controller.zoomIn,
              icon: const Icon(Icons.zoom_in),
            ),
            IconButton(
              onPressed: controller.zoomOut,
              icon: const Icon(Icons.zoom_out),
            ),
            IconButton(
              onPressed: () => controller.animateTo(-10),
              icon: const Icon(Icons.keyboard_double_arrow_right),
            ),
          ],
        ),
        Expanded(
          child: Candlesticks(
            candles: candles,
            controller: controller,
          ),
        ),
      ],
    );
  }
}
Common Controller Members
Member Description
isNearEnd Whether the visible range is close to the oldest loaded candle.
jumpTo(double index) Jumps to a scroll index without animation.
animateTo(double index) Animates to a scroll index.
setZoom(double width) Sets candle width directly.
zoomBy(double factor) Multiplies the current candle width by a factor.
zoomIn() Zooms in by a fixed step.
zoomOut() Zooms out by a fixed step.
scrollByPixels(...) Scrolls horizontally by a pixel delta.

Styling

By default, the chart chooses a light or dark style based on the current Flutter theme.

Candlesticks(
  candles: candles,
)

You can pass your own style:

Candlesticks(
  candles: candles,
  style: CandleSticksStyle.dark(
    chartBackgroundColor: const Color(0xFF0F0F0F),
    candleBullColor: const Color(0xFF26A69A),
    candleBearColor: const Color(0xFFEF5350),
  ),
)

Or use the light style:

Candlesticks(
  candles: candles,
  style: CandleSticksStyle.light(),
)
Style Fields
Field Description
chartBackgroundColor Main chart background.
gridLineColor Horizontal and vertical grid lines.
axisTextColor Price and time axis text.
candleBullColor Bullish candle body and wick.
candleBearColor Bearish candle body and wick.
volumeBullColor Bullish volume bar.
volumeBearColor Bearish volume bar.
crosshairLineColor Dashed crosshair line.
crosshairLabelBackgroundColor Crosshair price/time label background.
crosshairLabelTextColor Crosshair price/time label text.
ohlcInfoTextColor OHLC info label text.
ohlcInfoBullColor Bullish OHLC value text.
ohlcInfoBearColor Bearish OHLC value text.
priceIndicatorBullBackgroundColor Last price label background when the latest candle is bullish.
priceIndicatorBearBackgroundColor Last price label background when the latest candle is bearish.
priceIndicatorTextColor Last price label text.
scaleButtonActiveBackgroundColor Active scale button background.
scaleButtonActiveTextColor Active scale button text.
scaleButtonInactiveBackgroundColor Inactive scale button background.
scaleButtonInactiveTextColor Inactive scale button text.
loadingIndicatorColor Default loading indicator color.

Example App

The repository includes a complete example app that demonstrates the core features of this package in a real project.

The example app uses the Binance API and includes:

  • Symbol search
  • Timeframe selection
  • Historical candle loading
  • Real-time price updates

Run it locally:

cd example
flutter run

Live web example:

https://r-mzy47.github.io/candlesticks/master/

Migration Guide

See MIGRATION.md for the migration guide from version 2.x to version 3.0.0.

Kategorien

Quell-Repository

Projekte, die dieses Paket verwenden

Noch keine Daten verfügbar.