Pakete, Repositories und App-Kategorien suchen

Cover von chart_sparkline
Paketdetailsv1.1.2

chart_sparkline

Schöne Sparkline-Charts für Flutter. Durchschnittslinie, höchster und niedrigster Wert.

AndroidiOSWebmacOSWindowsLinux
30-Tage-Downloads
7490
Likes
135
Pub-Punkte
150

Paket installieren

flutter pub add chart_sparkline

Paketübersicht

Aus öffentlichen Paketdaten erstellte Orientierung.

Chart Sparkline ist ein Flutter-Paket, das die Erstellung kompakter, visuell ansprechender Sparkline-Diagramme ermöglicht. Es zeigt Trends in kleinen Räumen mit Funktionen wie Durchschnittslinien und hebt maximale und minimale Werte hervor. Ideal für Dashboards und Datensummen, unterstützt mehrere Plattformen wie Android, iOS, Web, macOS, Windows und Linux. Das Paket ist leichtgewichtig und lässt sich nahtlos in bestehende Flutter-Apps integrieren. Sein sauberer Entwurf verbessert die Datenlesbarkeit, ohne die Benutzer zu überfordern.

Anwendungsfälle

  • Dashboard-Widgets
  • Echtzeit-Datenverfolgung
  • Leistungsverlauf Visualisierung
  • Kompakte Datenzusammenfassungen
  • Finanzkennzahlenanzeige

Hauptmerkmale

  • Durchschnittslinienvisualisierung
  • Maximal- und Minimalwerte hervorheben
  • Minimales Design
  • Plattformübergreifende Unterstützung
  • Einfache Integration mit Flutter
  • Glatte Darstellung

Geeignet für

  • Daten-Dashboards
  • Mobile- und Webanwendungen
  • Analytics-Schnittstellen
  • Finanz- und Gesundheitsverfolgungs-Apps
  • UIs, die kompakte Diagramme erfordern

Hinweise

  • Am besten für kleine Datensätze
  • Begrenzte Interaktivität
  • Keine Tooltips oder Beschriftungen
  • Benötigt manuelle Datenformatierung
  • Nicht geeignet für komplexe Diagrammtypen

Original-README

Originaler README-Schnappschuss aus dem verknüpften Quell-Repository. Aktuelle Inhalte finden Sie im Repository.

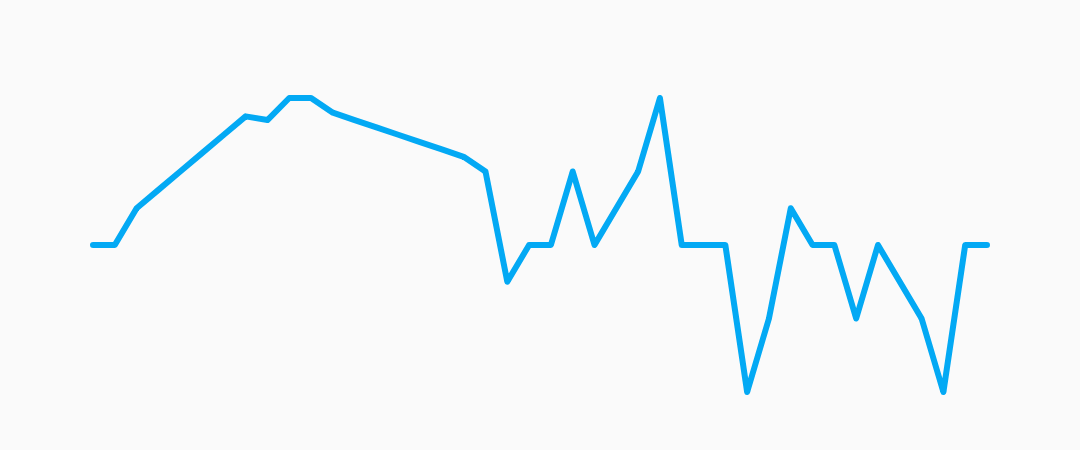
pub package

chart_sparkline

Beautiful sparkline charts for Flutter.

screenshot

Online Demo

Online Demo

Installation

Install the latest version from pub.

Quick Start

Import the package, create a Sparkline , and pass it your data.

import 'package:flutter/material.dart';
import 'package:chart_sparkline/chart_sparkline.dart';

void main() {
  var data = [0.0, 1.0, 1.5, 2.0, 0.0, 0.0, -0.5, -1.0, -0.5, 0.0, 0.0];
  runApp(
    MaterialApp(
      home: Scaffold(
        body: Center(
          child: Container(
            width: 300.0,
            height: 100.0,
            child: Sparkline(
              data: data,
            ),
          ),
        ),
      ),
    ),
  );
}

base example screenshot

Customization

Sparkline
Property Default
lineWidth 2.0
lineColor Colors.lightBlue
lineGradient null

Example:

Sparkline(
  data: data,
  lineWidth: 5.0,
  lineColor: Colors.purple,
);

lineopts example screenshot

Sparkline(
  data: data,
  lineWidth: 10.0,
  lineGradient: LinearGradient(
    begin: Alignment.topCenter,
    end: Alignment.bottomCenter,
    colors: [Colors.purple[800], Colors.purple[200]],
  ),
);

lineopts example screenshot


Points
Property Default
pointsMode PointsMode.none
pointSize 4.0
pointColor Colors.lightBlue[800]
pointIndex null
PointsMode Description
none (default) Do not draw individual points.
all Draw all the points in the data set.
last Draw only the last point in the data set.
atIndex Draw one point at the index specified by pointIndex.

Example:

Sparkline(
  data: data,
  pointsMode: PointsMode.all,
  pointSize: 8.0,
  pointColor: Colors.amber,
);

all points example screenshot

Sparkline(
  data: data,
  pointsMode: PointsMode.last,
  pointSize: 8.0,
  pointColor: Colors.amber,
);

last point example screenshot

Sparkline(
  data: data,
  pointsMode: PointsMode.atIndex,
  pointIndex: 7,
  pointSize: 8.0,
  pointColor: Colors.amber,
);

Fill
Property Default
fillMode FillMode.none
fillColor Colors.lightBlue[200]
fillGradient null
FillMode Description
none (default) Do not fill, draw only the sparkline.
above Fill the area above the sparkline.
below Fill the area below the sparkline.

Example:

Sparkline(
  data: data,
  fillMode: FillMode.below,
  fillColor: Colors.red[200],
);

fill below example screenshot

Sparkline(
  data: data,
  fillMode: FillMode.above,
  fillColor: Colors.red[200],
);

fill above example screenshot

Sparkline(
  data: data,
  fillMode: FillMode.below,
  fillGradient: LinearGradient(
    begin: Alignment.topCenter,
    end: Alignment.bottomCenter,
    colors: [Colors.red[800], Colors.red[200]],
  ),
);

fill above example screenshot

Smoothing
Sparkline(
  data: data,
  useCubicSmoothing: true,
  cubicSmoothingFactor: 0.2,
),

cubic smoothing example screenshot

Average Line
Sparkline(
  data: data,
  averageLine: true,
  averageLabel: true,
),

cubic smoothing example screenshot

first, last, highest and the lowest
Sparkline(
  data: data,
  kLine: ['max', 'min', 'first', 'last'],
),

cubic smoothing example screenshot

Grid Line
Sparkline(
  gridLinelabelPrefix: '\$',
  gridLineLabelPrecision: 3,
  enableGridLines: true,
),

cubic smoothing example screenshot

Animation Line

Online Demo

AnimatedBuilder(
  animation: AnimationController(duration: const Duration(seconds: 1), vsync: this),
  builder: (context, child) => Sparkline(
    data: [0.0, 1.0, 1.5, 2.0, 0.0, 0.0, -0.5, -1.0, -0.5, 0.0, 0.0],
    animationController: _controller,
    pointsMode: PointsMode.all,
    pointSize: 8.0,
  ),
),

Todo:
  • [x] simple sparkline
  • [x] custom line width
  • [x] custom line color
  • [x] optional rounded corners
  • [x] fill
  • [x] embiggen individual points/change color
  • [x] different points modes [all/last/none]
  • [ ] animate between two sparklines
  • [x] animate drawing a single sparkline
  • [ ] gesture detector to select closest point to tap
  • [x] baseline
  • [x] different fill modes [above/below/none]
  • [x] fix edge points overflowing by offsetting by lineWidth
  • [x] better corner rounding
  • [x] axis labels
  • [x] gradient shader on line paint
  • [x] gradient shader on fill paint
  • [ ] multiple overlapping sparklines on a shared axis

Kategorien

Quell-Repository

Projekte, die dieses Paket verwenden

Noch keine Daten verfügbar.