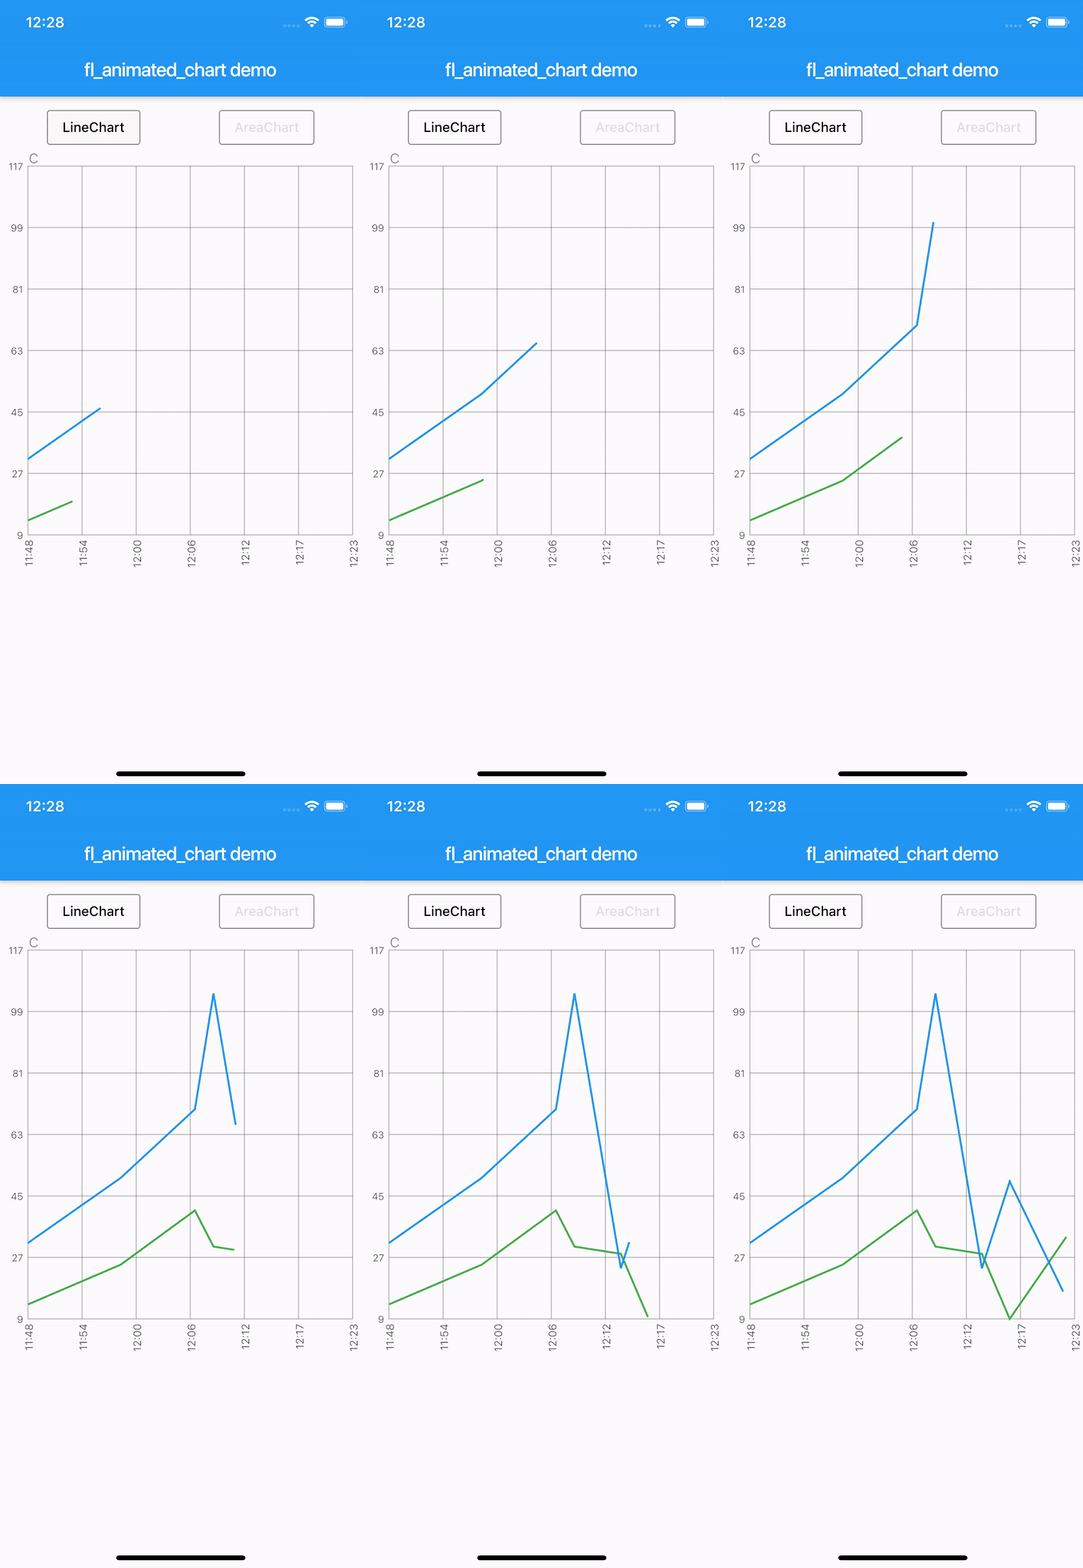
Aus öffentlichen Paketdaten erstellte Orientierung.
fl_animated_linechart ist ein Flutter-Paket zum Erstellen animierter Liniendiagramme und Flächendiagramme mit reibungslosem Performance sogar bei großen Datensätzen. Es unterstützt mehrere Y-Achsen zur Vergleichbarkeit unterschiedlicher Datenbereiche und verfügt über eine zeitbasierte X-Achse, ideal für Zeitreihenvisualisierungen. Das Paket ist für Reaktionsfähigkeit auf verschiedenen Plattformen optimiert und eignet sich daher hervorragend für Echtzeit- oder dynamische Datenanzeige. Aufbauend auf dem Rendering-Engine von Flutter gewährleistet es flüssige Animationen und effiziente Aktualisierungen ohne Einbußen an visueller Qualität.
Anwendungsfälle
Echtzeit-Datenüberwachung
Zeitreihenanalyse
Multi-Metrik-Dashboards
Finanzgrafiken
Interaktive Datenexploration
Hauptmerkmale
Animierte Übergänge
Unterstützung mehrerer Y-Achsen
Datums-/Zeit-Achse X
Hohe Leistungsfähigkeit bei großen Datenmengen
Plattformübergreifende Kompatibilität
Geeignet für
Datenvisualisierungs-Apps
Dashboard-Entwickler
Analysetools
Mobile- und Web-Analytik
Echtzeit-Tracking-Schnittstellen
Hinweise
Erfordert sorgfältige Behandlung großer Datensätze, um die Bildwiederholungsfrequenz beizubehalten
Eingeschränkte Anpassungsmöglichkeiten außerhalb der Kerngrafiktypen
Für komplexe Benutzeroberflächen kann zusätzliche Stilisierung erforderlich sein
Am besten geeignet für lineare oder zeitbasierte Datenmuster
Benötigt externe Abhängigkeiten für erweiterte Funktionen
Original-README
Originaler README-Schnappschuss aus dem verknüpften Quell-Repository. Aktuelle Inhalte finden Sie im Repository.
fl_animated_linechart
An animated chart library for flutter.
Support for datetime axis
Multiple y axis, supporting different units
Highlight selection
Animation of the chart
Possibility of adding legends
Support for both horizontal and vertical markerlines
Tested with more than 3000 points and still performing
There are currently two different charts:
line chart
area chart
Getting Started
Try the sample project or include in your project.
Highlight for the line chart:
Linechart with markerlines, icons, legends and "heat-map" shaded zones:
You can choose to either have a short line or an Icon as the first part of the legend before the title. It is possible set showLeadingLine to true, then a short line will be shown in the color you have defined.
You can change the Color of the line and Icon, and the TextStyle of the String title.
The length of the Legends list must to equal to the length of chartlines which have isMakerLine = true.
When orientation of the screen is in landscape mode, it is possible to have the legends drawn on the right hand side instead of below the graph.
Simply set legendsRightLandscapeMode: true
returnScaffold(
appBar: AppBar(
title: Text(widget.title),
),
body: Container(
child: Column(
mainAxisSize: MainAxisSize.max,
mainAxisAlignment: MainAxisAlignment.spaceBetween,
crossAxisAlignment: CrossAxisAlignment.stretch,
children: [
Expanded(
child: AnimatedLineChart(
lineChart,
toolTipColor: Colors.white,
gridColor: Colors.black54,
textStyle: TextStyle(fontSize: 10, color: Colors.black54),
showMarkerLines:
true, // If this value is not set to true, all defines lines will be filled lines and not dashed
legends: [
Legend(title: 'Critical', color: Colors.red, showLeadingLine: true),
Legend(title: 'Warning', color: Colors.yellow, Icon(Icons.report_problem_rounded, size: 17, color: Colors.yellow)),
],
legendsRightLandscapeMode: true,
),
),
],
),
),
);
Example code with horizontal and vertical markerlines along with icons on the chart and legends:
It is possible to define a maximum of two vertical markerlines.
The verticalMarker variable is a List<DateTime> and the length can be >= 2.
If two vertical markerlines are defined, the area between the two lines will be filled with a color that can be defined with verticalMarkerColor.
It is possible to add an Icon on the point where the vertical markerline crosses the y-axis value by defining the verticalMarkerIcon.
The verticalMarkerIcon variable takes a List<Icon> and the lenght must be equal to the length of the verticalMarker variable.
The possibility of adding a colored background to the icons have been added and can be defined with iconBackgroundColor which takes a Color.
returnScaffold(
appBar: AppBar(
title: Text(widget.title),
),
body: Container(
child: Column(
mainAxisSize: MainAxisSize.max,
mainAxisAlignment: MainAxisAlignment.spaceBetween,
crossAxisAlignment: CrossAxisAlignment.stretch,
children: [
Expanded(
child: AnimatedLineChart(
lineChart,
toolTipColor: Colors.white,
gridColor: Colors.black54,
textStyle: TextStyle(fontSize: 10, color: Colors.black54),
showMarkerLines:
true, // If this value is not set to true, all defines lines will be filled lines and not dashed
legends: [
Legend(title: 'Critical', color: Colors.red),
Legend(title: 'Warning', color: Colors.yellow),
],
verticalMarker:[
DateTime.parse('2012-02-27 12:54:00'),
DateTime.parse('2012-02-27 13:16:00')
],
verticalMarkerColor: Colors.yellow,
verticalMarkerIcon: [
Icon(
Icons.report_problem_rounded,
color: Colors.yellow,
),
Icon(
Icons.check_circle_rounded,
color: Colors.green,
),
],
iconBackgroundColor: Colors.white,
),
),
],
),
),
);
Example code with shaded area between markerlines:
It is possible to have shaded areas between the defined markerlines.
The shaded area will be in the same color as the markerline.
It is important that the order of enums in the List<MaxMin> filledMarkerLinesValues matches the order of defined markerlines to be shown in the graph.
Enums with the value MaxMin.MAX will draw to the top if there is only one markerline defined as MAX, otherwise it will draw from i - 1 where enum values are MAX.
If enum value is MaxMin.MIN the shaded area will draw downwards to i + 1, unless the index is the last in the list, then the shaded area will draw all the way to the bottom of the graph.