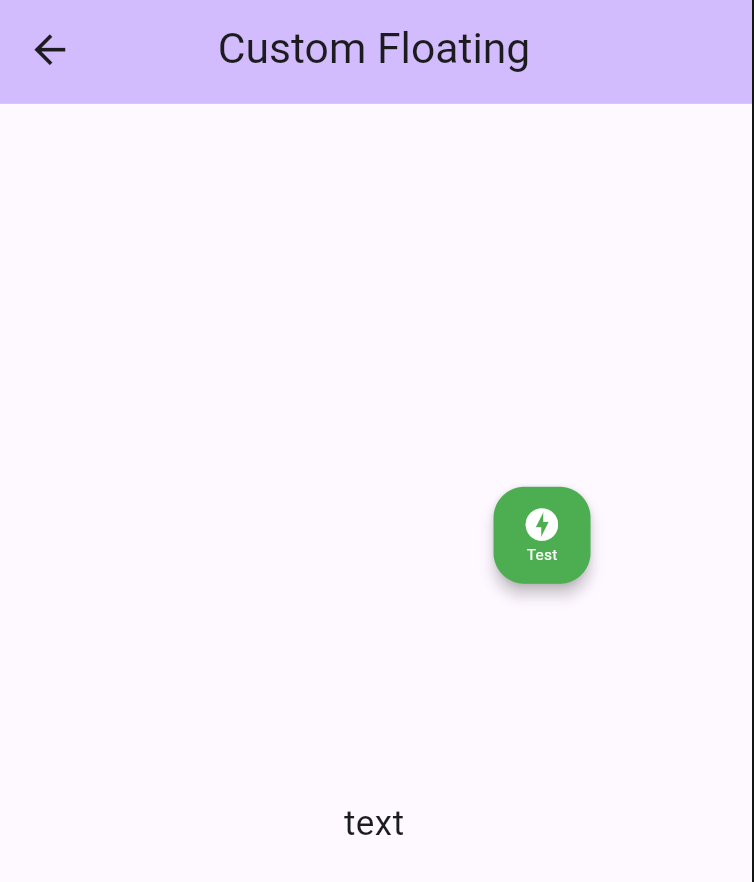
Aus öffentlichen Paketdaten erstellte Orientierung.
floating_logger ist ein Flutter-Paket, das ein schwebendes Widget bereitstellt, um während der App-Entwicklung Echtzeit-API-Anfrageprotokolle anzuzeigen. Es hilft Entwicklern, Netzwerkaktivitäten einfach zu überwachen, indem es Details wie Anfrage-URLs, Methoden, Antwortzeiten und Statuscodes anzeigt. Das Widget schwebt auf dem Bildschirm und ist somit problemlos zugänglich, ohne den Benutzerfluss zu stören. Für Debugging und Tests konzipiert, integriert es sich nahtlos in Flutter-Apps auf mehreren Plattformen. Ideal für Teams, die eine schnelle Sichtbarkeit des API-Verhaltens benötigen, ohne auf externe Tools angewiesen zu sein.
Anwendungsfälle
Echtzeit-API-Monitoring während der Entwicklung
Debuggen von Netzwerkanfragen in Flutter-Apps
Schnelle Überprüfung der HTTP-Aufrufdetails
Verbesserung der Teamzusammenarbeit bei API-Problemen
API-Leistung unter verschiedenen Bedingungen testen
Hauptmerkmale
Schwebende Benutzeroberfläche für kontinuierliche Protokollansicht
Echtzeit-Anzeige von API-Anfrage-/Antwortdaten
Unterstützt alle wichtigen Desktop- und Mobilplattformen
Minimale Einrichtung mit einem Befehl
Anpassbare Protokollfilterung und -gestaltung
Geeignet für
Flutter-Entwickler im aktiven Entwicklungsprozess
Teams, die sich auf die API-Debugging konzentrieren
Apps, die häufige Netzwerktests erfordern
Frontend-Entwickler, die mit REST-APIs arbeiten
Projekte, bei denen eine schnelle Rückmeldung bei Netzwerkaufrufen entscheidend ist
Hinweise
Nicht für den Produktiveinsatz vorgesehen
Kann die Leistung beeinträchtigen, wenn zu viel Daten protokolliert werden
Benötigt manuelle Entfernung vor der App-Freigabe
Beschränkt auf Debug-Builds
Die Benutzeroberfläche kann den Bildschinninhalt auf kleineren Geräten verdecken
Original-README
Originaler README-Schnappschuss aus dem verknüpften Quell-Repository. Aktuelle Inhalte finden Sie im Repository.
floating_logger 🚀
floating_logger is a Flutter library designed to help developers debug and test API calls with ease. It provides a floating widget that allows you to monitor API requests in real-time and even copy the curl command for quick testing. Perfect for anyone who wants to streamline the development and debugging process! ⚡
📌 Features
✅ Advanced Search & Deep Debugging - Search log path, headers, body, response, and deep JSON content with highlighting and auto-expansion
✅ Dynamic Search Navigation - Easily navigate through multiple search matches with up/down arrows
🎚 Toggle Floating Logger Visibility Using Preferences
Use ValueNotifier to toggle the logger visibility dynamically. This allows you to enable or disable the logger and persist the setting across app sessions.
You can easily customize the appearance of your floating logger widget by using the style property. This allows you to adjust the background color, tooltip, icon, and even the size of the floating widget to match your app’s theme. 🎨✨
backgroundColor: Set a vibrant color to make your floating widget stand out.
tooltip: Add a custom tooltip text to provide helpful hints when hovering over the widget.
icon: Choose an icon (like offline_bolt, info, etc.) and customize its size, color, and appearance.
size: Adjust the size using Size class to adjust floating widget size.
🛠️ Adding a Single Custom Interceptor
To add a single custom interceptor to DioLogger, you can use the addInterceptor method. Here’s an example of adding a custom InterceptorsWrapper that handles the onResponse and onError events.
/// Example to add a custom single interceptorDioLogger.instance.addInterceptor(
InterceptorsWrapper(
onResponse: (response, handler) {
// Add custom logic for onResponseprint('Custom onResponse interceptor');
handler.next(response);
},
onError: (error, handler) {
// Add custom logic for onErrorprint('Custom onError interceptor');
handler.next(error);
},
),
);
Explanation:
onResponse : This is triggered when a successful response is received. You can add custom logic here, such as logging or modifying the response.
onError : This is triggered when an error occurs. You can handle errors, log them, or perform recovery actions.
handler.next() : This ensures the interceptor chain continues to the next interceptor or the final handler.
🛠️ Add List Custom Interceptor
If you want to add multiple interceptors at once, you can use the addListInterceptor method. This is useful when you have several interceptors that need to be applied together.
Here’s an example:
DioLogger.instance.addListInterceptor(
[
InterceptorsWrapper(
onResponse: (response, handler) {
// Add custom logic for onResponseprint('Custom onResponse interceptor');
handler.next(response);
},
onError: (error, handler) {
// Add custom logic for onErrorprint('Custom onError interceptor');
handler.next(error);
},
),
// You can add more interceptors in the list
],
);
Explanation:
List of Interceptors: You can define multiple InterceptorsWrapper objects in a list. Each interceptor will be executed in the order they are added.
Order Matters: The first interceptor in the list will be executed first, followed by the next, and so on.
⚡ Network Simulator (Built-in)
floating_logger comes with a powerful Network Simulator built right in! No extra packages needed. You can easily simulate different network conditions to test how your app handles:
Normal: Standard network behavior.
Slow: Simulates a 3-second delay (configurable).
Offline: Simulates no internet connection (throws error).
floating_logger is a powerful tool that simplifies debugging API calls in Flutter applications. Whether you need to inspect responses, copy cURL commands, or customize the UI, this package provides a seamless experience for developers. Integrate it today and streamline your debugging process! 🚀