Aus öffentlichen Paketdaten erstellte Orientierung.
Ein Flutter-Paket zum Erstellen animierter Radial- und Kreisdiagramme. Es bietet reibungslose, anpassbare Visualisierungen, die ideal sind, um prozentuale Daten in einer kompakten, visuell ansprechenden Form darzustellen. Die Diagramme unterstützen dynamische Aktualisierungen und sind so gestaltet, dass sie nahtlos in Flutter-Anwendungen integriert werden können. Mit einfachen Konfigurationsoptionen können Entwickler ansprechende kreisförmige Diagramme für Dashboards, Statistiken oder Fortschrittsindikatoren problemlos erstellen.
Anwendungsfälle
Prozentsätze anzeigen
Erstellen von Dashboard-Widgets
Visualisierung von Fortschrittsmetriken
Interaktive Berichte erstellen
Verbesserung der App-Oberfläche durch Animationen
Hauptmerkmale
Animierte Übergänge
Radial- und Tortendiagrammtypen
Anpassbare Farben und Beschriftungen
reaktives Design
Einfache Integration mit Flutter
Geeignet für
Datenvisualisierungsanwendungen
Dashboard-Oberflächen
Fortschrittsverfolgungsfunktionen
Lernhilfsmittel
Mobile Analytics-Dashboards
Hinweise
Beschränkt auf kreisförmige Diagrammtypen
Minimale Anpassung für komplexe Layouts
Keine integrierten Tooltips oder Interaktionen
Am besten geeignet für einfache Datensätze
Erfordert manuelle Behandlung großer Datensätze
Original-README
Originaler README-Schnappschuss aus dem verknüpften Quell-Repository. Aktuelle Inhalte finden Sie im Repository.
Flutter Circular Chart
A library for creating animated circular chart widgets with Flutter, inspired by Zero to One with Flutter.
Overview
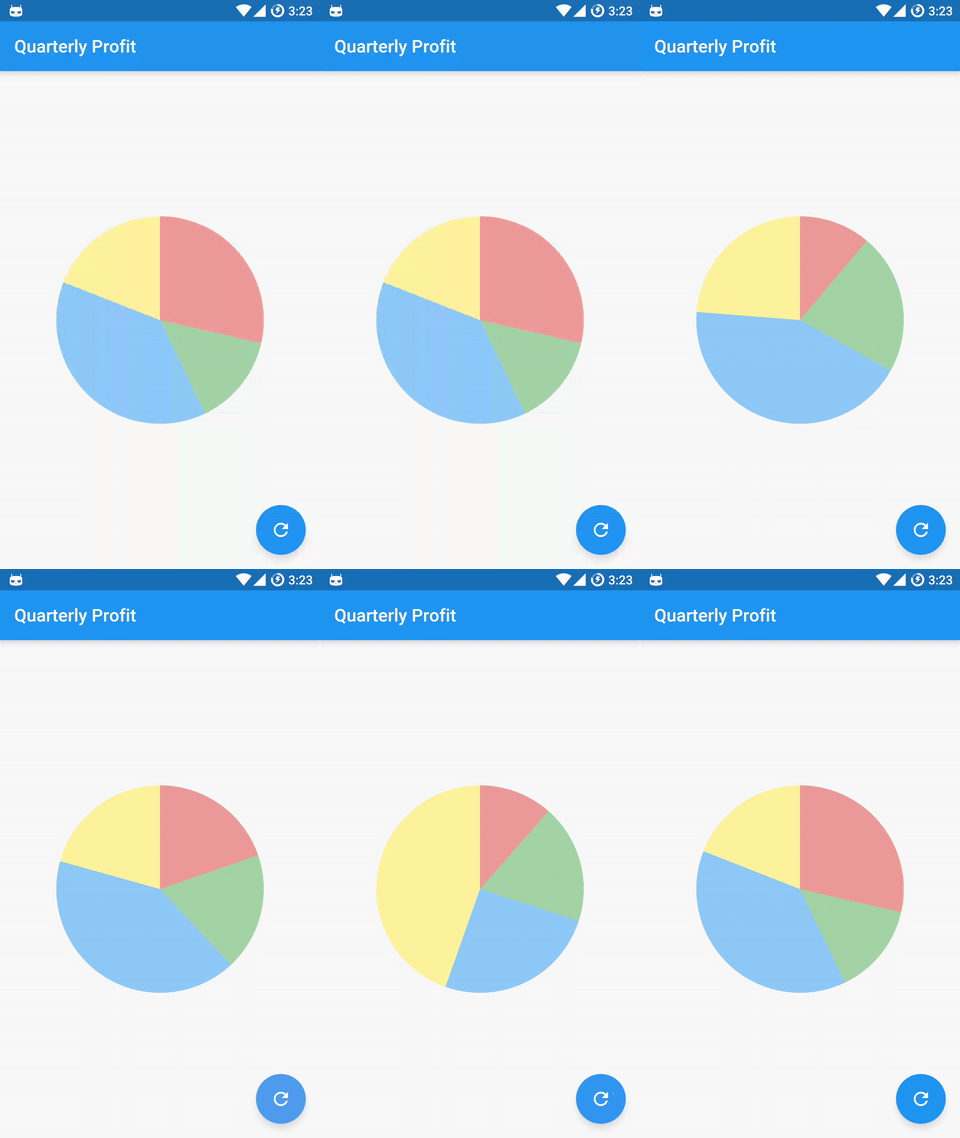
Create easily animated pie charts and radial charts by providing them with data objects they can plot into charts and animate between.
Check the examples folder for the source code for the above screenshots.
Charts expect a list of CircularStackEntry objects containing the data they need to be drawn.
Each CircularStackEntry corresponds to a complete circle in the chart. For radial charts that is one of the rings, for pie charts it is the whole pie.
Radial charts with multiple CircularStackEntrys will display them as concentric circles.
Each CircularStackEntry is composed of multiple CircularSegmentEntrys containing the value of a data point. In radial charts a segment corresponds to an arc segment of the current ring, for pie charts it is an individual slice.