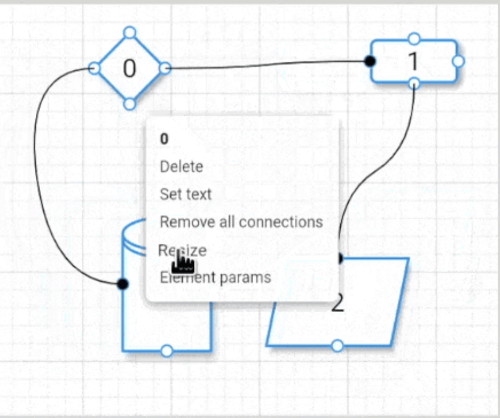
Aus öffentlichen Paketdaten erstellte Orientierung.
Flutter Flow Chart ist ein Visualisierungspaket, das Entwicklern ermöglicht, interaktive Flussdiagramme mit anpassbaren Elementen wie Knoten, Verbindungen und Stilen zu erstellen. Es unterstützt dynamische Layoutanpassungen und ermöglicht das Speichern von Dashboards für zukünftige Nutzung, wodurch die Arbeitsablaufkontinuität verbessert wird. Ideal für Anwendungen, die eine diagrammatische Darstellung von Prozessen oder Datenflüssen erfordern, läuft es auf allen wichtigen Plattformen wie Android, iOS, Web, macOS, Windows und Linux. Das Paket lässt sich nahtlos in Flutter-Anwendungen integrieren und bietet Flexibilität und Skalierbarkeit für komplexe Visualisierungen.
Anwendungsfälle
Prozessmodellierung
Datenflussvisualisierung
Interaktive Dashboards
Workflow-Design
Lernhilfsmittel
Systemarchitektur-Diagramme
Hauptmerkmale
Anpassbare Knoten und Verbindungen
Dashboard speichern/laden
Plattformübergreifende Unterstützung
interaktive Diagrammedition
Reaktives Layout
erweiterbares Design-System
Geeignet für
Entwickler, die diagrammintensive Apps erstellen
Pädagogen, die visuelle Lernmaterialien erstellen
Geschäftsanalysten gestalten Workflows
Software-Architekten visualisieren Systeme
Hinweise
Benötigt manuelle Konfiguration für erweiterte Layouts
Eingeschränkte integrierte Vorlagen
Die Leistung kann bei großen Diagrammen variieren
Lernkurve für komplexe Interaktionen
Keine integrierte Exportfunktion
Original-README
Originaler README-Schnappschuss aus dem verknüpften Quell-Repository. Aktuelle Inhalte finden Sie im Repository.
Flutter Flow Chart
A package that let you draw a flow chart diagram with different kinds of customizable elements. Dashboards can be saved for later use.
then use the _dashboard_ variable to add, remove, resize, etc. elements or load/save the dashboard.

In the [example](https://github.com/alnitak/flutter_flow_chart/blob/master/example/lib/main.dart), the [StarMenu](https://pub.dev/packages/star_menu) package is used to easily interact with user inputs.
The Dashboard
The **Dashboard** object contains all the methods described below used to interact with the flow chart.

| **relevant methods**       | **description**                                                                                                          |
| -------------------------- | ------------------------------------------------------------------------------------------------------------------------ |
| _setGridBackgroundParams_  | set grid background parameters                                                                                           |
| _setHandlerFeedbackOffset_ | set the feedback offset to help on mobile device to see the end of arrow and not hiding behind the finger when moving it |
| _setElementResizable_      | set the element as resizable. A handle will be displayed on the bottom right and will disappear when finish resizing     |
| _addElement_               | add a _FlowElement_ to the dashboard                                                                                     |
| _removeAllElements_        | remove all elements                                                                                                      |
| _removeElementConnection_  | remove the given handler connection of the given element                                                                 |
| _removeElementConnections_ | remove all the connections from the given element                                                                        |
| _removeElementById_        | remove all the elements with the given id from the dashboard                                                             |
| _removeElement_            | remove the given element                                                                                                 |
| _addNextById_              | make a connection from the given sourceElement to the elements with the given id                                         |
| _recenter_                 | Recenter the dashboard relative to the first element in the element array                                                |
| _saveDashboard_            | save the dashboard into the given file path                                                                              |
| _loadDashboard_            | clear the dashboard and load the new one                                                                                 |
| _setZoomFactor_            | Zoom the entire dashboard and content by the given factor corresponding to the given epicenter                           |
| _dissectElementConnection_ | Dissect the connection into two segments from the given point. Only available on ArrowStyle.segmented                    |
| _dissectElementConnection_ | Remove dissection by the given pivot                                                                                     |
| _setArrowStyle_            | Update arrow style for single connection using the source and destination elements                                       |
The FlowElement
The _FlowElement_ defines the element kind with its position, size, colors and so on.

| **properties**    | **type**               | **description**                                                              |
| ----------------- | ---------------------- | ---------------------------------------------------------------------------- |
| _position_        | Offset                 | The position of the _FlowElement_                                            |
| _size_            | Size                   | The size of the _FlowElement_                                                |
| _text_            | String                 | Element text                                                                 |
| _textColor_       | Color                  | Text color                                                                   |
| _fontFamily_      | String                 | Text font family                                                             |
| _textSize_        | double                 | Text size                                                                    |
| _textIsBold_      | bool                   | Makes text bold if true                                                      |
| _kind_            | ElementKind            | Element shape: enum {rectangle, diamond, storage, oval, parallelogram}       |
| _handlers_        | List<Handler>          | Connection handlers: enum {topCenter, bottomCenter, rightCenter, leftCenter} |
| _handlerSize_     | Size                   | The size of element handlers                                                 |
| _backgroundColor_ | Size                   | Background color of the element                                              |
| _borderColor_     | Size                   | Border color of the element                                                  |
| _borderThickness_ | Size                   | Border thickness of the element                                              |
| _elevation_       | Size                   | Shadow elevation                                                             |
| _next_            | List<ConnectionParams> | Shadow elevation                                                             |

| **relevant methods** | **description**                                                                                                                      |
| -------------------- | ------------------------------------------------------------------------------------------------------------------------------------ |
| _setIsResizing_      | When setting to true, a handler will disply at the element bottom right to let the user to resize it. When finish it will disappear. |
| _setText_            | Set element text                                                                                                                     |
| _setTextColor_       | Set text color                                                                                                                       |
| _setTextSize_        | Set text size                                                                                                                        |
| _setTextIsBold_      | Set text bold                                                                                                                        |
| _setBackgroundColor_ | Set background color                                                                                                                 |
| _setBorderColor_     | Set border color                                                                                                                     |
| _setBorderThickness_ | Set border thickness                                                                                                                 |
| _setElevation_       | Set elevation                                                                                                                        |
| _changePosition_     | Change element position in the dashboard                                                                                             |
| _changeSize_         | Change element size                                                                                                                  |
Examples
Add an element to Dashboard
Dashboard dashboard = Dashboard();
////////////////////////////////////// Define 2 elementsFlowElement element1 = FlowElement(
/// position in the local dashboard coordinates
position: constOffset(100, 100),
/// element size
size: constSize(100, 100),
/// text to show
text: 'diamond',
/// rectangle, diamond, storage, oval or parallelogram element kind
kind: ElementKind.diamond,
/// which handler to make active
handlers: [
Handler.bottomCenter,
Handler.topCenter,
Handler.leftCenter,
Handler.rightCenter,
]);
FlowElement element2 = FlowElement(
position: constOffset(300, 100),
size: constSize(100, 150),
text: 'rect',
kind: ElementKind.rectangle,
handlers: [
Handler.bottomCenter,
Handler.topCenter,
Handler.leftCenter,
Handler.rightCenter,
]);
////////////////////////////////////// Add the element to Dashboard
dashboard.addElement(element);
////////////////////////////////////// Connect right handler of element1/// to the left handler of element2
dashboard.addNextById(
element1,
element2.id,
ArrowParams(
thickness: 1.5,
color: Colors.Black,
startArrowPosition: Alignment.centerRight,
endArrowPosition: Alignment.centerLeft,
),
);
////////////////////////////////////// Save/load dashboardDirectory appDocDir = await path.getApplicationDocumentsDirectory();
dashboard.saveDashboard('${appDocDir.path}/FLOWCHART.json');
dashboard.loadDashboard('${appDocDir.path}/FLOWCHART.json');
Adding custom data to FlowElement
The library supports attaching arbitrary data to each element via the generic elementData field. To preserve this data across JSON save/load you must provide a serializer when creating the Dashboard. The serializer implements the DataSerializer<T, JSON> mixin and converts between your data type and a JSON-compatible representation (typically Map<String, dynamic>).
Notes
The Dashboard, FlowChart and FlowElement must use the same generic type T.
If no serializer is provided, elementData will be treated as JSON serializable as it is, but will cause an error when the data is not serializable.
Minimal example
// Serializer that converts ExampleData <-> Map<String, dynamic>classExampleDataSerializerwithDataSerializer<ExampleData, Map<String, dynamic>> {
@overrideExampleData? fromJson(Map<String, dynamic>? source) {
if (source == null) returnnull;
returnExampleData(
name: source['name'] asString,
value: source['value'] asint,
);
}
@overrideMap<String, dynamic>? toJson(ExampleData? data) {
if (data == null) returnnull;
return <String, dynamic>{
'name': data.name,
'value': data.value,
};
}
}
classExampleData{
ExampleData({ requiredthis.name, requiredthis.value });
finalString name;
finalint value;
}
// Create a dashboard that knows how to (de)serialize ExampleDatafinalDashboard<ExampleData> dashboard = Dashboard<ExampleData>(
dataSerializer: ExampleDataSerializer(),
);
// Use the same generic type for the FlowChartFlowChart<ExampleData>(
dashboard: dashboard,
onDashboardTapped: ((context, position) {}),
onDashboardLongtTapped: ((context, position) {}),
onElementLongPressed: (context, element) {},
onElementPressed: (context, element) {},
onHandlerPressed: (context, position, handler, element) {},
onHandlerLongPressed: (context, position, handler, element) {},
onScaleUpdate: (newScale) {},
);
// Create an element with custom datafinalFlowElement<ExampleData> element = FlowElement<ExampleData>(
position: constOffset(300, 100),
size: constSize(100, 150),
text: 'rect',
kind: ElementKind.rectangle,
handlers: [
Handler.bottomCenter,
Handler.topCenter,
Handler.leftCenter,
Handler.rightCenter,
],
elementData: ExampleData(value: 42, name: 'Example Data'),
);
// Save/load will preserve `elementData` thanks to the provided serializerawait dashboard.saveDashboard('${appDocDir.path}/FLOWCHART.json');
await dashboard.loadDashboard('${appDocDir.path}/FLOWCHART.json');
This preserves your custom data across persistence and ensures type-safety when interacting with elements in the UI.
Adding custom element to FlowChart
The library supports custom elements via ElementKind.custom.
When you use ElementKind.custom, provide a customElementBuilder to the FlowChart constructor. The builder is called for each element with kind == ElementKind.custom and must return a Widget.
Minimal example
// flow chart constructionFlowChart(
dashboard: dashboard,
// ...callbacks...// custom element builder: receives (BuildContext, FlowElement<T>)
customElementBuilder: (context, element) =>
SomeCustomWidget(text: element.text),
);
// new element (same as any other element)
dashboard.addElement(
FlowElement(
position: position,
size: constSize(100, 150),
text: '${dashboard.elements.length}',
handlerSize: 25,
handlers: [
Handler.bottomCenter,
Handler.leftCenter,
Handler.rightCenter,
],
elementData: ExampleData(name: 'Example', value: 42),
kind: ElementKind.custom,
),
);
Multiple custom element types
The library does not provide multiple custom builders. Use elementData as a discriminator: store a type/id in your custom data and inspect it inside customElementBuilder to render different widgets.
// element with discriminator
dashboard.addElement(
FlowElement(
position: position,
size: constSize(100, 150),
text: '1',
handlers: [Handler.bottomCenter],
elementData: ExampleData(name: 'Example', value: 42, type: 'STAR'),
kind: ElementKind.custom,
),
);
// builder inspects element.elementDataFlowChart(
dashboard: dashboard,
customElementBuilder: (context, element) {
final data = element.elementData asExampleData?;
if (data?.type == 'STAR') returnStarWidget(data: data);
if (data?.type == 'CIRCLE') returnCircleWidget(data: data);
returnDefaultCustomWidget(text: element.text);
},
);
This keeps the API simple while letting you implement any number of custom element views.