Pakete, Repositories und App-Kategorien suchen

Cover von flutter_sales_graph
Paketdetailsv0.0.5

flutter_sales_graph

Ein Flutter-Paket zum Anzeigen von Verkaufsdaten im Balkendiagramm-Format.

AndroidiOSWebmacOSWindowsLinux
30-Tage-Downloads
36
Likes
9
Pub-Punkte
150

Paket installieren

flutter pub add flutter_sales_graph

Paketübersicht

Aus öffentlichen Paketdaten erstellte Orientierung.

Ein Flutter-Paket, das zur Visualisierung von Verkaufsdaten mit intuitiven Balkendiagrammen entwickelt wurde. Es ermöglicht Entwicklern die einfache Integration von responsive und anpassbaren Balkendiagrammen in ihre Anwendungen, ideal für Dashboards oder Analyse-Oberflächen. Das Paket unterstützt mehrere Plattformen wie Android, iOS, Web, macOS, Windows und Linux und sorgt für eine konsistente Darstellung über alle Plattformen hinweg. Mit einfachen Konfigurationsoptionen rendert es saubere, interaktive Diagramme, die sich an unterschiedliche Datensätze und Bildschirmgrößen anpassen.

Anwendungsfälle

  • Verkaufs-Dashboard-Visualisierung
  • Echtzeit-Datenverfolgung
  • Geschäftsanalyse-Apps
  • E-Commerce-Leistungsüberwachung
  • Berichterstattungstools

Hauptmerkmale

  • Balkenchart-Rendern
  • Plattformübergreifende Unterstützung
  • Anpassbare Farben und Beschriftungen
  • reaktives Design
  • Einfache Integration mit Datenströmen
  • Glatte Animationen

Geeignet für

  • Entwickler, die Geschäftsanwendungen erstellen
  • Ersteller von Analyse-Dashboards
  • E-Commerce-Plattform-Teams
  • Anfänger in der Datenvisualisierung
  • Flutter-Projekte, die Verkaufsmetriken erfordern

Hinweise

  • Erfordert Daten im kompatiblen Format
  • Beschränkt auf Balkendiagrammtyp
  • Für komplexe Benutzeroberflächen kann zusätzliche Stilisierung erforderlich sein
  • Abhängig von der Rendering-Engine von Flutter
  • Nicht geeignet für nicht-verkaufsbezogene Datentypen

Original-README

Originaler README-Schnappschuss aus dem verknüpften Quell-Repository. Aktuelle Inhalte finden Sie im Repository.

flutter_sales_graph

A Flutter package for displaying customizable bar charts for sales data.

Features

  • Displays a bar chart with customizable bar appearance and layout.
  • Supports different time ranges (e.g., Last 7 Days, Last 30 Days, Last 12 Months).
  • Customizable parameters for bar height, width, colors, and labels.

Platforms Supported

  • Android: Yes
  • iOS: Yes
  • Web: Yes
  • Windows: Yes
  • macOS: Yes
  • Linux: Yes

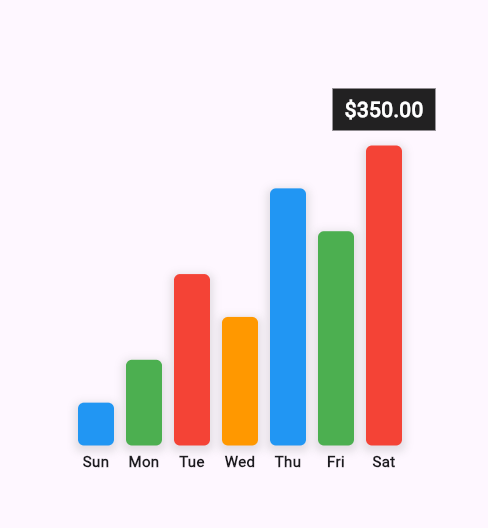
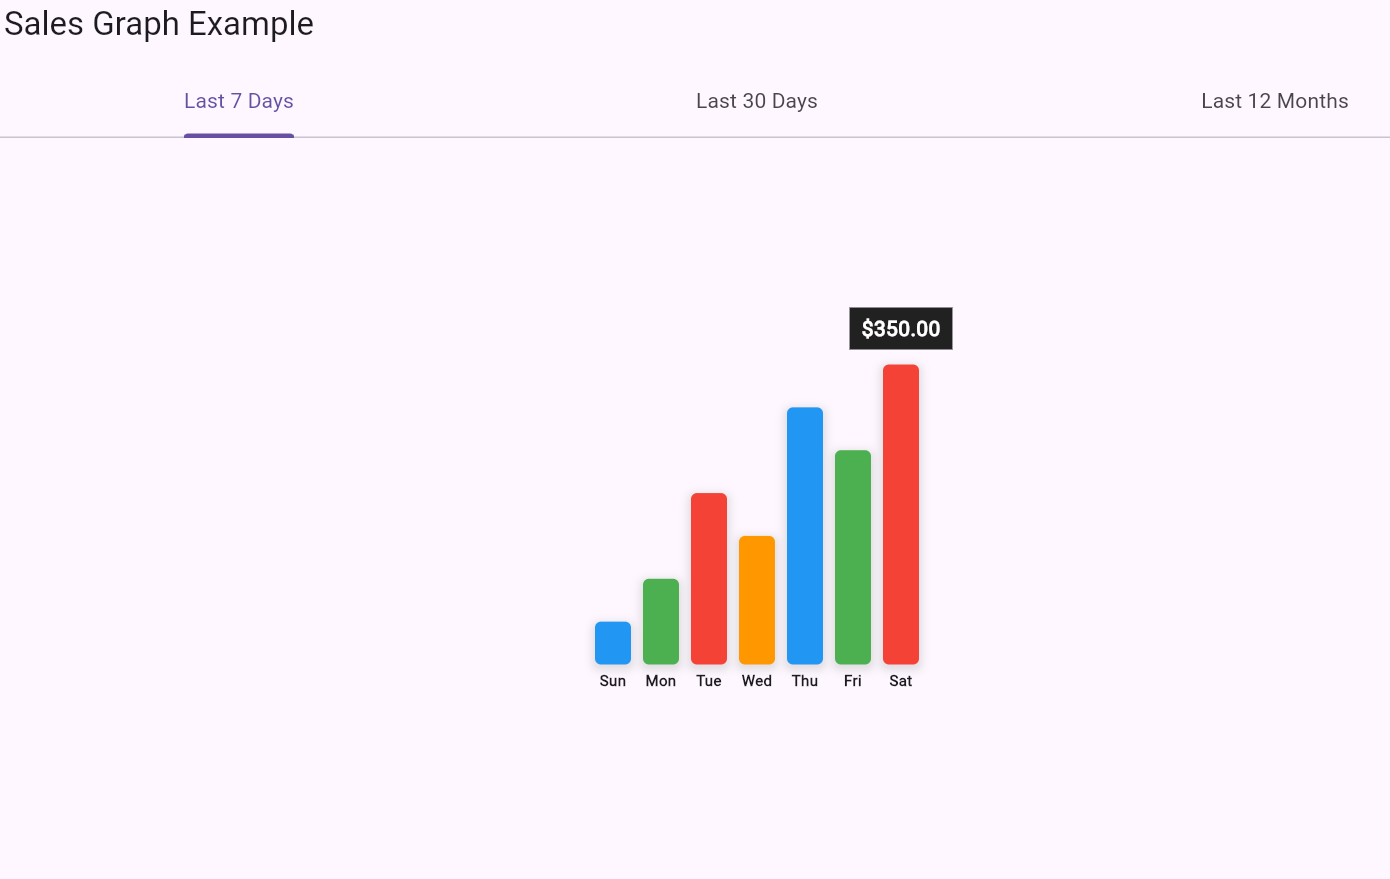
Screenshot

Sales Graph Screenshot

Installation

To use the flutter_sales_graph package in your Flutter project, follow these steps:

  1. Add flutter_sales_graph to your pubspec.yaml file:

    dependencies:
      flutter_sales_graph: ^0.0.5
    
  2. Run flutter pub get to install the package.

Usage

Here’s a basic example of how to use the FlutterSalesGraph widget in your Flutter app:

  1. Import the package:

    import 'package:flutter_sales_graph/flutter_sales_graph.dart';
    
  2. Use the FlutterSalesGraph widget:

     import 'package:flutter/material.dart';
    import 'package:flutter_sales_graph/flutter_sales_graph.dart';
    
    void main() {
    

runApp(MyApp()); }

class MyApp extends StatelessWidget { @override Widget build(BuildContext context) { return MaterialApp( home: Scaffold( appBar: AppBar(title: Text('Sales Graph Example')), body: Center( child: FlutterSalesGraph( salesData: [100, 200, 150, 300, 250, 350], labels: ['Jan', 'Feb', 'Mar', 'Apr', 'May', 'Jun'], maxBarHeight: 250.0, barWidth: 30.0, colors: [Colors.blue, Colors.green, Colors.red], dateLineHeight: 20.0, ), ), ), ); } }

```

Parameters

  • salesData: A List<double> representing the sales values. Must be non-empty.
  • labels: A List<String> representing the labels corresponding to each bar. Must be non-empty and the same length as salesData.
  • selectedRange: A String to indicate the selected time range for the graph. (For display purposes; not functional in this package).
  • maxBarHeight: A double specifying the maximum height of the bars in the graph.
  • barWidth: A double specifying the width of each bar in the graph.
  • colors: A List<Color> providing the colors for the bars.
  • dateLineHeight: A double specifying the height of the labels below the bars.

Example

For a full example of how to use this package, see the example directory in the GitHub repository.

Development

If you’d like to contribute to this package, please follow these guidelines:

  1. Fork the repository:

    • Click the "Fork" button on the top-right corner of github page.
  2. Clone your fork:

    git clone https://github.com/AsherAyub80/flutter_sales_graph.git
    
    
  3. Create a branch for your changes:

    git checkout -b feature/your-feature-name
    
  4. Make your changes and commit them:

          git add .
          git commit -m "Add feature: your feature description"
    
  5. Push your changes:

        git push origin feature/your-feature-name
    
  6. Create a pull request:

    Go to the repository on GitHub and click the "New Pull Request" button.

Kategorien

Quell-Repository

Projekte, die dieses Paket verwenden

Noch keine Daten verfügbar.