Pakete, Repositories und App-Kategorien suchen

Cover von graphify
Paketdetailsv1.2.1

graphify

Eine Datenvisualisierungs-Charts-Bibliothek, basierend auf Apache Echarts, die fortgeschrittene Diagramme wie WebGL 3D, Balken, Linien, Kerzen, Radar, Graph, Baum usw. erstellen kann.

AndroidiOSWebmacOSWindows
30-Tage-Downloads
695
Likes
45
Pub-Punkte
135

Paket installieren

flutter pub add graphify

Paketübersicht

Aus öffentlichen Paketdaten erstellte Orientierung.

Graphify ist ein Flutter/Dart-Paket zur Erstellung fortgeschrittener Datenvisualisierungen auf Basis von Apache Echarts. Es unterstützt eine Vielzahl von Diagrammtypen, darunter WebGL 3D, Balken-, Liniendiagramme, Kerzen diagramme, Radar-, Graph- und Baumdiagramme. Für den plattformübergreifenden Einsatz konzipiert, läuft es nahtlos auf Android, iOS, Web, macOS und Windows. Die Bibliothek ermöglicht Entwicklern die Erstellung interaktiver und leistungsstarker Visualisierungen mit minimalem Aufwand. Ideal für Dashboards, Analyse-Apps und datengesteuerte Oberflächen bringt Graphify leistungsstarke Chart-Funktionen direkt in Flutter-Anwendungen.

Anwendungsfälle

  • Interaktive Dashboards
  • Echtzeit-Datenüberwachung
  • Finanz-Diagramme
  • Datenanalyseplattformen
  • wissenschaftliche Visualisierung

Hauptmerkmale

  • Unterstützt WebGL 3D-Diagramme
  • Mehrere Diagrammtypen (Balken, Linie, Kerzen, usw.)
  • Plattformübergreifende Kompatibilität
  • Leistungsstarkes Rendern
  • Einfache Integration mit Flutter
  • Anpassbare visuelle Themen

Geeignet für

  • Datenanalysten
  • Dashboard-Entwickler
  • Finanz-App-Ersteller
  • Bildungssoftware
  • Visualisierungsorientierte Apps

Hinweise

  • Erfordert Verständnis von Echarts-Konzepten
  • Kann aufgrund von WebGL eine größere Paketgröße haben
  • Eingeschränkte native Flutter-Widget-Anpassung
  • Am besten geeignet für komplexe Visualisierungen, nicht für einfache Diagramme
  • Abhängig von der externen Echarts-Bibliothek

Original-README

Originaler README-Schnappschuss aus dem verknüpften Quell-Repository. Aktuelle Inhalte finden Sie im Repository.

graphify_banner

Pub Package GitHub Repo stars GitHub closed issues GitHub open issues GitHub contributors Contributing

GRAPHIFY

A data visualization charts library, based on Apache Echarts, able to build advanced charts like WebGL 3D, Bar, Line, Candlestick, Radar, Graph, Tree etc.

A Flutter package that serves as a bridge to Apache ECharts for creating interactive charts and data visualizations in your Flutter applications.

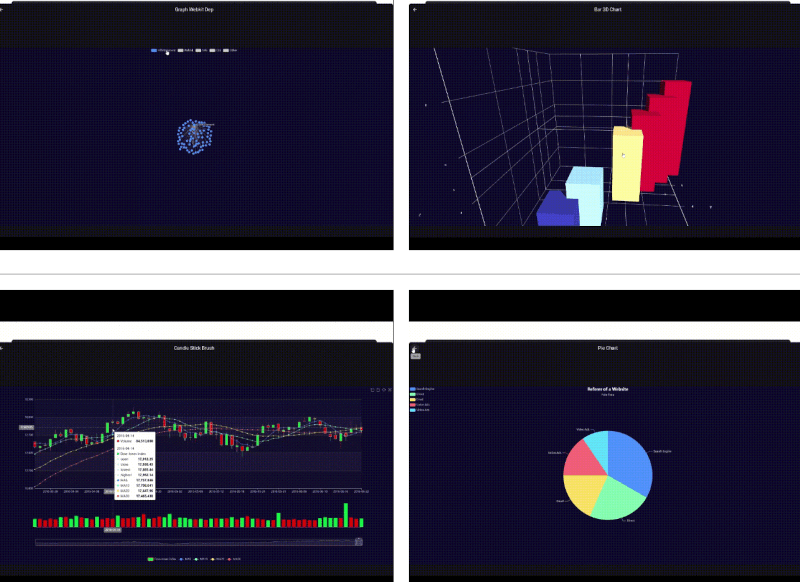
graph_webkit_dep bar_3d_chart
candle_stick_brush all

See demo
Echarts Examples
Pub.dev

Content

Features
Installation
Quick Start
Basic Example
Parameters and Settings
License
Contributing

Features

  • Apache ECharts Integration: Leverage the full power of Apache ECharts directly within your Flutter app.
  • Flexible Configuration: Pass chart configurations as JSON to render interactive visualizations.
  • All ECharts Features: You can find here eCharts features

Installation

How quickly you can install the package you can find here.

Quick Start

Importing the Package

Import the package into your Dart file:

import 'package:graphify/graphify.dart';
Basic Example

Below is a minimal example demonstrating how to display a bar chart:

class BasicBarChart extends StatefulWidget {
  const BasicBarChart({super.key});

  @override
  State<BasicBarChart> createState() => _BasicBarChartState();
}

class _BasicBarChartState extends State<BasicBarChart> {

  final controller = GraphifyController();

  @override
  Widget build(BuildContext context) {
    return GraphifyView(
      controller: controller,
      initialOptions: const {
        "xAxis": {
          "type": "category",
          "data": ["Mon", "Tue", "Wed", "Thu", "Fri", "Sat", "Sun"]
        },
        "yAxis": {
          "type": "value"
        },
        "series": [
          {
            "data": [120, 200, 150, 80, 70, 110, 130],
            "type": "bar"
          }
        ]
      },
    );
  }

  @override
  void dispose() {
    controller.dispose();
    super.dispose();
  }

}

Parameters and Settings

A string containing the JSON configuration for the chart, based on the Apache ECharts documentation.

Documentation and Support

Refer to the Apache ECharts Documentation for detailed configuration options and features. For source code, issue tracking, and contributions, visit the GitHub repository.

License

This project is licensed under the MIT License.

Contributing

We welcome your contributions!

  1. Fork the repository and create a branch for your changes.
  2. Commit your changes with clear messages.
  3. Open a pull request describing your work.

For bug reports or feature requests, please open an issue.

Thank you!

Kategorien

Abhängigkeiten

Abhängigkeiten 2 Einträge

Quell-Repository

Projekte, die dieses Paket verwenden

Noch keine Daten verfügbar.