Pakete, Repositories und App-Kategorien suchen

Cover von k_chart_plus_deeping
Paketdetailsv1.0.2-5.2.2.3

k_chart_plus_deeping

Charts-Bibliothek zum Zeichnen von Kerzencharts und Tiefencharts in Exchange-Anwendungen, erfahrener Softwareentwickler, offen für neue Möglichkeiten, kontaktieren Sie mich über Telegram @sandaohaizi.

AndroidiOSWebmacOSWindowsLinux
30-Tage-Downloads
103
Likes
120
Pub-Punkte
140

Paket installieren

flutter pub add k_chart_plus_deeping

Paketübersicht

Aus öffentlichen Paketdaten erstellte Orientierung.

k_chart_plus_deeping ist ein Flutter-Paket, das für die Erstellung fortgeschrittener Finanzcharts entwickelt wurde, einschließlich Kerzen- und Tiefen-Charts, die ideal für Austausch-Anwendungen sind. Es bietet reibungslose, anpassbare Visualisierungen mit Unterstützung für Echtzeit-Datenaktualisierungen. Für erfahrene Entwickler konzipiert, lässt es sich nahtlos in Handels- oder finanzorientierte Apps auf mehreren Plattformen integrieren. Die Bibliothek ist Open Source und wird von einem Entwickler gepflegt, der über Telegram zur Zusammenarbeit bereit ist.

Anwendungsfälle

  • Handelsplattform-Schnittstellen
  • Kryptowährungsbörsen-Dashboards
  • Echtzeit-Marktdatenvisualisierung
  • Finanzanalysetools
  • Anwendung zur Portfolioverfolgung

Hauptmerkmale

  • Darstellung von Kerzenstangen-Diagrammen
  • Tiefenchart-Vizualisierung
  • Plattformübergreifende Kompatibilität
  • Leistungsstarke Rendering
  • Anpassbare Themen und Stile
  • Unterstützung für Echtzeit-Datenströme

Geeignet für

  • Erfahrene Flutter-Entwickler
  • Finanz- und Kryptowährungsanwendungsbauer
  • Exchange-Plattform-Teams
  • Spezialisten für Datenvisualisierung
  • Apps, die interaktive Diagramme erfordern

Hinweise

  • Kenntnisse über Finanzchart-Konzepte erforderlich
  • Am besten geeignet für komplexe Trading-Oberflächen
  • Kann zusätzliche Zustandsverwaltung erfordern
  • Beschränkte Dokumentation außerhalb des GitHub-Repositorys
  • Telegram-Kontakt für direkte Unterstützung erforderlich
Original-README

Originaler README-Schnappschuss aus dem verknüpften Quell-Repository. Aktuelle Inhalte finden Sie im Repository.

K Chart Plus Package Deeping

简体中文 | English

Feature

2024-08-01 Update: Display double volume
2024-07-18 Update: Gesture zoom functionality | Scientific notation support
2024-07-17 Update: EMA indicator added
2024-07-16 Update: Skeleton screen functionality

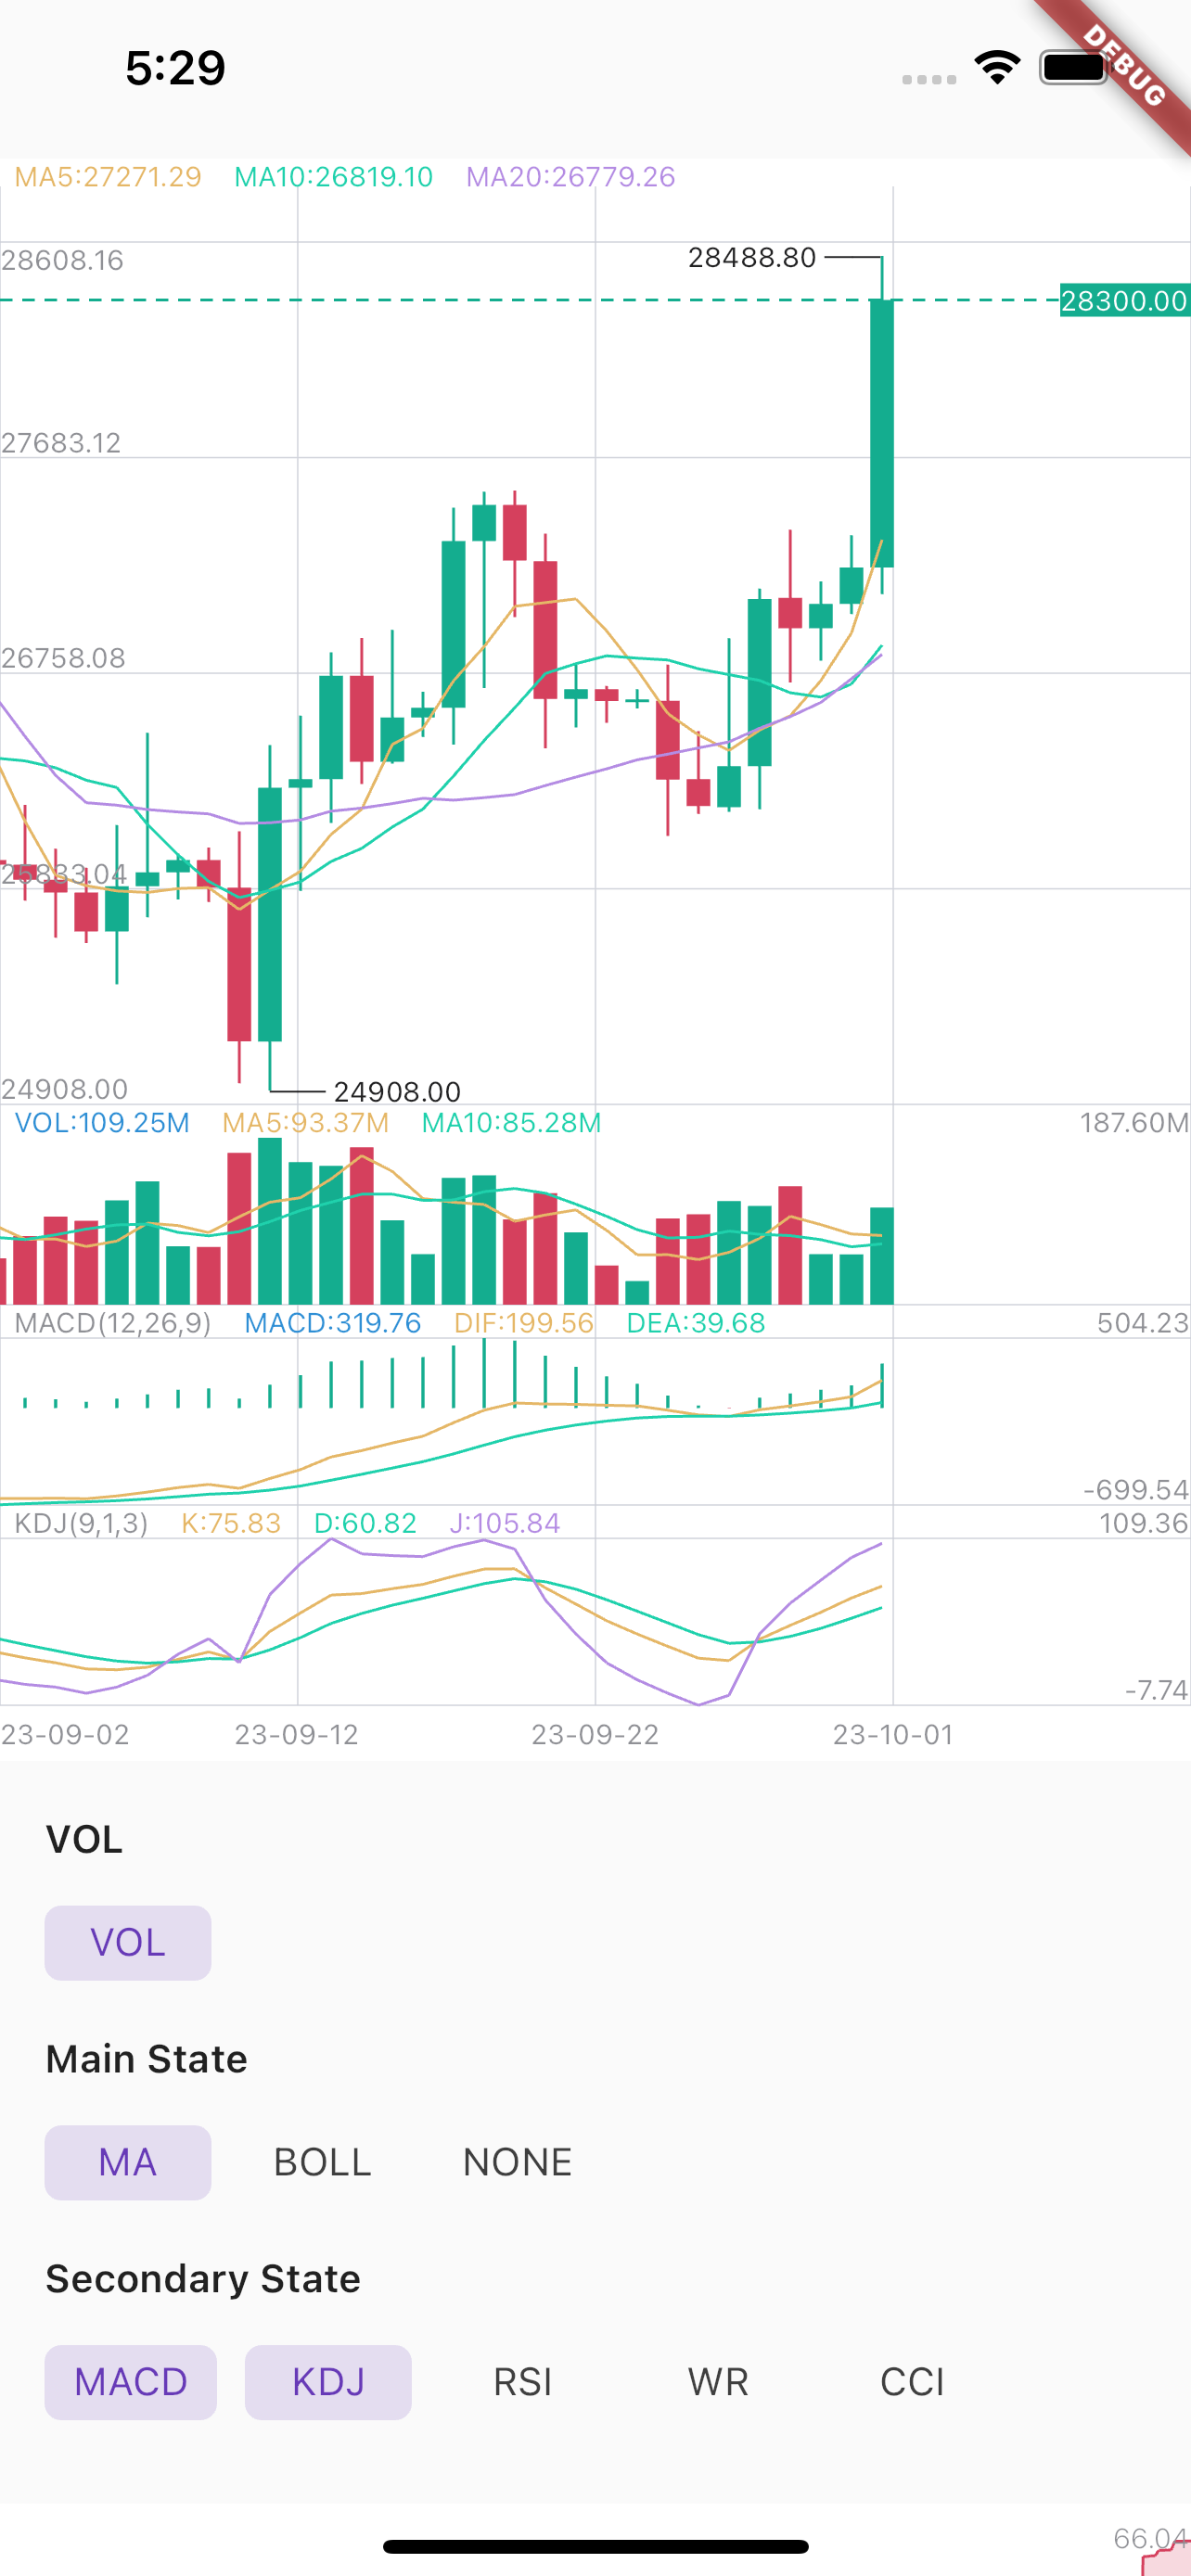
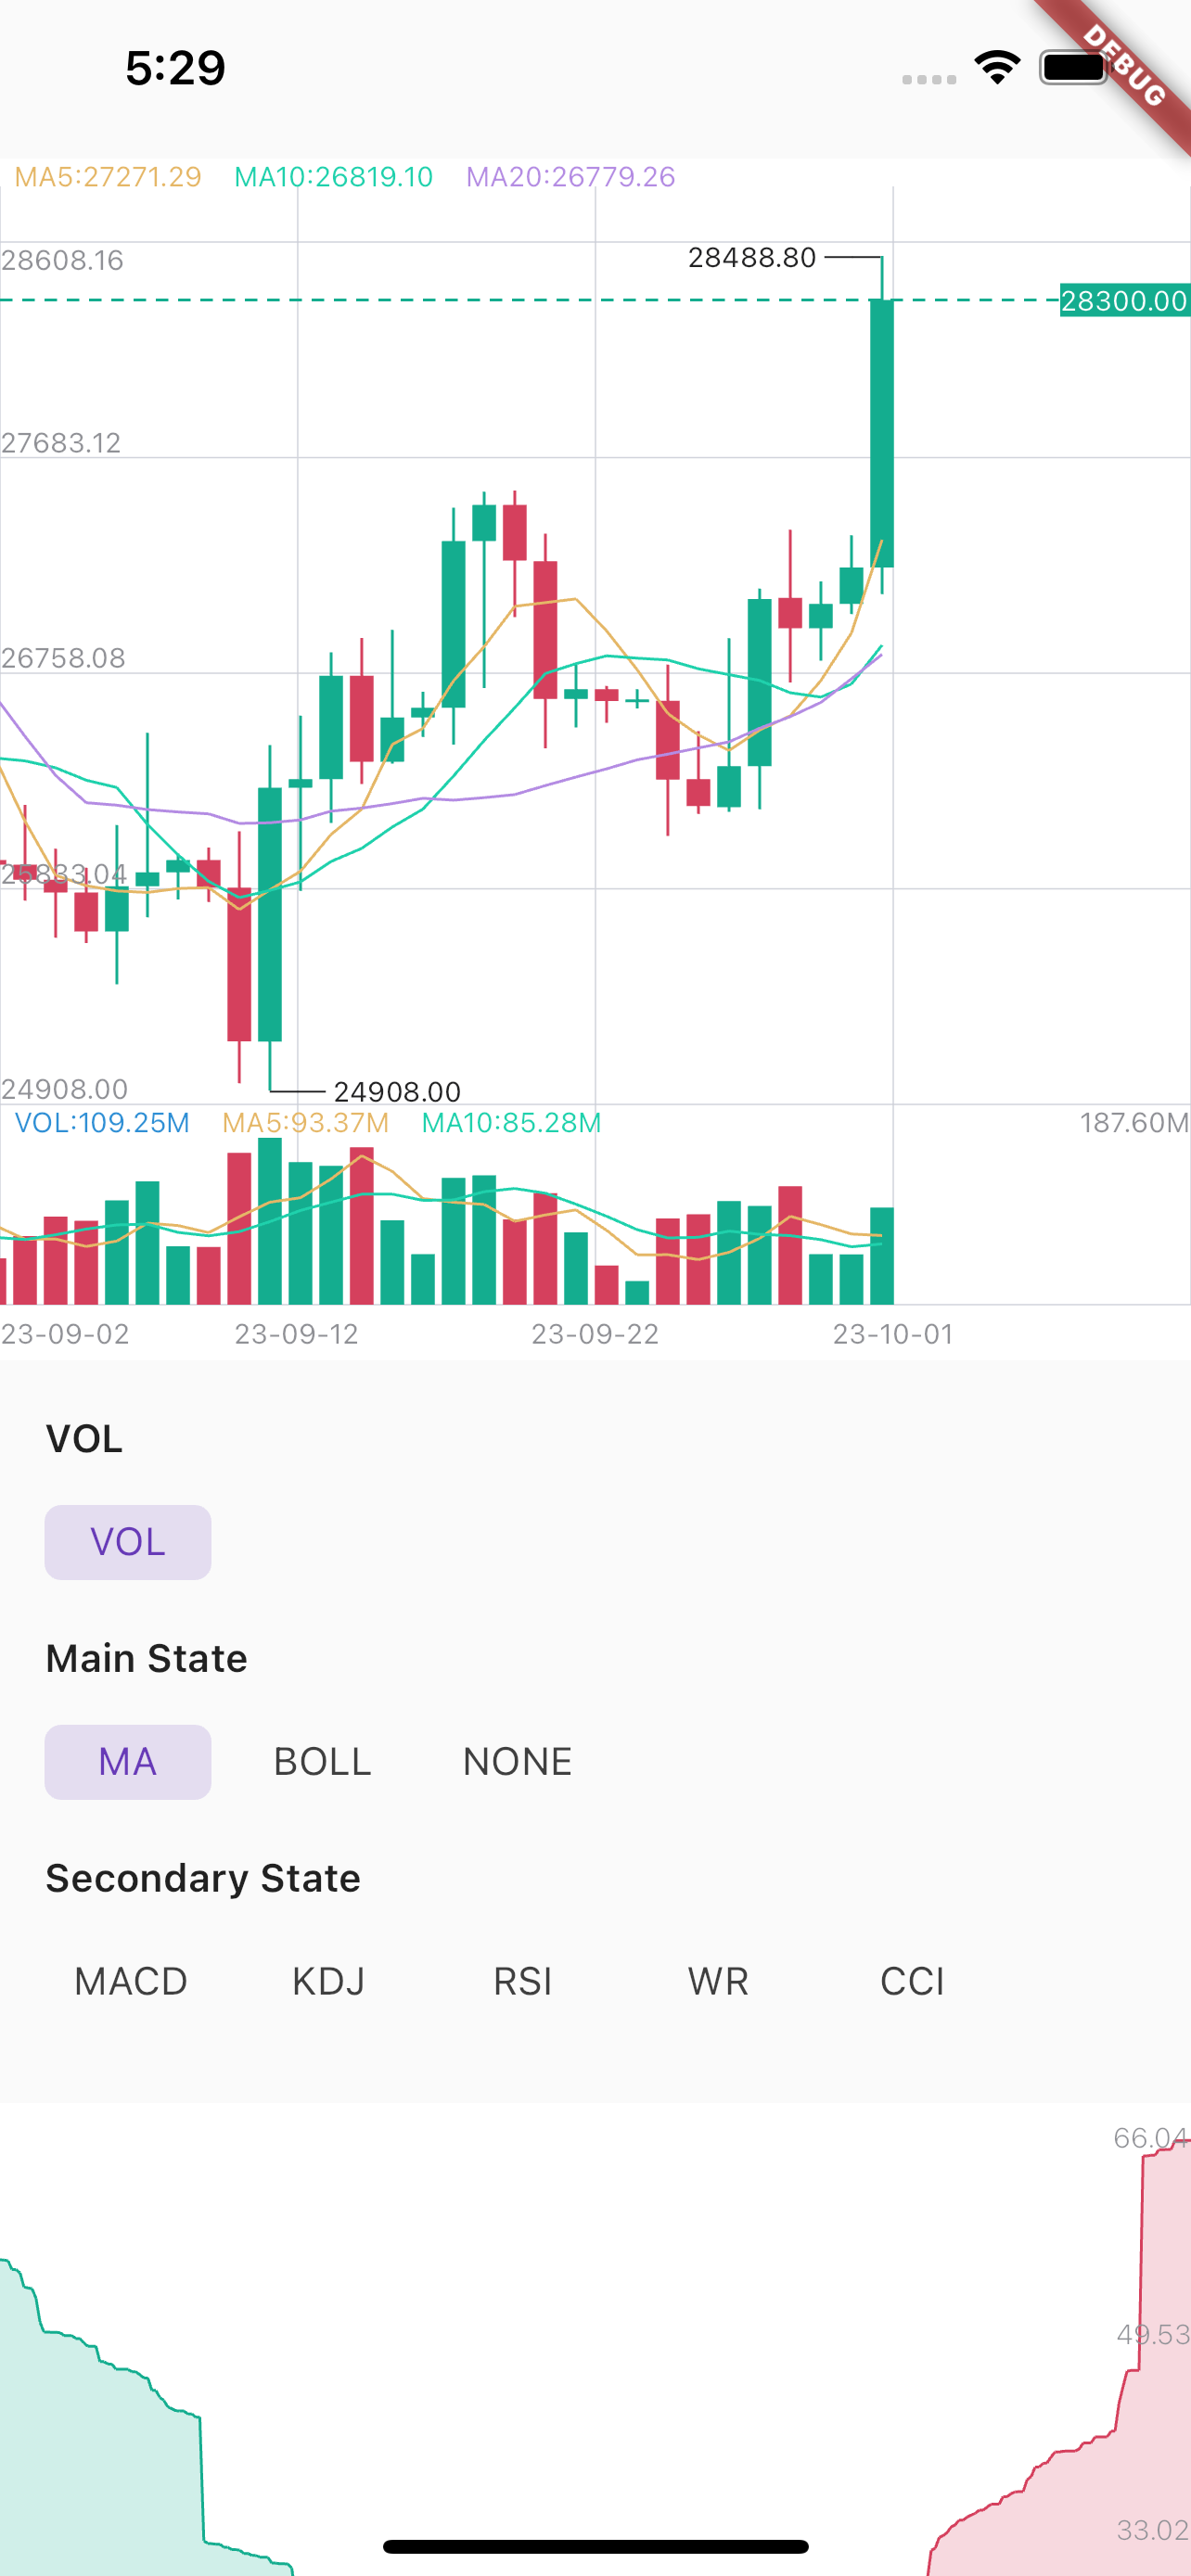
Maybe this is the best k chart in Flutter.Support drag,scale,long press,fling.And easy to use.

Example1 Example2

Installation

First, add k_chart_plus as a dependency in your pubspec.yaml file.

k_chart_plus_deeping: ^1.0.0-tomo+2

If you don't want to support selecting multiple secondary states, you need to use:

flutter_k_chat_plus:
   git:
     url: https://github.com/sawwas/flutter_k_chat_plus
     ref: single #branch name

Usage

When you change the data, you must call this:

DataUtil.calculate(datas); //This function has some optional parameters: n is BOLL N-day closing price. k is BOLL param.
Use K line chart
KChartWidget(
    chartStyle, // Required for styling purposes
    chartColors,// Required for styling purposes
    datas,// Required,Data must be an ordered list,(history=>now)
    mBaseHeight: 360, //height of chart (not contain Vol and Secondary) 
    isLine: isLine,// Decide whether it is k-line or time-sharing
    mainState: _mainState,// Decide what the main view shows
    secondaryStateLi: _secondaryStateLi,// Decide what the sub view shows
    fixedLength: 2,// Displayed decimal precision
    timeFormat: TimeFormat.YEAR_MONTH_DAY,
    onLoadMore: (bool a) {},// Called when the data scrolls to the end. When a is true, it means the user is pulled to the end of the right side of the data. When a
    // is false, it means the user is pulled to the end of the left side of the data.
    maDayList: [5,10,20],// Display of MA,This parameter must be equal to DataUtil.calculate‘s maDayList
    volHidden: false,// hide volume
    showNowPrice: true,// show now price
    isOnDrag: (isDrag){},// true is on Drag.Don't load data while Draging.
    isTrendLine: false, // You can use Trendline by long-pressing and moving your finger after setting true to isTrendLine property. 
    xFrontPadding: 100 // padding in front
),
Use Depth chart
DepthChart(_bids, _asks, chartColors) //Note: Datas must be an ordered list,
Dark | Light Theme

ChartColor helped to set the color for the chart. You need to flexibly change according to your theme configuration to ensure UI.

If you need to apply multi theme, you need to change at least the colors related to the text, border, grid and background color

late ThemeData themeData = Theme.of(context);
late ChartColors chartColors = ChartColors(
  bgColor: themeData.colorScheme.background,
  defaultTextColor: themeData.textTheme.labelMedium?.color ?? Colors.grey,
  gridColor: themeData.dividerColor,
  hCrossColor: themeData.textTheme.bodyMedium?.color ?? Colors.white,
  vCrossColor: themeData.disabledColor.withOpacity(.1),
  crossTextColor: themeData.textTheme.bodyMedium?.color ?? Colors.white,
  selectBorderColor: themeData.textTheme.bodyMedium?.color ?? Colors.black54,
  selectFillColor: themeData.colorScheme.background,
  infoWindowTitleColor: themeData.textTheme.labelMedium?.color ?? Colors.grey,
  infoWindowNormalColor: themeData.textTheme.bodyMedium?.color ?? Colors.white,
);

Apply in k line chart:


KChartWidget(
    data,
    ChartStyle(),
    ChartColors().init(), ///custom chart color
    chartTranslations: ChartTranslations(
        date: 'Date'
        open: 'Open',
        high: 'High',
        low: 'Low',
        close: 'Close'
        changeAmount: 'Change',
        change: 'Change%',
        amount: 'Amount',
        vol: 'Volume',
    ),
    mBaseHeight: 360,
    isTrendLine: false,
    mainState: mainState,
    secondaryStateLi: secondaryStates,
    fixedLength: 2,
    timeFormat: TimeFormat.YEAR_MONTH_DAY,
);
Thanks

TrangLeQuynh/k_chart_plus

gwhcn/flutter_k_chart

OpenFlutter/k_chart

Kategorien

Abhängigkeiten

Abhängigkeiten 3 Einträge

Quell-Repository

Projekte, die dieses Paket verwenden

Noch keine Daten verfügbar.