Aus öffentlichen Paketdaten erstellte Orientierung.
Eine Flutter-Bibliothek zum Erstellen anpassbarer, scrollbarer Stapeldiagramme. Für Entwickler konzipiert, die flexible Visualisierungswerkzeuge benötigen, unterstützt sie die dynamische Datenwiedergabe auf mehreren Plattformen wie Android, iOS, Web, macOS, Windows und Linux. Das Paket ermöglicht eine intuitive Datenpräsentation mit reibungsloser Scrollfunktion und umfangreichen Stiloptionen, um den Designanforderungen der App gerecht zu werden. Ideal für Dashboards, Analysen und Berichtschnittstellen, bei denen eine schichtweise Datenvergleichung entscheidend ist.
Anwendungsfälle
Daten-Dashboards
Analyseberichterstattung
Finanztrendvisualisierung
Bildungs-Apps
Bestandsverfolgung
Leistungsüberwachung
Hauptmerkmale
Scrollbare Diagramme
Anpassbare Farben und Stile
Mehrschichtige Balkenvisualisierung
reaktives Design
plattformunabhängiger Support
Dynamische Datenaktualisierungen
Geeignet für
Entwickler, die datenintensive Anwendungen erstellen
UI-Designer, die interaktive Diagramme benötigen
Teams, die an Cross-Platform-Projekten arbeiten
analysenorientierte Anwendungen
Echtzeit-Datenvisualisierung
Hinweise
Erfordert Verständnis von Diagrammdatenstrukturen
Für komplexe Interaktionen kann ein zusätzlicher State-Management-Ansatz erforderlich sein
Leistungseinbußen bei sehr großen Datensätzen
Begrenzte integrierte Tooltips oder Anmerkungen
Benutzerdefinierte Stile erfordern möglicherweise zusätzlichen Code
Original-README
Originaler README-Schnappschuss aus dem verknüpften Quell-Repository. Aktuelle Inhalte finden Sie im Repository.
stacked_bar_chart
A Flutter package for creating different types of charts.This package gives developer the flexibility to customize their graph as well.
Features
Plot graphs
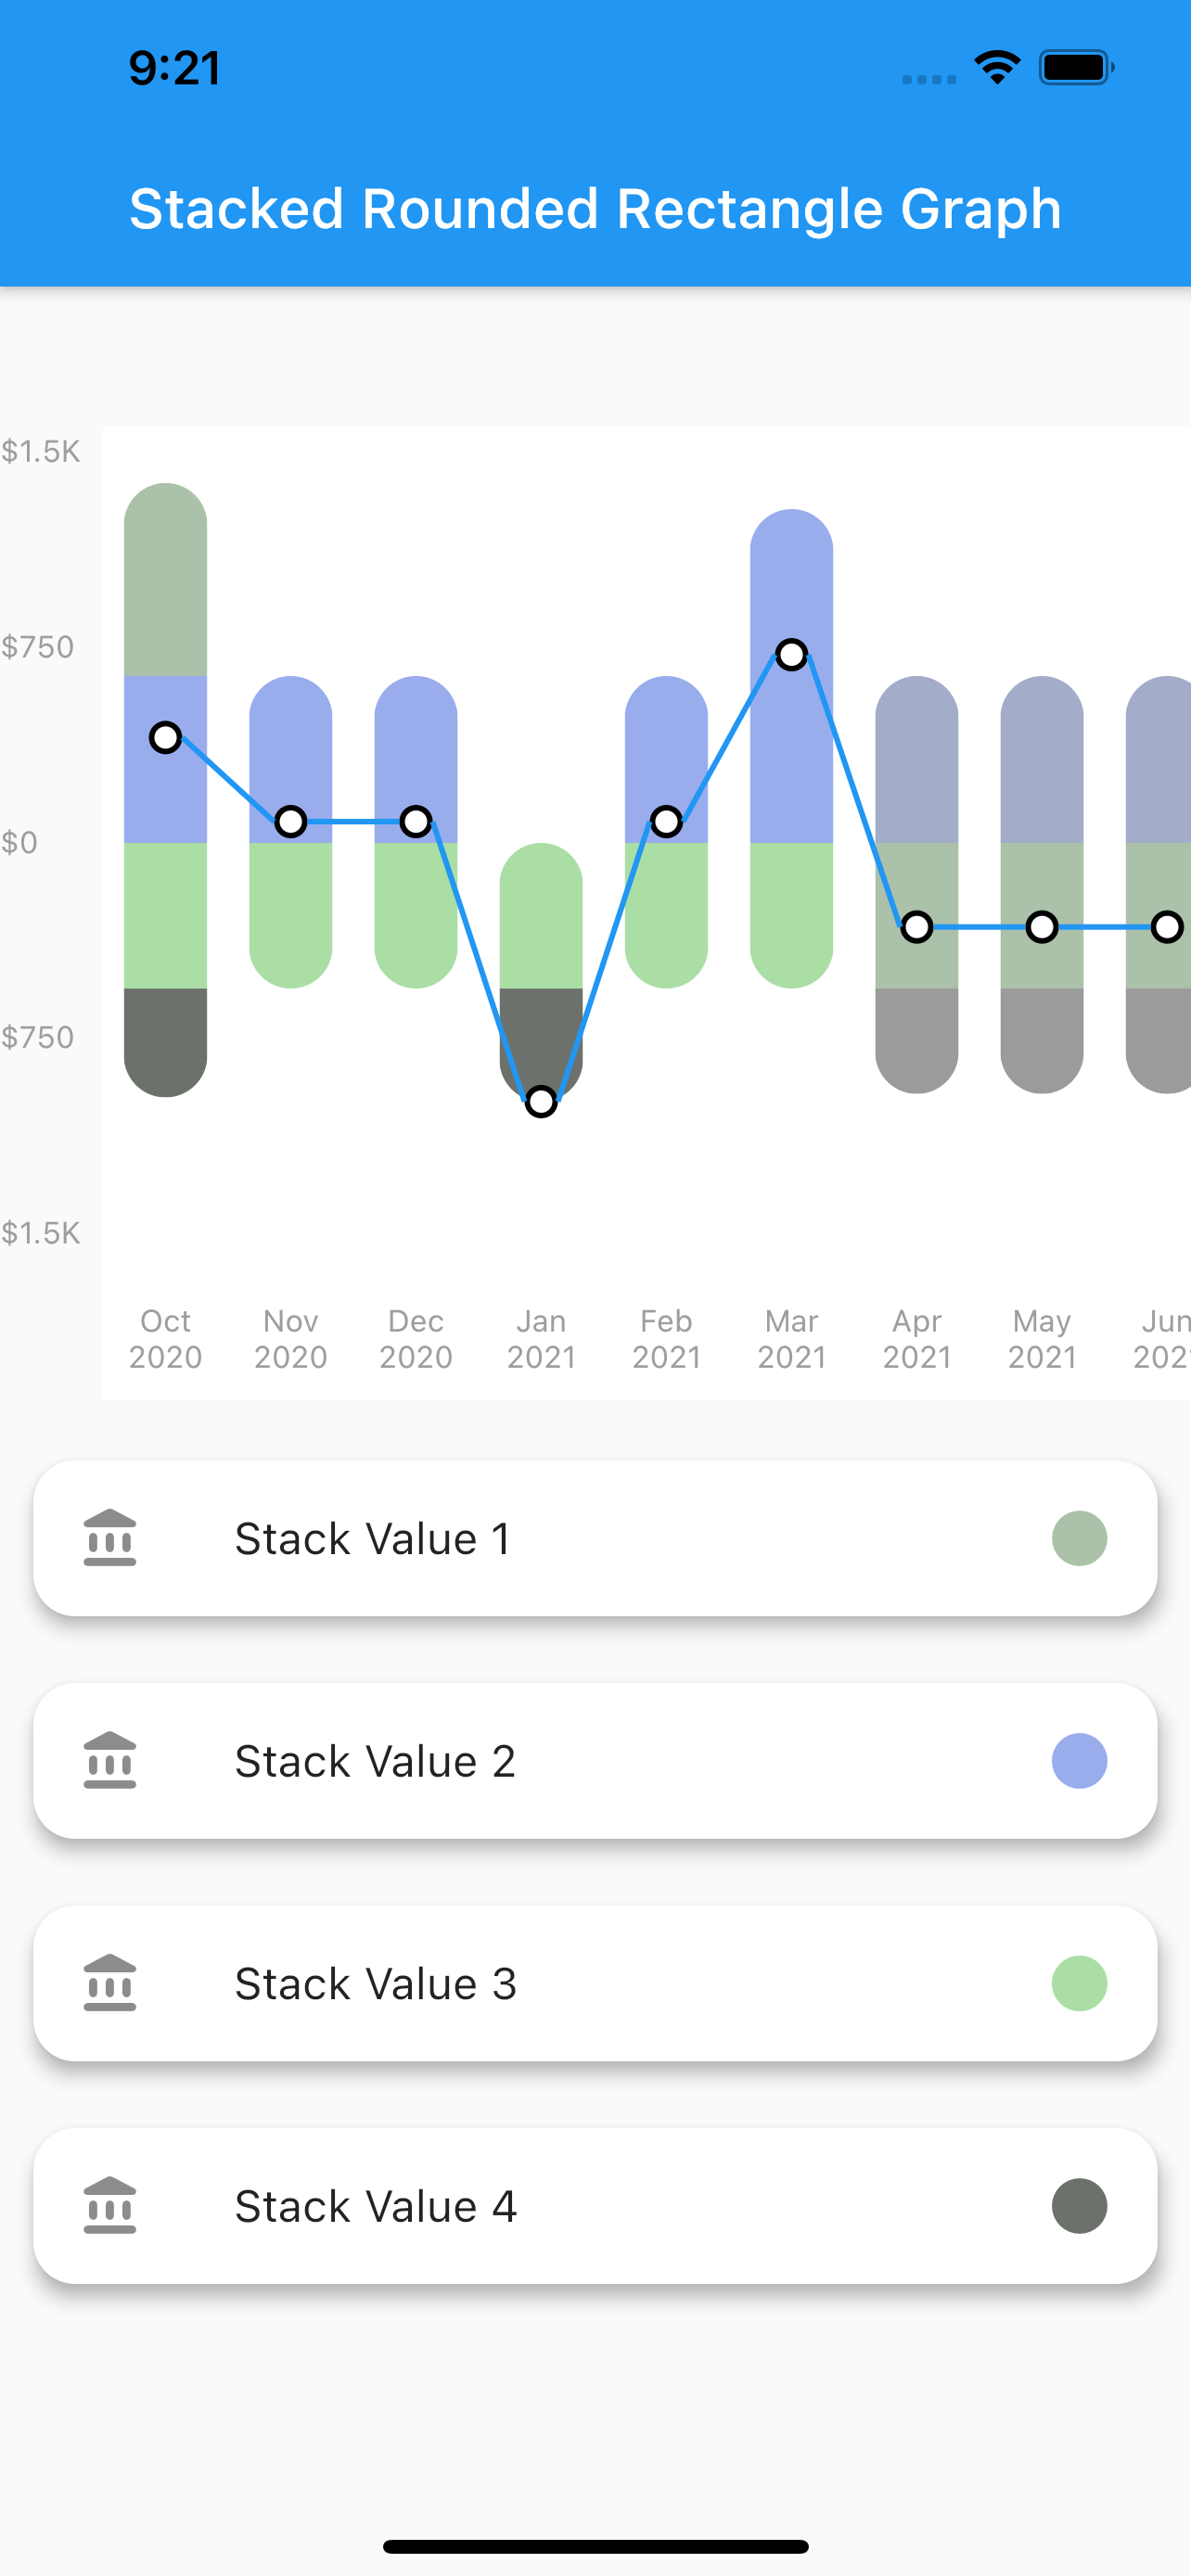
Stacked Rounded Rectangle Graph
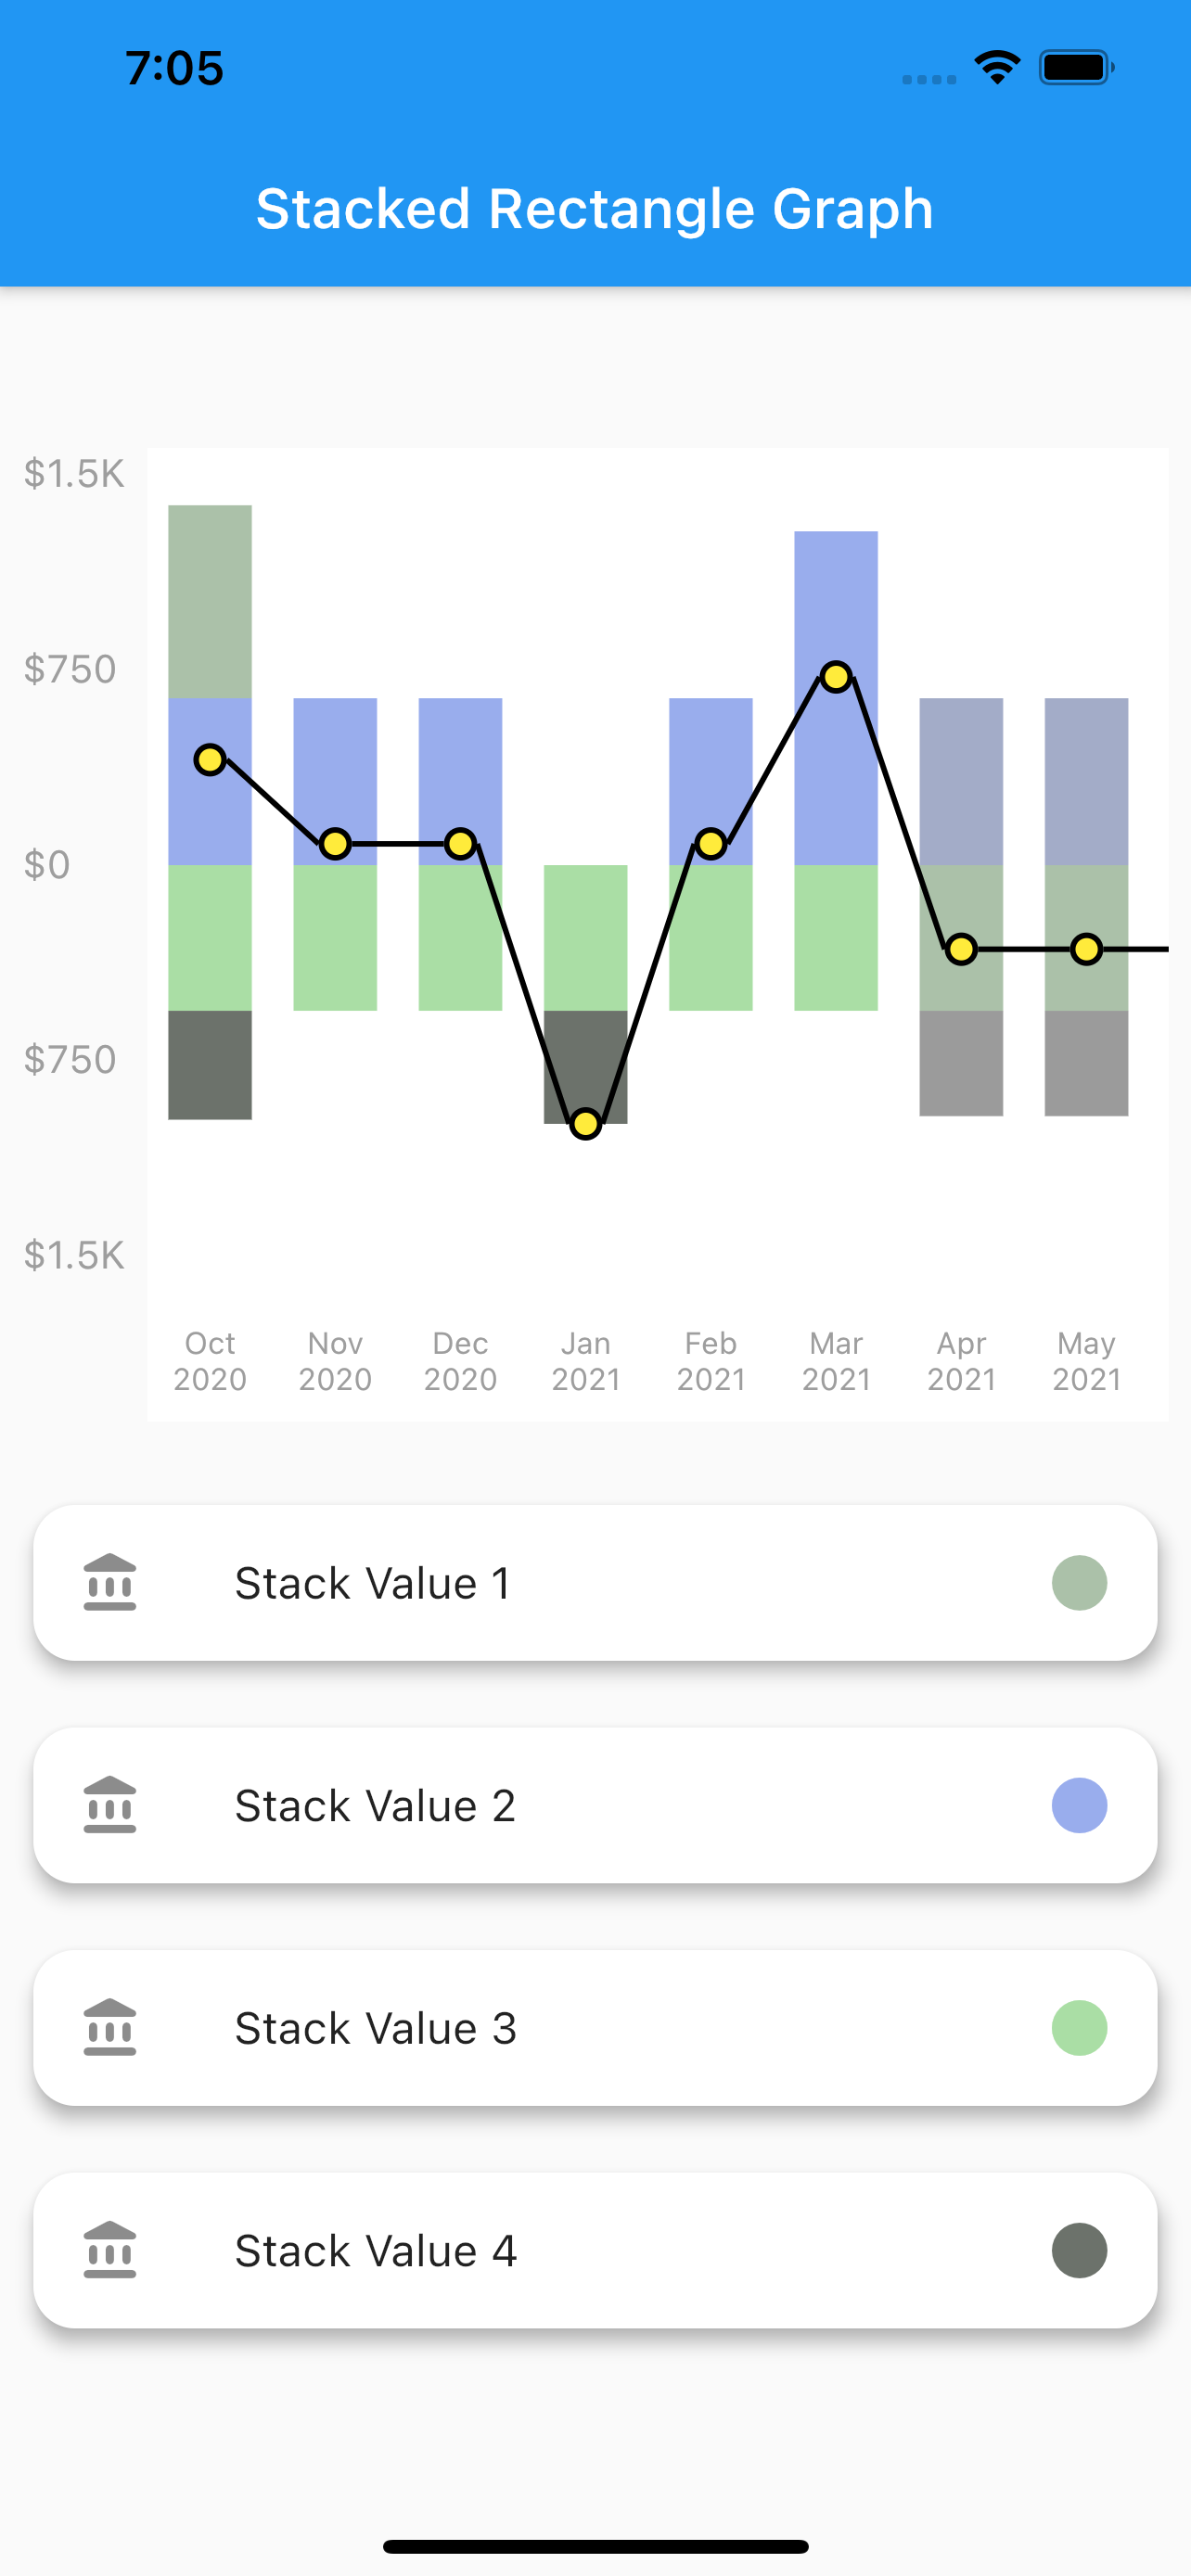
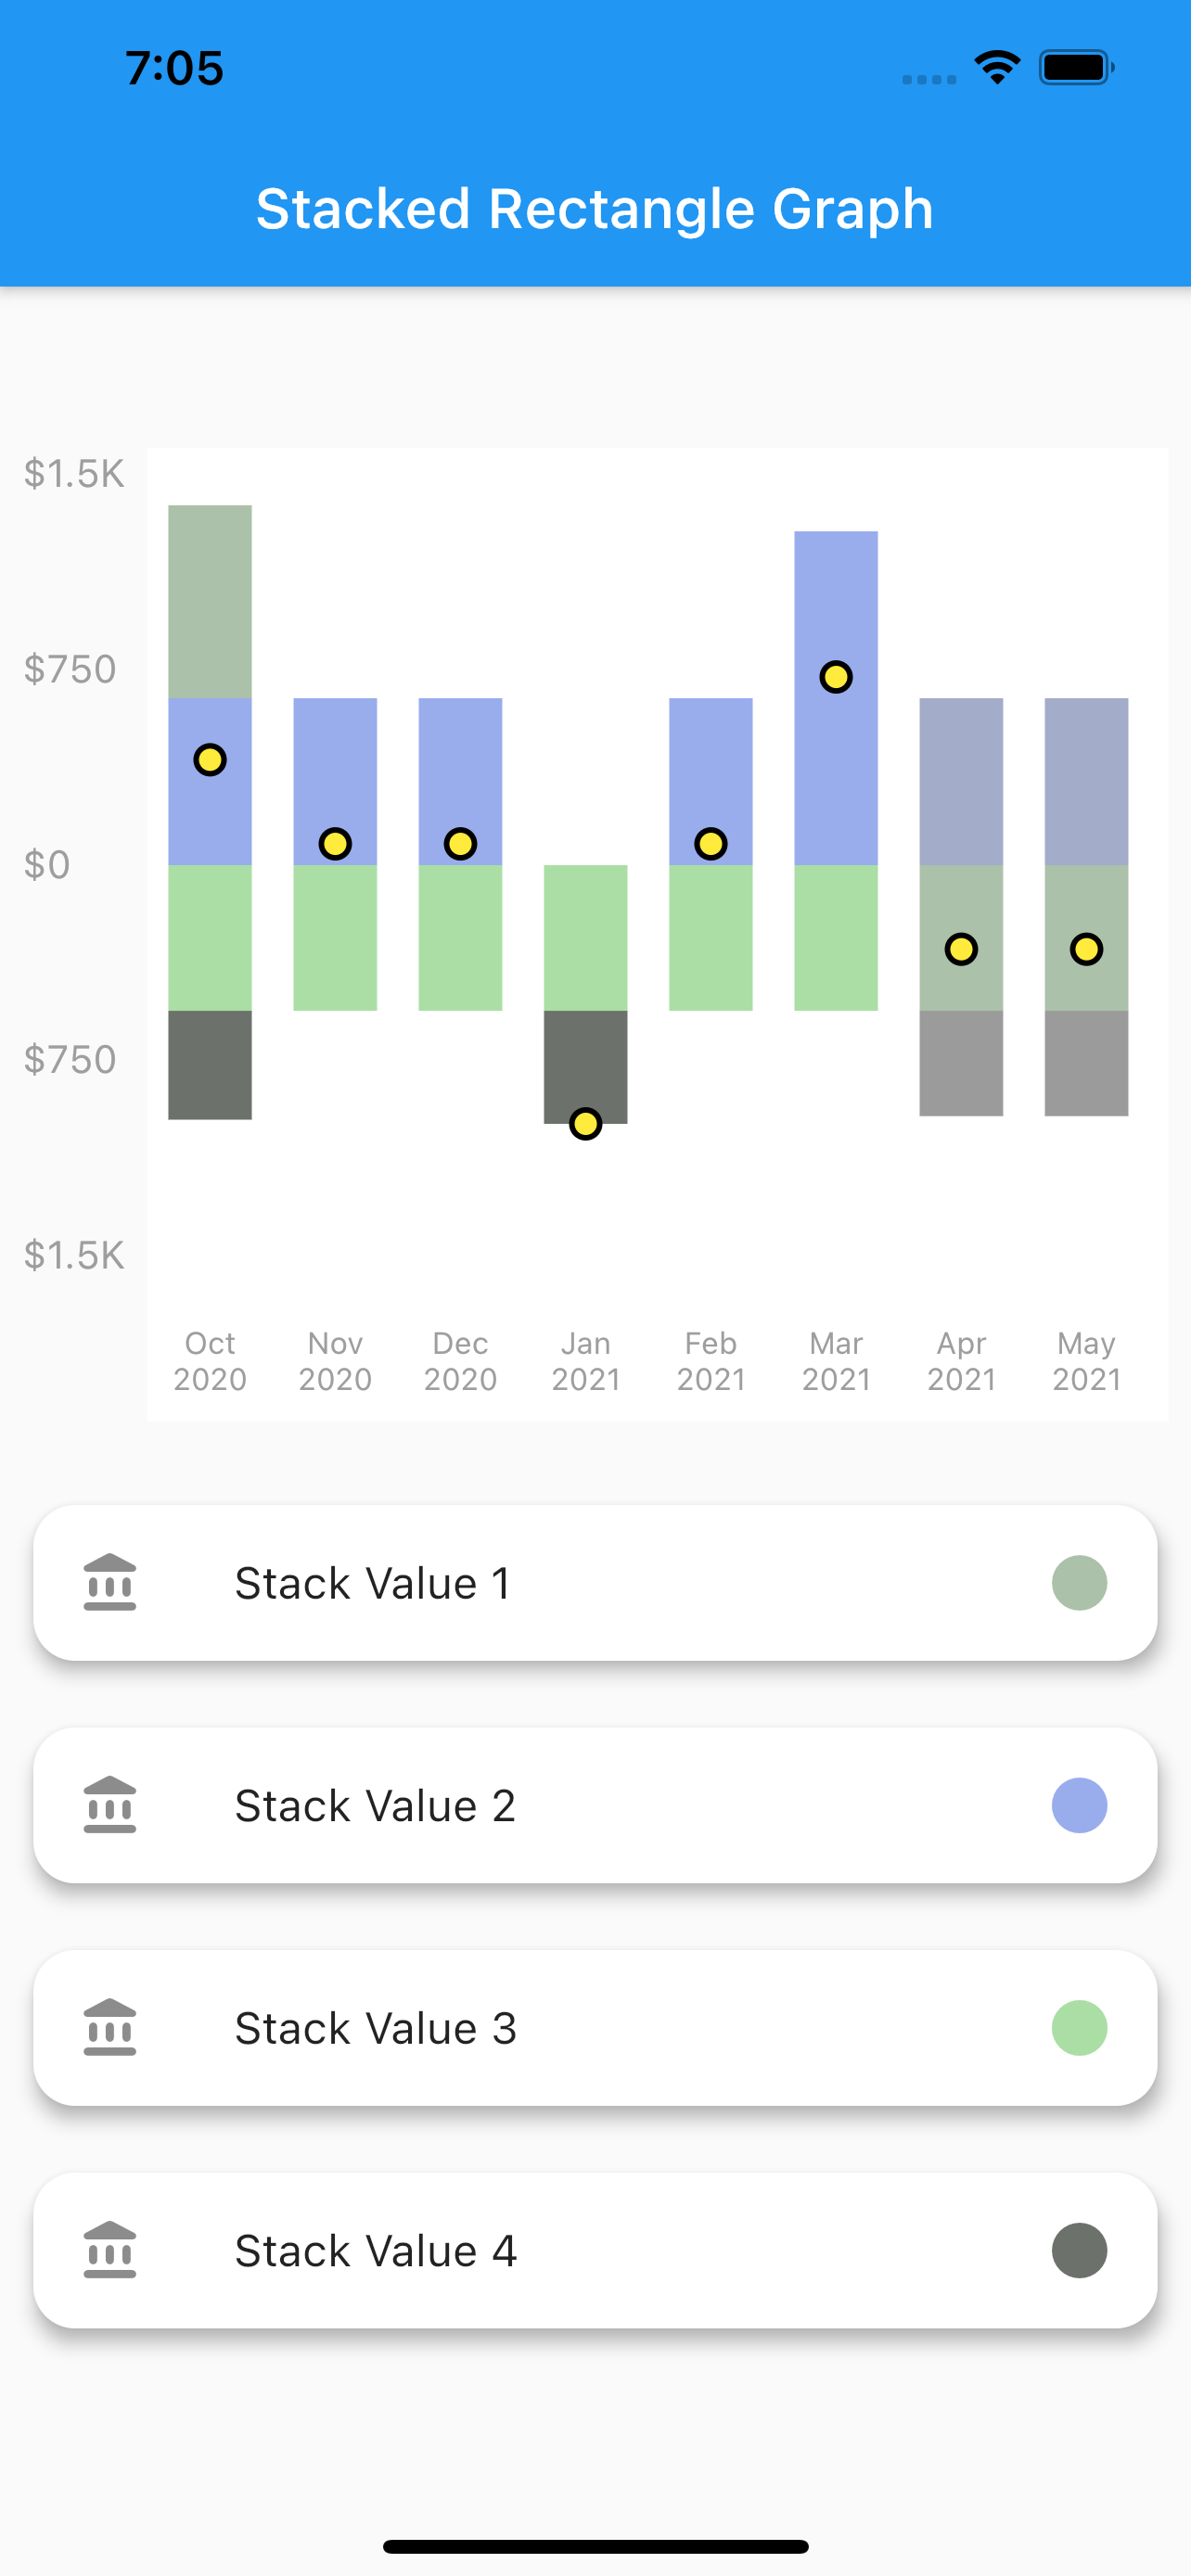
Stacked Rectangele Graph
Net Line Graph
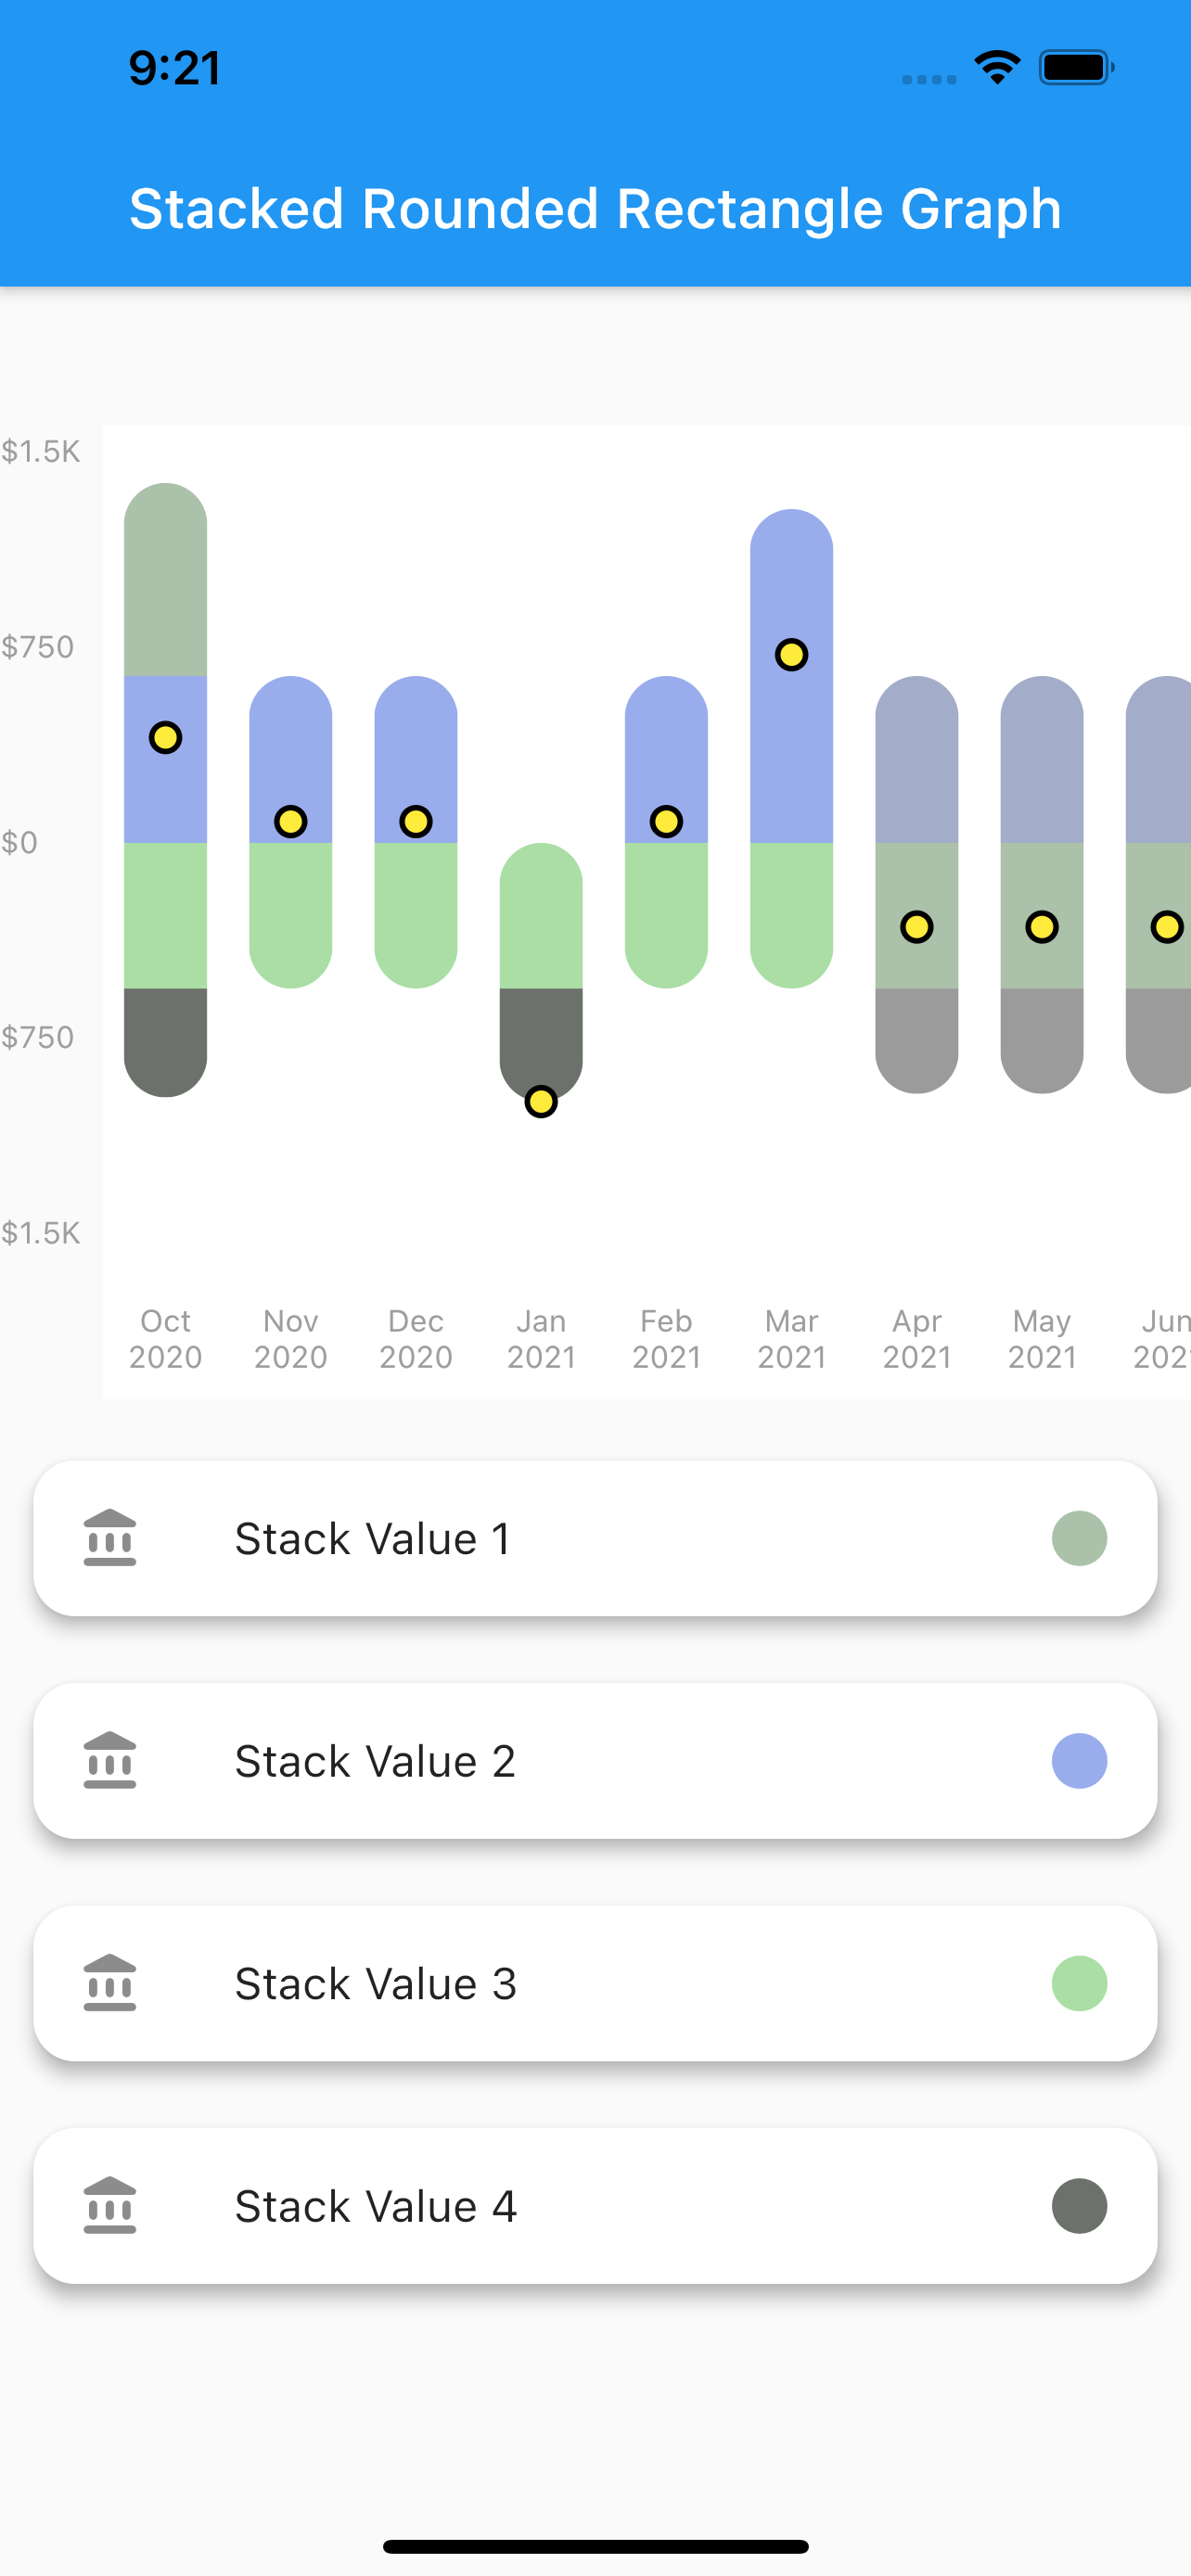
Net Point Graph
Customize your graph
Select if you want to display the net line
change core color,line color as well as line width of the net line
Scrollable
The graphs plotted are scrollable
Provide data in json format
You can use the toMap() and forMap() methods to provide your data in json format
Style your Labels
You can style both you X-axis and Y-axis Labels.
Callback on bar tap
A callback is provided on tap of each bar. Developer can use this feature as per their need.
Installation
In the dependencies: section of your pubspec.yaml, add the following line:
A simple stacked bar graph with no rounded borders. You can customize it in the same way as the stacked rounded rectangle graph.
To plot this graph pass the GraphType.StackedRect in graphType. as shown below
graphType: GraphType.StackedRect
3. Net Line Graph
A simple line graph plotted with the net values of the data provided. The net values of a particular data is calculated and plotted.It can also be customized in the same way as stacked rounded rectangle graph.
To plot this graph pass the GraphType.StackedRect in graphType. as shown below
graphType: GraphType.LineGraph
4. Net Point Graph
A simple plot of the net values of the data.You can customize the point core and it's outer border using the netPoint parameter.
To plot this graph pass the GraphType.StackedRect in graphType. and then pass parameters in netLine to remove the line as shown below