सार्वजनिक जानकारी से बना चयन मार्गदर्शन। केवल संदर्भ हेतु।
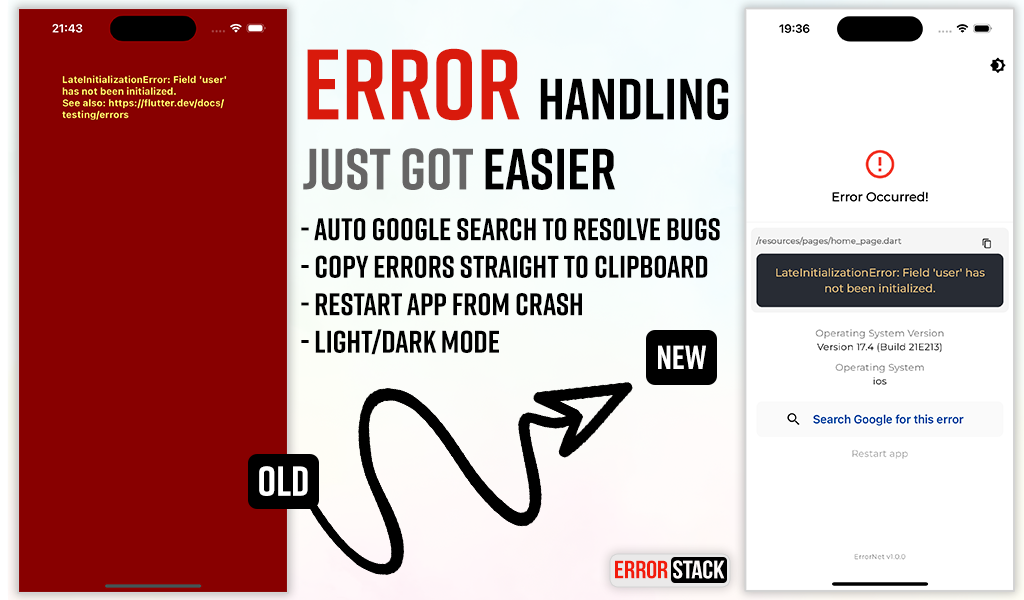
ErrorStack एक Flutter पैकेज है जिसका उद्देश्य त्रुटि प्रबंधन को सरल बनाना है, त्रुटियों को दिखाने के लिए कस्टमाइज़ किए गए UI और मजबूत लॉगिंग क्षमताओं के साथ। यह विकासकर्मियों को विकास और उत्पादन में समस्याओं की त्वरित पहचान और निवारण में मदद करता है, डिबगिंग की कार्यक्षमता में सुधार करता है। कई प्लेटफॉर्मों के समर्थन के साथ, यह मौजूदा कार्यप्रवाह में आसानी से एकीकृत होता है। अपवाद घटित होने पर स्पष्ट और कार्यान्वयन योग्य प्रतिक्रिया प्रदान करके यह उत्पादकता में सुधार करता है।
उपयोग
रनटाइम त्रुटियों का दुरुस्ती
उपयोगकर्ता-मित्रतापूर्ण त्रुटि संदेश प्रदर्शित करना
विश्लेषण के लिए त्रुटियों का लॉगिंग
एप्लिकेशन स्थिरता में सुधार करना
उत्पादन में क्रैश की निगरानी
डेवलपर के कार्य प्रवाह में सुधार करना
मुख्य विशेषताएँ
कस्टमाइज़ किए गए त्रुटि UI
निर्मित त्रुटि लॉगिंग
क्रॉस-प्लेटफ़ॉर्म समर्थन
Flutter ऐप्स में आसान एकीकरण
रियल-टाइम त्रुटि रिपोर्टिंग
कॉन्फ़िगरेबल त्रुटि प्रबंधन व्यवहार
इनके लिए उपयुक्त
Flutter विकासकर्ता
CI/CD पाइपलाइन्स का उपयोग करने वाली टीमें
प्रभावी त्रुटि निगरानी की आवश्यकता वाले ऐप्स
विफलताओं के दौरान उपयोगकर्ता अनुभव पर ध्यान केंद्रित विकासकर्ता
कठोर त्रुटि ट्रैकिंग की आवश्यकता वाले प्रोजेक्ट्स
डिबगिंग गति को प्राथमिकता देने वाली फ्रंटएंड टीमें
विचार योग्य बातें
पूर्ण कार्यक्षमता के लिए विन्यास की आवश्यकता होती है
एप्लिकेशन के आकार में हल्का वृद्धि हो सकती है
सही सेटअप के लिए लॉगिंग पर निर्भर है
उत्पादन के लिए उपयोग के लिए नहीं, बल्कि कस्टमाइजेशन के साथ उपयोग के लिए
त्रुटि प्रदर्शन और लॉगिंग सीमा तक सीमित
अन्य मॉनिटरिंग टूल्स के साथ उपयोग करने के लिए सबसे अच्छा
मूल README
संबंधित सोर्स रिपॉज़िटरी के मूल README का स्नैपशॉट। नवीनतम सामग्री के लिए रिपॉज़िटरी देखें।
Error Stack for Flutter
Error Stack is a comprehensive error handling and debugging toolkit for Flutter. It provides beautiful error screens in debug mode with actionable information, customizable error pages for production, and a powerful dev panel for runtime debugging.
Features
Beautiful debug error screens with Google search links and stack traces
Customizable production error pages
Light and dark mode support
Dev Panel - Runtime debugging tool with:
API request/response logging
Console logging with severity levels
Navigation route tracking
Local storage viewer (Secure Storage & Shared Preferences)
UI debugging overlays (grid, layout bounds, etc.)
Dio interceptor for automatic HTTP logging
SOLID architecture with dependency injection support
Option 1: Long-press the "Dev Mode" bar at the bottom of the screen
Option 2: Call programmatically:
ErrorStack.showDevPanel(context);
API Tab
View HTTP requests and responses with timing, headers, and body data.
Dio Integration
import'package:error_stack/error_stack_dio.dart';
final dio = Dio();
dio.interceptors.add(ErrorStackDioInterceptor());
// All requests are automatically loggedfinal response = await dio.get('https://api.example.com/users');
Console logs with filtering by severity level. Tap the copy icon on any log entry to copy the full entry (level, timestamp, tag, message, and stack trace) to the clipboard.
import'package:error_stack/error_stack.dart';
// Log at different levelsDevPanelStore.instance.debug('Debug message');
DevPanelStore.instance.info('User logged in', tag: 'auth');
DevPanelStore.instance.warning('Cache miss for key');
DevPanelStore.instance.error('Failed to load data', stackTrace: trace.toString());
// With metadataDevPanelStore.instance.info(
'Payment processed',
tag: 'payments',
metadata: {'amount': 99.99, 'currency': 'USD'},
);
Routes Tab
Navigation history with route names, arguments, and actions. Tap a route to open its details sheet, where you can copy the route name to the clipboard.
Route tracking is automatic when using ErrorStackNavigatorObserver:
View all local storage data from both Secure Storage and Shared Preferences. Tap an entry to open the edit modal, where you can copy the key or value to the clipboard or update the stored value.
UI Debug Tools
The dev panel includes visual debugging overlays:
Tool
Description
Grid Paper
Overlay grid for alignment checking
Layout Bounds
Show widget boundaries
Text Scale
Override text scale (0.5-3.0x)
Color Blindness
Simulate protanopia, deuteranopia, tritanopia
Slow Animations
5x animation slowdown
Performance Overlay
Flutter performance metrics
Safe Areas
Visualize safe area boundaries
Control programmatically:
final store = DevPanelStore.instance;

store.toggleGridPaper(true);
store.setGridSpacing(24.0);
store.toggleLayoutBounds(true);
store.setTextScaleFactor(1.5);
store.setColorBlindnessMode(ColorBlindnessMode.protanopia);
store.toggleSlowAnimations(true);
store.togglePerformanceOverlay(true);
store.toggleSafeAreas(true);

// Reset all to defaults
store.resetUIDebugSettings();
Architecture
Error Stack follows SOLID principles with a modular design: