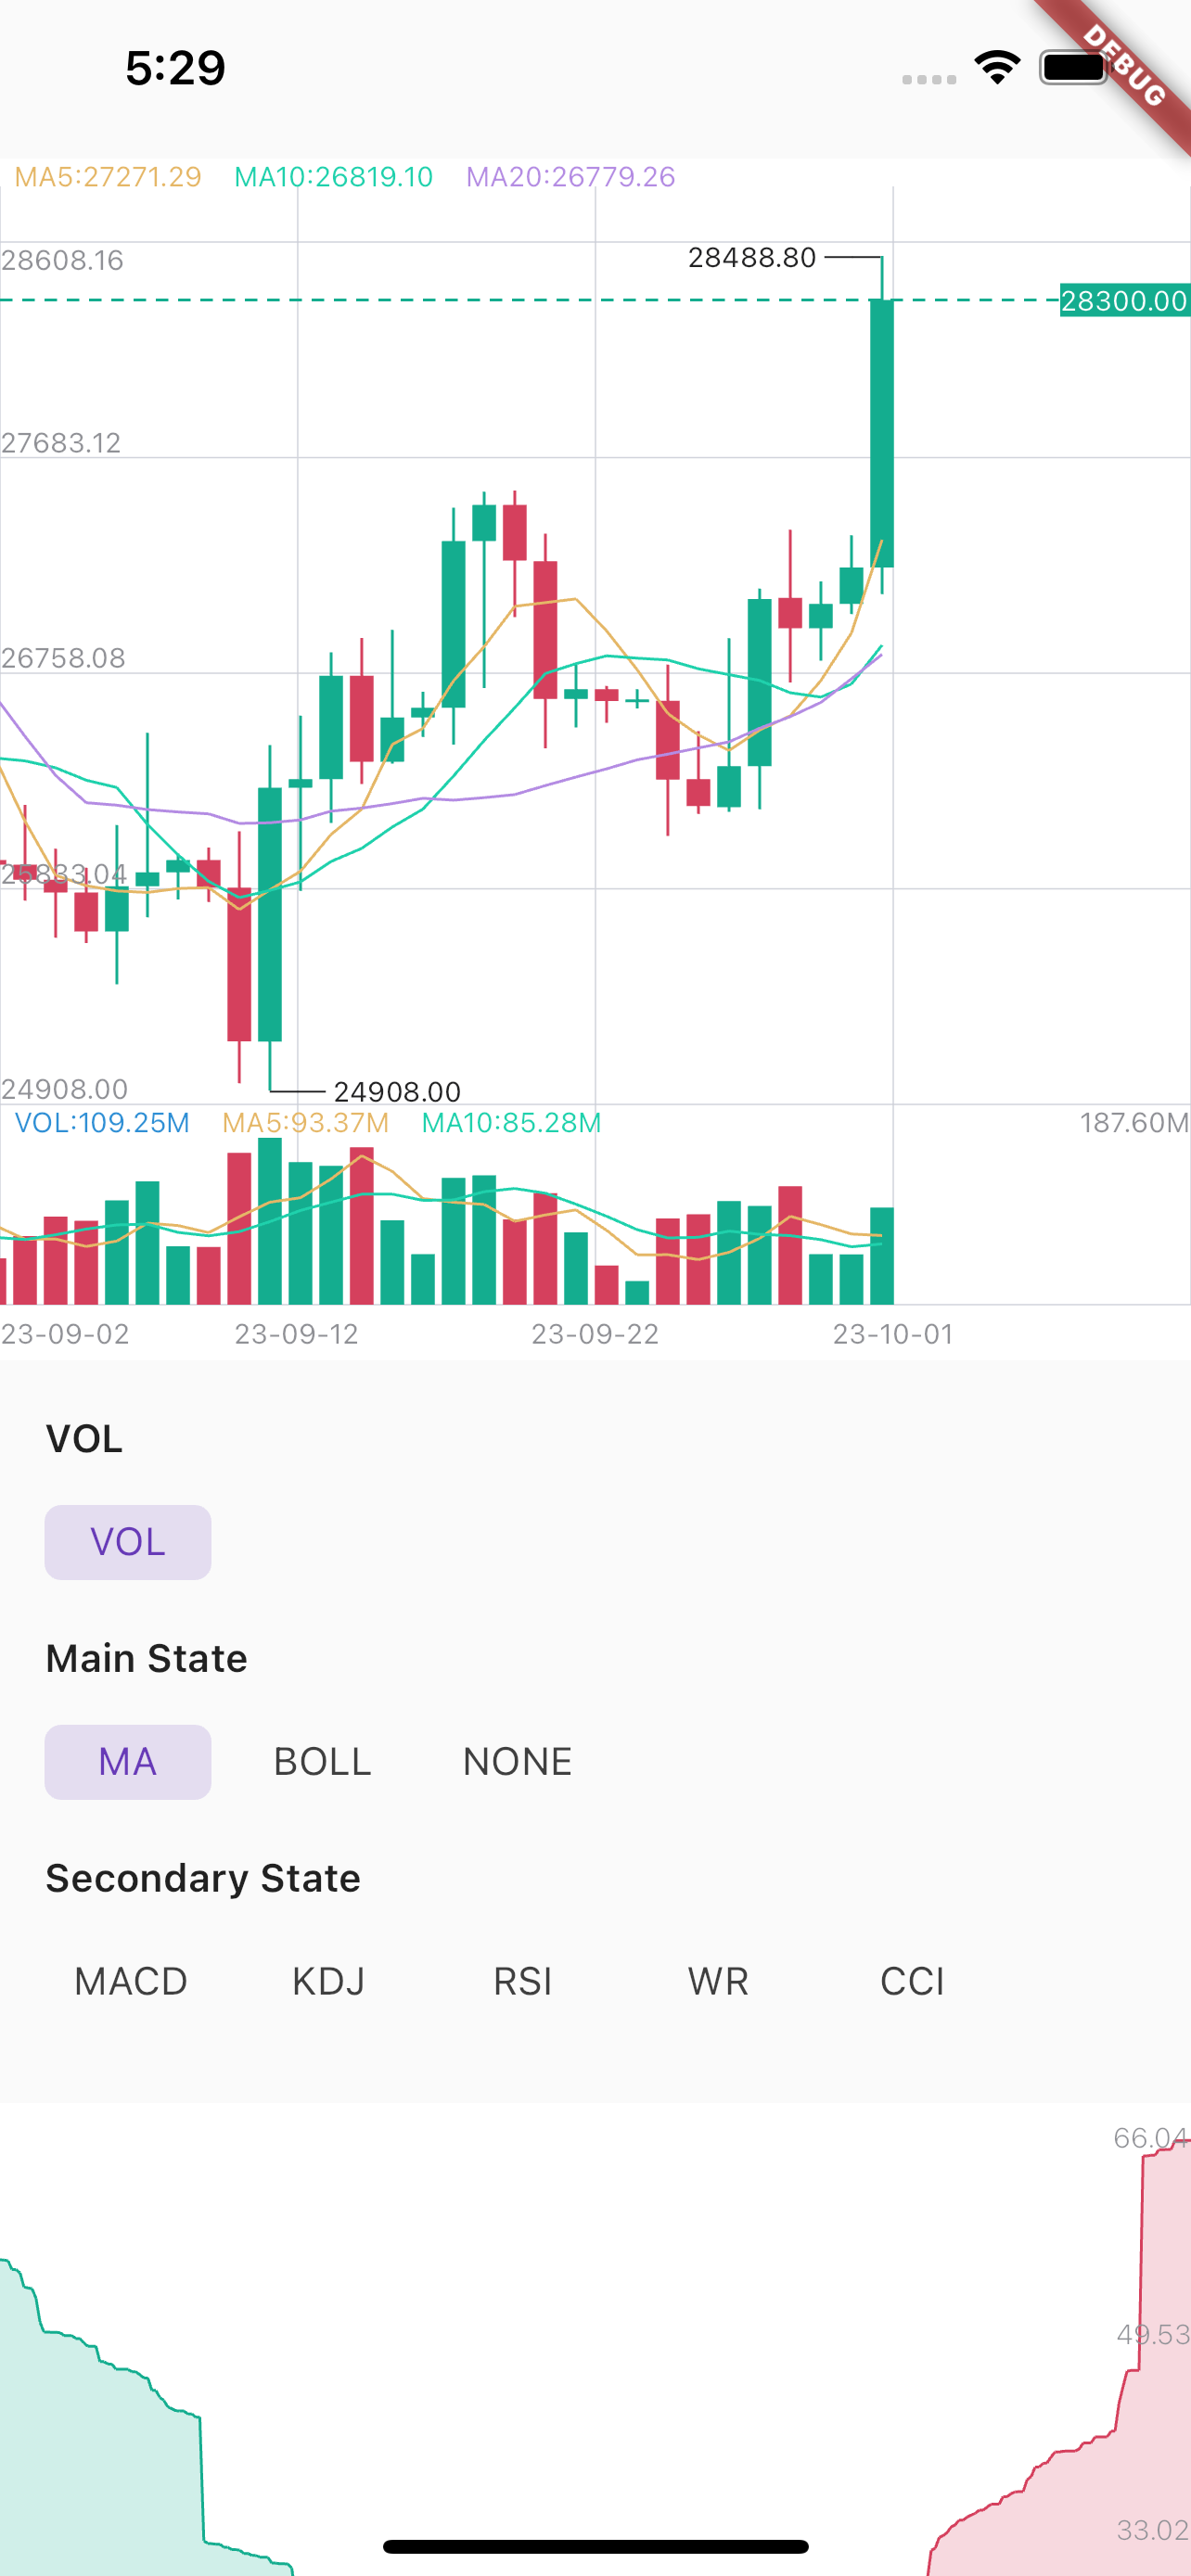
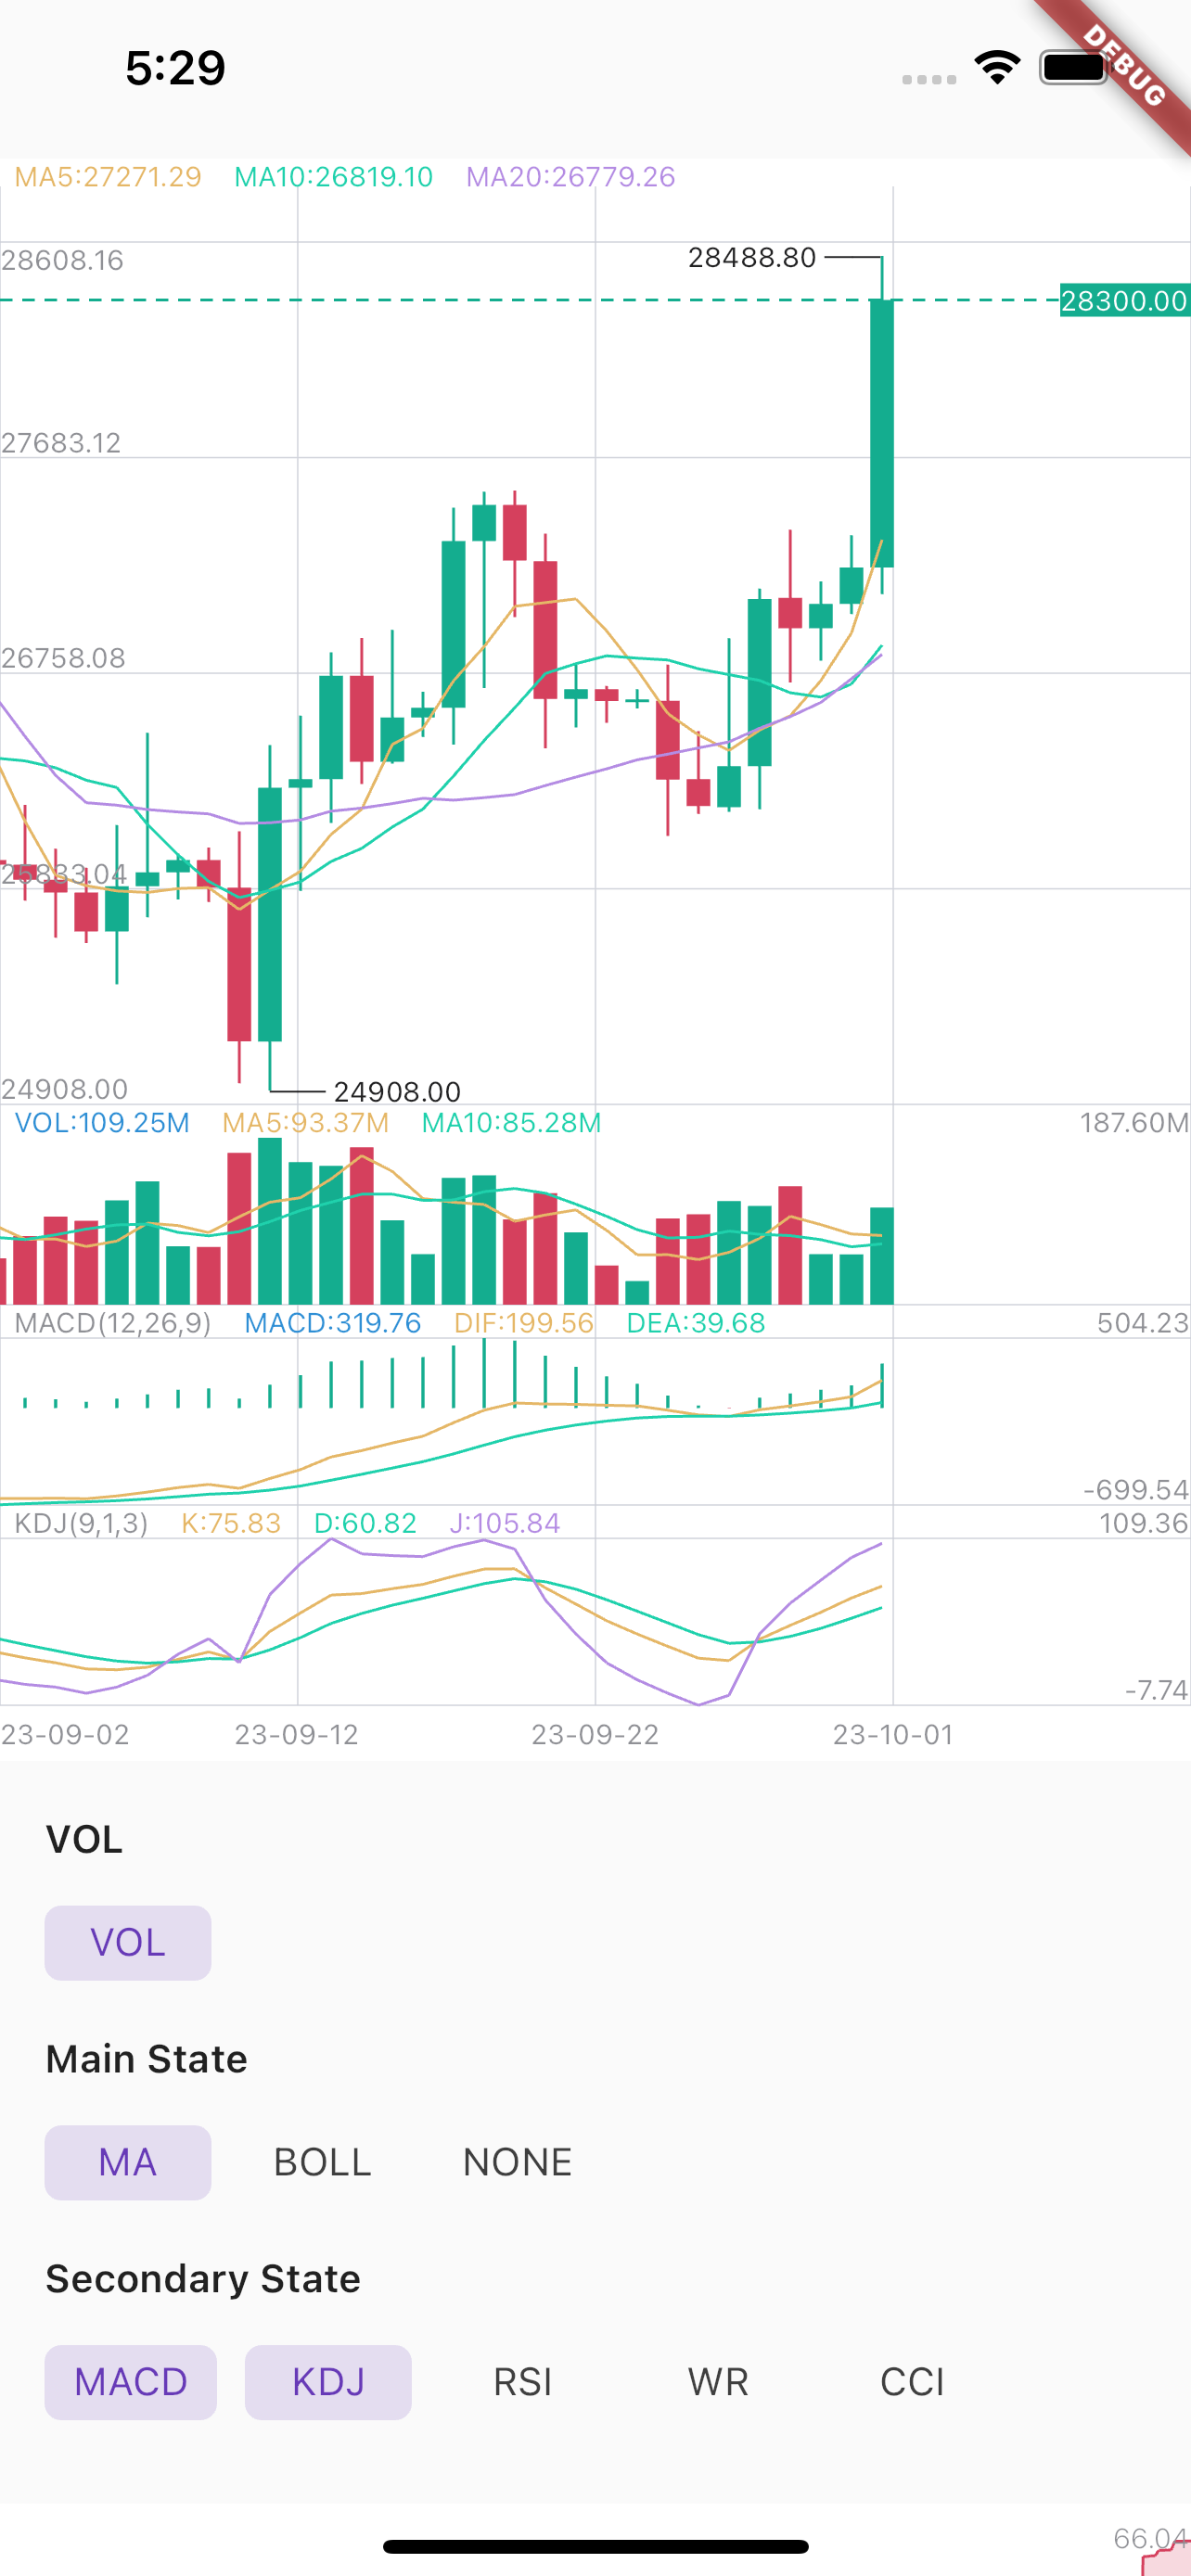
एक्सचेंज एप्लिकेशन में कैंडलचार्ट और डीप्थ चार्ट बनाने वाला चार्ट लाइब्रेरी, नई संभावनाओं के लिए खुले अनुभवी सॉफ्टवेयर डेवलपर, टेलीग्राम @sandaohaizi के ज़रिए संपर्क करें।
सार्वजनिक जानकारी से बना चयन मार्गदर्शन। केवल संदर्भ हेतु।
k_chart_plus_deeping एक Flutter पैकेज है जिसका उपयोग उन्नत वित्तीय चार्ट बनाने के लिए किया जाता है, जिसमें एक्सचेंज एप्लिकेशन के लिए आदर्श मोमबत्ती और डेप्थ चार्ट शामिल हैं। यह वास्तविक समय में डेटा अपडेट के समर्थन के साथ चिकनी, कस्टमाइज़ किए गए विज़ुअलाइज़ेशन प्रदान करता है। अनुभवी डेवलपर्स के लिए बनाया गया, यह विभिन्न प्लेटफॉर्मों पर ट्रेडिंग या वित्त-केंद्रित ऐप्स में बिना किसी दिक्कत के एकीकृत हो सकता है। यह लाइब्रेरी ओपन-सोर्स है और एक डेवलपर द्वारा बनाए रखी जा रही है जो टेलीग्राम के माध्यम से सहयोग के लिए खुला है।
उपयोग
ट्रेडिंग प्लेटफॉर्म इंटरफेस
क्रिप्टोकरेंसी एक्सचेंज डैशबोर्ड
रियल-टाइम बाजार डेटा विज़ुअलाइज़ेशन
वित्तीय विश्लेषण उपकरण
पोर्टफोलियो ट्रैकिंग एप्लिकेशन्स
मुख्य विशेषताएँ
कैंडलस्टिक चार्ट रेंडरिंग
गहराई चार्ट विज़ुअलाइजेशन
क्रॉस-प्लेटफॉर्म संगतता
उच्च प्रदर्शन रेंडरिंग
कस्टमाइज़ किए गए थीम और स्टाइल
रियल-टाइम डेटा स्ट्रीमिंग सपोर्ट
इनके लिए उपयुक्त
अनुभवी फ्लटर विकासकर्ता
वित्त और क्रिप्टो एप्लिकेशन निर्माता
एक्सचेंज प्लेटफॉर्म टीम
डेटा विज़ुअलाइजेशन विशेषज्ञ
इंटरैक्टिव चार्ट की आवश्यकता वाले ऐप्स
विचार योग्य बातें
वित्तीय चार्टिंग अवधारणाओं के समझ की आवश्यकता है
जटिल ट्रेडिंग UI के लिए सबसे उपयुक्त
अतिरिक्त अवस्था प्रबंधन की आवश्यकता हो सकती है
GitHub रिपोज़िटरी के अलावा सीमित डॉक्यूमेंटेशन
प्रत्यक्ष समर्थन के लिए टेलीग्राम संपर्क आवश्यक है
मूल README
संबंधित सोर्स रिपॉज़िटरी के मूल README का स्नैपशॉट। नवीनतम सामग्री के लिए रिपॉज़िटरी देखें।
If you don't want to support selecting multiple secondary states, you need to use:
flutter_k_chat_plus:git:url:https://github.com/sawwas/flutter_k_chat_plusref:single#branch name
Usage
When you change the data, you must call this:
DataUtil.calculate(datas); //This function has some optional parameters: n is BOLL N-day closing price. k is BOLL param.
Use K line chart
KChartWidget(
chartStyle, // Required for styling purposes
chartColors,// Required for styling purposes
datas,// Required,Data must be an ordered list,(history=>now)
mBaseHeight: 360, //height of chart (not contain Vol and Secondary)
isLine: isLine,// Decide whether it is k-line or time-sharing
mainState: _mainState,// Decide what the main view shows
secondaryStateLi: _secondaryStateLi,// Decide what the sub view shows
fixedLength: 2,// Displayed decimal precision
timeFormat: TimeFormat.YEAR_MONTH_DAY,
onLoadMore: (bool a) {},// Called when the data scrolls to the end. When a is true, it means the user is pulled to the end of the right side of the data. When a// is false, it means the user is pulled to the end of the left side of the data.
maDayList: [5,10,20],// Display of MA,This parameter must be equal to DataUtil.calculate‘s maDayList
volHidden: false,// hide volume
showNowPrice: true,// show now price
isOnDrag: (isDrag){},// true is on Drag.Don't load data while Draging.
isTrendLine: false, // You can use Trendline by long-pressing and moving your finger after setting true to isTrendLine property.
xFrontPadding: 100// padding in front
),
Use Depth chart
DepthChart(_bids, _asks, chartColors) //Note: Datas must be an ordered list,
Dark | Light Theme
ChartColor helped to set the color for the chart. You need to flexibly change according to your theme configuration to ensure UI.
If you need to apply multi theme, you need to change at least the colors related to the text, border, grid and background color