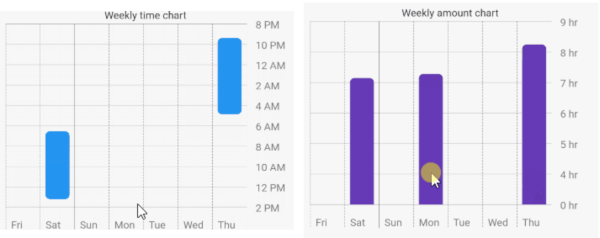
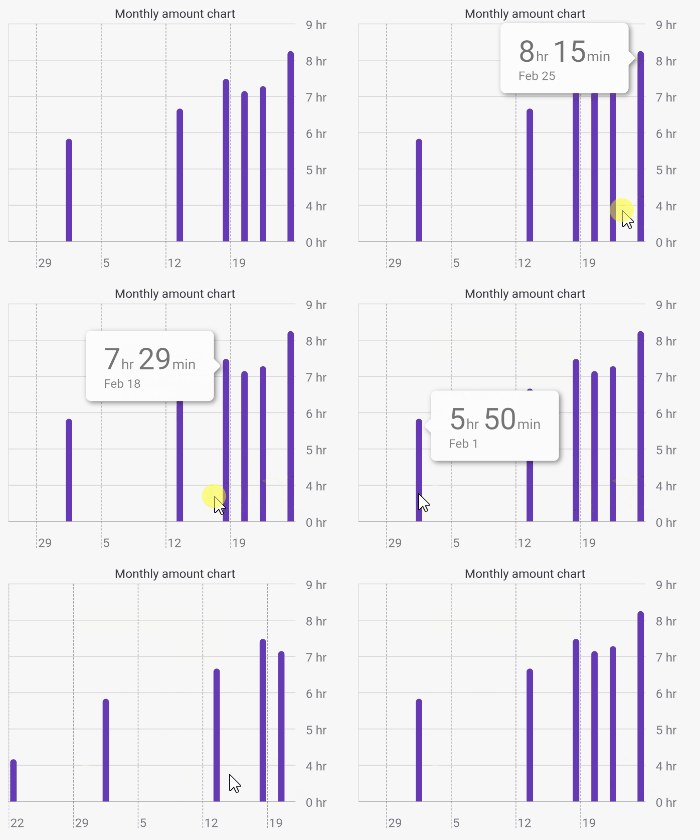
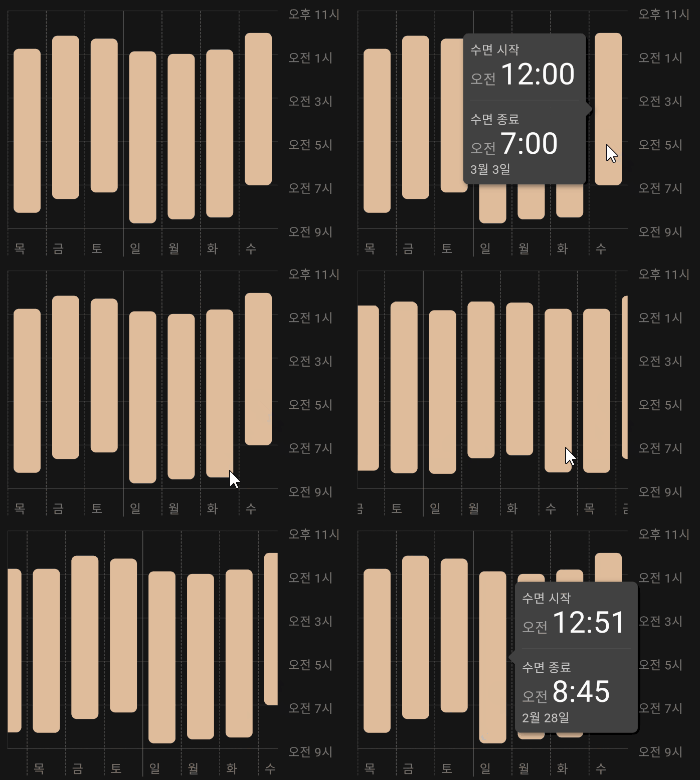
time_chart는 시간 데이터를 시각화하기 위해 스크롤 가능한 시간 차트를 제공하는 Flutter 패키지입니다. 현재 영어와 한국어를 지원하여 더 넓은 대상에게 접근 가능합니다. 부드러운 스크롤링과 반응형 렌더링을 설계하여 개발자가 시계열 데이터를 쉽게 표시할 수 있도록 합니다. Flutter 애플리케이션에 원활하게 통합되며, 대시보드, 분석 인터페이스 또는 어떤 타임라인 시각화가 필요한 앱에도 적합합니다. 가벼운 구조로 대용량 데이터셋에서도 효율적인 성능을 보장합니다.
사용 사례
대시보드에서 시계열 데이터 표시
시간에 따른 사용자 활동 시각화
실시간 애플리케이션에서 메트릭 추적
상호작용형 타임라인 만들기
모니터링 시스템 성능 로그
주요 기능
시간 데이터용 스크롤 가능한 인터페이스
영어 및 한국어 로컬라이제이션 지원
경량이고 성능이 뛰어난 렌더링
Flutter 앱과의 간편한 통합
다양한 화면 크기에 맞는 반응형 디자인
적합한 대상
모바일 앱에서의 데이터 시각화
분석 대시보드
시간 기반 모니터링 도구
다국어 애플리케이션
간단한 시간 차트를 찾는 개발자
고려 사항
수평 스크롤만 가능
en 및 ko 외의 다른 언어에 대한 내장 지원 없음
데이터 업데이트를 수동으로 처리해야 함
매우 큰 데이터 세트에 최적화되지 않음
내장된 툴팁 또는 주석 없음
원본 README
연결된 소스 저장소의 README 원문 스냅샷입니다. 최신 내용은 저장소에서 확인하세요.
time_chart
An amazing time chart in Flutter.
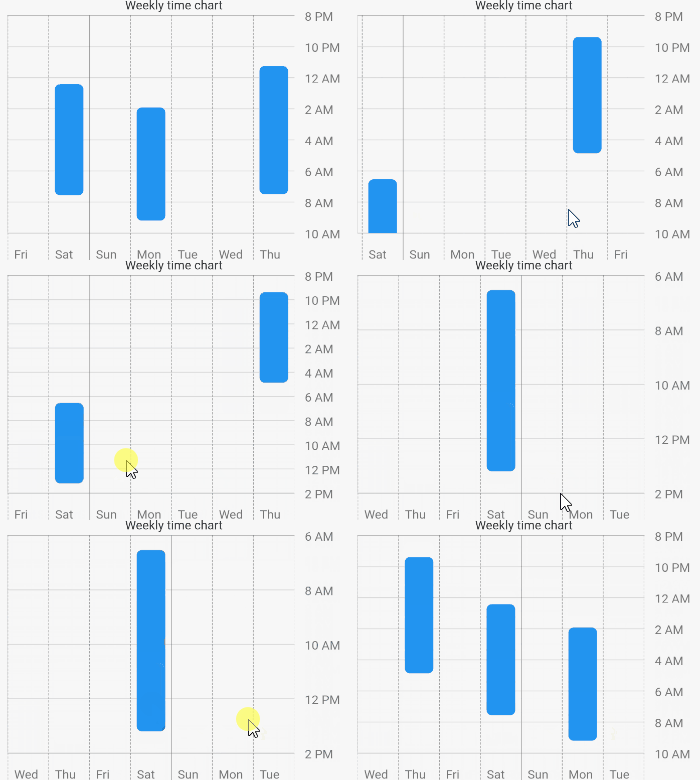
How the animation works?
The animation is created by determining the top hour and the bottom hour. The top hour denotes the most top hour displayed at the current scroll position, while the bottom hour represents its opposite. When scrolling occurs, the animation is triggered by comparing the previous top hour and bottom hour with the top hour and bottom hour after scrolling.
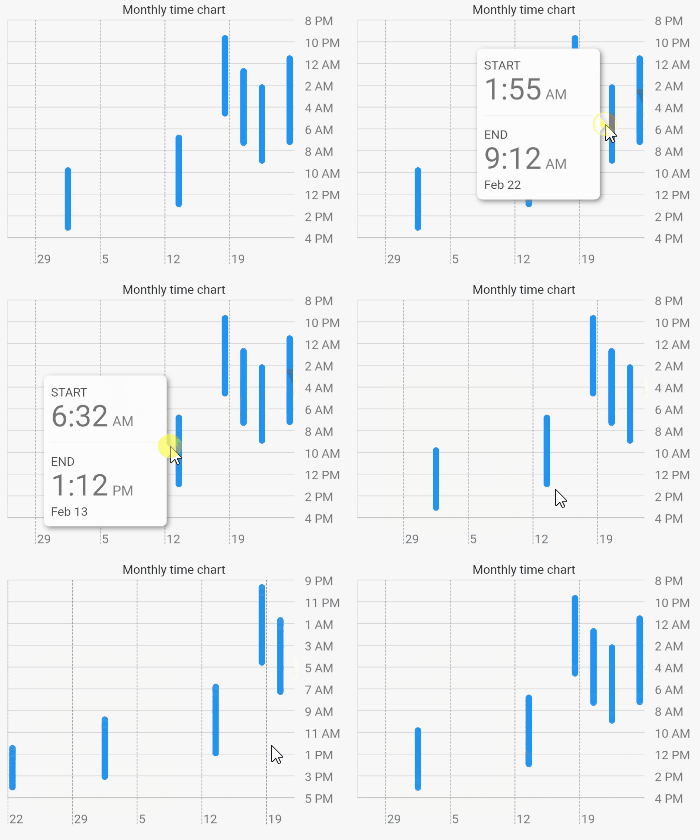
Chart Types
TimeChart
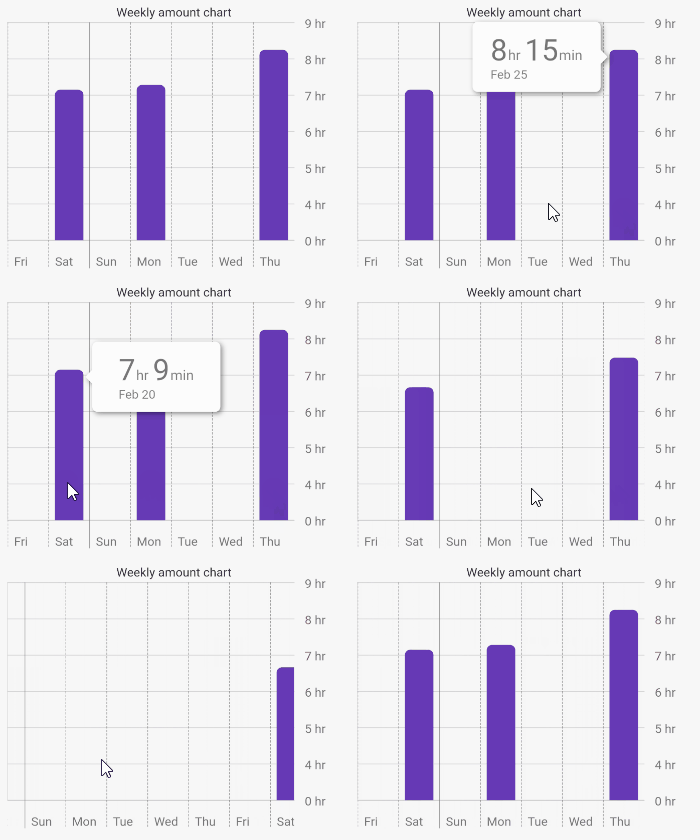
AmountChart
Getting Started
1 - Depend on it
Add it to your package's pubspec.yaml file
dependencies:time_chart:^0.5.4
2 - Install it
Install packages from the command line
flutter packages get
3 - Usage
Just input your DateTimeRange list to data: argument. The list must be sorted. First data is
latest, last data is oldest.