सार्वजनिक जानकारी से बना चयन मार्गदर्शन। केवल संदर्भ हेतु।
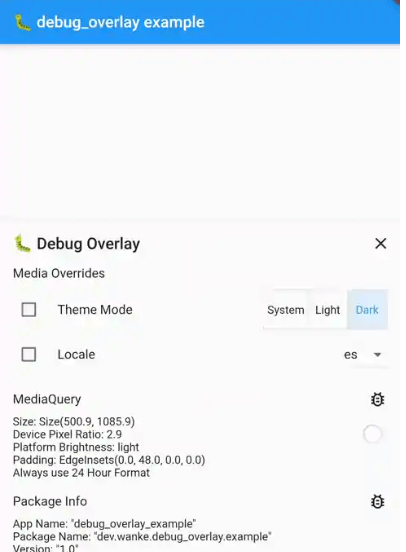
debug_overlay पैकेज फ्लटर ऐप में डेवलपमेंट के दौरान डिबग जानकारी दिखाने और सेटिंग्स को डायनामिक रूप से समायोजित करने के लिए एक केंद्रीय ओवरले प्रदान करता है। यह डेवलपर्स को रियल-टाइम ऐप मेट्रिक्स देखने, फीचर्स टॉगल करने और रिस्टार्ट के बिना राज्य की जांच करने की अनुमति देता है। ओवरले एक सरल गेस्चर के माध्यम से सुलभ है और एंड्रॉइड और आईओएस बिल्ड में बिना किसी बाधा के एकीकृत होता है। उपयोग में आसानी के लिए डिज़ाइन किया गया, यह डायग्नोस्टिक डेटा और एप्प इंटरफेस के भीतर कॉन्फ़िगरेबल विकल्पों तक त्वरित पहुंच प्रदान करके डिबगिंग कार्य प्रवाह को बढ़ाता है।
उपयोग
विकास के दौरान रीयल-टाइम डीबगिंग
तत्काल ऐप विशेषताओं को सक्रिय/निष्क्रिय करना
मॉनिटरिंग ऐप प्रदर्शन मीट्रिक्स
राज्य बदलावों की जांच करना
विभिन्न कॉन्फ़िगरेशन का परीक्षण करना
डिबग टूल्स तक त्वरित पहुँच
मुख्य विशेषताएँ
केंद्रीकृत डिबग ओवरले
गतिशील आधारित सक्रियण
लाइव सेटिंग समायोजन
Android और iOS के लिए प्लेटफॉर्म समर्थन
pub add के साथ न्यूनतम सेटअप
रनटाइम ऐप सूचना प्रदर्शन
इनके लिए उपयुक्त
सक्रिय विकास में फ्लटर विकासकर्ता
त्वरित डिबगिंग की आवश्यकता वाली टीमें
गतिशील फीचर टॉगल की आवश्यकता वाले ऐप्स
प्रोटोटाइपिंग और परीक्षण चरण
डेवलपर्स डिबगिंग के दौरान यूएक्स पर ध्यान केंद्रित कर रहे हैं
विचार योग्य बातें
उत्पादन उपयोग के लिए नहीं बनाया गया है
परीक्षण के दौरान ओवरले उपयोगकर्ता इंटरफ़ेस को प्रभावित कर सकता है
रिलीज़ से पहले हस्तक्षेप द्वारा हटाना आवश्यक है
सीमित कस्टमाइजेशन विकल्प
संवेदनशील डिबग डेटा के लिए कोई निर्मित सुरक्षा नहीं
बड़े ऐप में कुछ हद तक प्रदर्शन प्रभावित हो सकता है
मूल README
संबंधित सोर्स रिपॉज़िटरी के मूल README का स्नैपशॉट। नवीनतम सामग्री के लिए रिपॉज़िटरी देखें।
debug_overlay
🐛 View debug infos and change settings via a central overlay for your app.
To add a debug overlay to your app, pass DebugOverlay.builder() to MaterialApp/CupertinoApp/WidgetsApp.builder:
MaterialApp(
  builder: DebugOverlay.builder(),
  // And other customization...
)
The debug overlay only works in debug mode and is not included in your widget tree in profile or release mode unless you pass enableOnlyInDebugMode: false.
To open the overlay, call DebugOverlay.show().
By default, this overlay includes MediaQueryDebugHelper, PackageInfoDebugHelper, and DeviceInfoDebugHelper.
Debug Helpers
To add a debug helper, you have to register it by calling either of the following two (which accept any sliver widget):
DebugOverlay.prependHelper(myDebugHelper) to add it to the front of the list
DebugOverlay.appendHelper(myDebugHelper) to add it to the end of the list
Or, if you want to override all currently registered overlays, set DebugOverlay.helpers.value to a list of sliver widget.
The error field can also hold data for non-error logs.
If it stores JSON data (on an object with a toJson() method), the data can be inspected using json_view.
MediaOverridesDebugHelper
This allows you to override the theme mode and locale of your app. To use it, follow these steps:
Store its mutable state, e.g., in a global variable:
final mediaOverrideState = ValueNotifier(MediaOverrideState());
Register the helper and supply its state, e.g., in main():
voidmain() {
if (kDebugMode) {
DebugOverlay.prependHelper(MediaOverrideDebugHelper(
mediaOverrideState,
// To support overriding locales, this value must be set and should// contain the same locales as passed to [MaterialApp.supportedLocales],// [CupertinoApp.supportedLocales] or [WidgetsApp.supportedLocales].
supportedLocales: supportedLocales,
));
}
runApp(MyApp());
}
When building your MaterialApp/CupertinoApp/WidgetsApp, wrap it in a ValueListenableBuilder that uses the state from step 1:
ValueListenableBuilder<MediaOverrideState>(
valueListenable: mediaOverrideState,
builder: (context, overrideState, child) {
returnMaterialApp(
// You can access overridden values via [overrideState]:
themeMode: overrideState.themeMode,
locale: overrideState.locale,
builder: DebugOverlay.builder(),
supportedLocales: supportedLocales,
// And your other customizations...
);
},
);
To implement your own debug helper, you can use the provided DebugHelper class for the layout.
If your information can be represented with Flutter's DiagnosticsNode, you can use DiagnosticsBasedDebugHelper which automatically provides filtering.
This is also used internally by DeviceInfoDebugHelper, MediaQueryDebugHelper, and PackageInfoDebugHelper.