Charts painter 
Idea behind this lib is to allow highly customizable charts. By having items and decorations as Widgets or predefined renderers where you can achieve the look of desired chart.
Read the migration guide if you are interested in migrating from 2.0 to 3.0.
Check out web demo to see what’s possible to do with the charts_painter
Usage
Add it to your package’s pubspec.yaml file
charts_painter: latest
Start with the Chart
The Widget you can use is Chart or AnimatedChart if you want to show animations when changing chart state. It has parameters of height, width and ChartState.
Chart State
ChartState describes how the chart should look. The chart drawing is divided into sections, so the ChartState has these parameters:
- Data: What is the data that needs to be shown
- Item options: How to draw that data points into items on chart
- Decorations: Various additional objects that enhance and completes look of the chart. They are divided into backgroundDecorations (behind items) or in foregroundDecorations (in front of items).
- Chart behaviour: Not used for drawing, but contain scrollable and item click logic
Now we will explain each of these:
Data
The ChartData only required parameter is List<List<ChartItem>>. So, most basic data would look like:
ChartData([
    [
      ChartItem(2),
      ChartItem(5),
      ChartItem(7),
      ChartItem(11),
      ChartItem(4),
    ]
  ])
The reason for double list (List<List<) is that you can display multiple data lines alongside each other.
ChartData([
    [2, 6, 8, 4, 6, 8].map((e) => ChartItem<void>(e.toDouble())).toList(),
    [3, 5, 2, 7, 0, 4].map((e) => ChartItem<void>(e.toDouble())).toList(),
  ],);
Chart Item requires max height parameter, but also has optional min and T value which can be any kind of value
that you can attach to your items, if you have need for it.

When displaying multiple data lines, you might be interested in dataStrategy parameter. It controls how these multiple lines are drawn. For example, if you want to stack bars, one on top of another, you can use StackDataStrategy.
Parameter valueAxisMaxOver will add that value to currently the highest value that functions like a some sort of top padding.
Item options
For item options, you can use one of three defined options:
BarItemOptions - for drawing bar or candle itemsBubbleItemOptions - for draw bubble itemsWidgetItemOptions - for drawing any kind of widget.
You could create anything with WidgetItemOptions, but Bar and Bubble are often used and here they are drawn directly on canvas to make sure chart is performant. This graphic might help when choosing:

Options have several parameter, and the required is itemBuilder. With it, you describe how to build an item. For example, to make bar item:
barItemBuilder: (data) {
    return BarItem(
      radius: const BorderRadius.vertical(
        top: Radius.circular(24.0),
      ),
      color: Colors.red.withOpacity(0.4),
    );
  },
The data that’s passed into the builder can be used to build different kind of item based on the item value (data.item.value), his index in data (data.itemIndex) or based on which data list it belongs to (data.listIndex).
Besides builder, the other useful parameters in item options are maxBarWidth , minBarWidth , startPosition , padding.
If you want to listen to item taps you can do it by setting ChartBehaviour(onItemClicked) - you can read more about ChartBehaviour below.
In case of a WidgetItemOptions, you could also provide GestureDetectors and Buttons and they will all work.
Decorations
Decorations enhance and complete the look of the chart. Everything that’s drawn on a chart, and it’s not a chart item is considered a decoration. So that means a lot of the chart will be a decoration. Just like with the items, you can use WidgetDecoration to draw any kind of the decoration, but the most common cases for decoration are already made on a canvas and ready to be used:
Widget decoration
There are only two parameters in WidgetDecoration:
WidgetDecoration(
widgetDecorationBuilder: (context, chartState, itemWidth, verticalMultiplayer) {
return Container();
},
margin: const EdgeInsets.only(left: 20),
)
The builder returns context, chartState where from you can read details like all the values. And itemWidth and verticalMultiplier can help with laying out and position the decoration:

If you do add margins to the chart, your decoration widget will be positioned from start of the chart (not affected by the margins), so you can draw in the margins.
You can add padding that equals the chart margins which will set you to the start of the first item so calculations including itemWidth or verticalMultiplier works correctly:
    widgetDecorationBuilder: (context, chartState, itemWidth, verticalMultiplayer) {
      return Padding(padding: chartState.defaultMargin, child: YourWidget());
    },
Chart behaviour
Chart behaviour has just two parameters:
scrollSettings - used to config the chart to be scrollable or not. You still need to wrap it with SingleChildScrollView.onItemClicked - when set the tap events on items are registered and will invoke this method.
If you're using WidgetItemOptions, you could set a gesture detector there, but this works with both BarItemOptions, BubbleItemOptions and WidgetItemOptions.
Complete example
So, to wrap all of this up. The most minimal example of a bar chart with data, barItemOptions* and no decorations would looks like:
Chart(
    state: ChartState<void>(
      data: ChartData(
          [[3,5,7,9,4,3,6].map((e) => ChartItem<void>(e.toDouble())).toList()]
      ),
      itemOptions: BarItemOptions()
    ),
  );
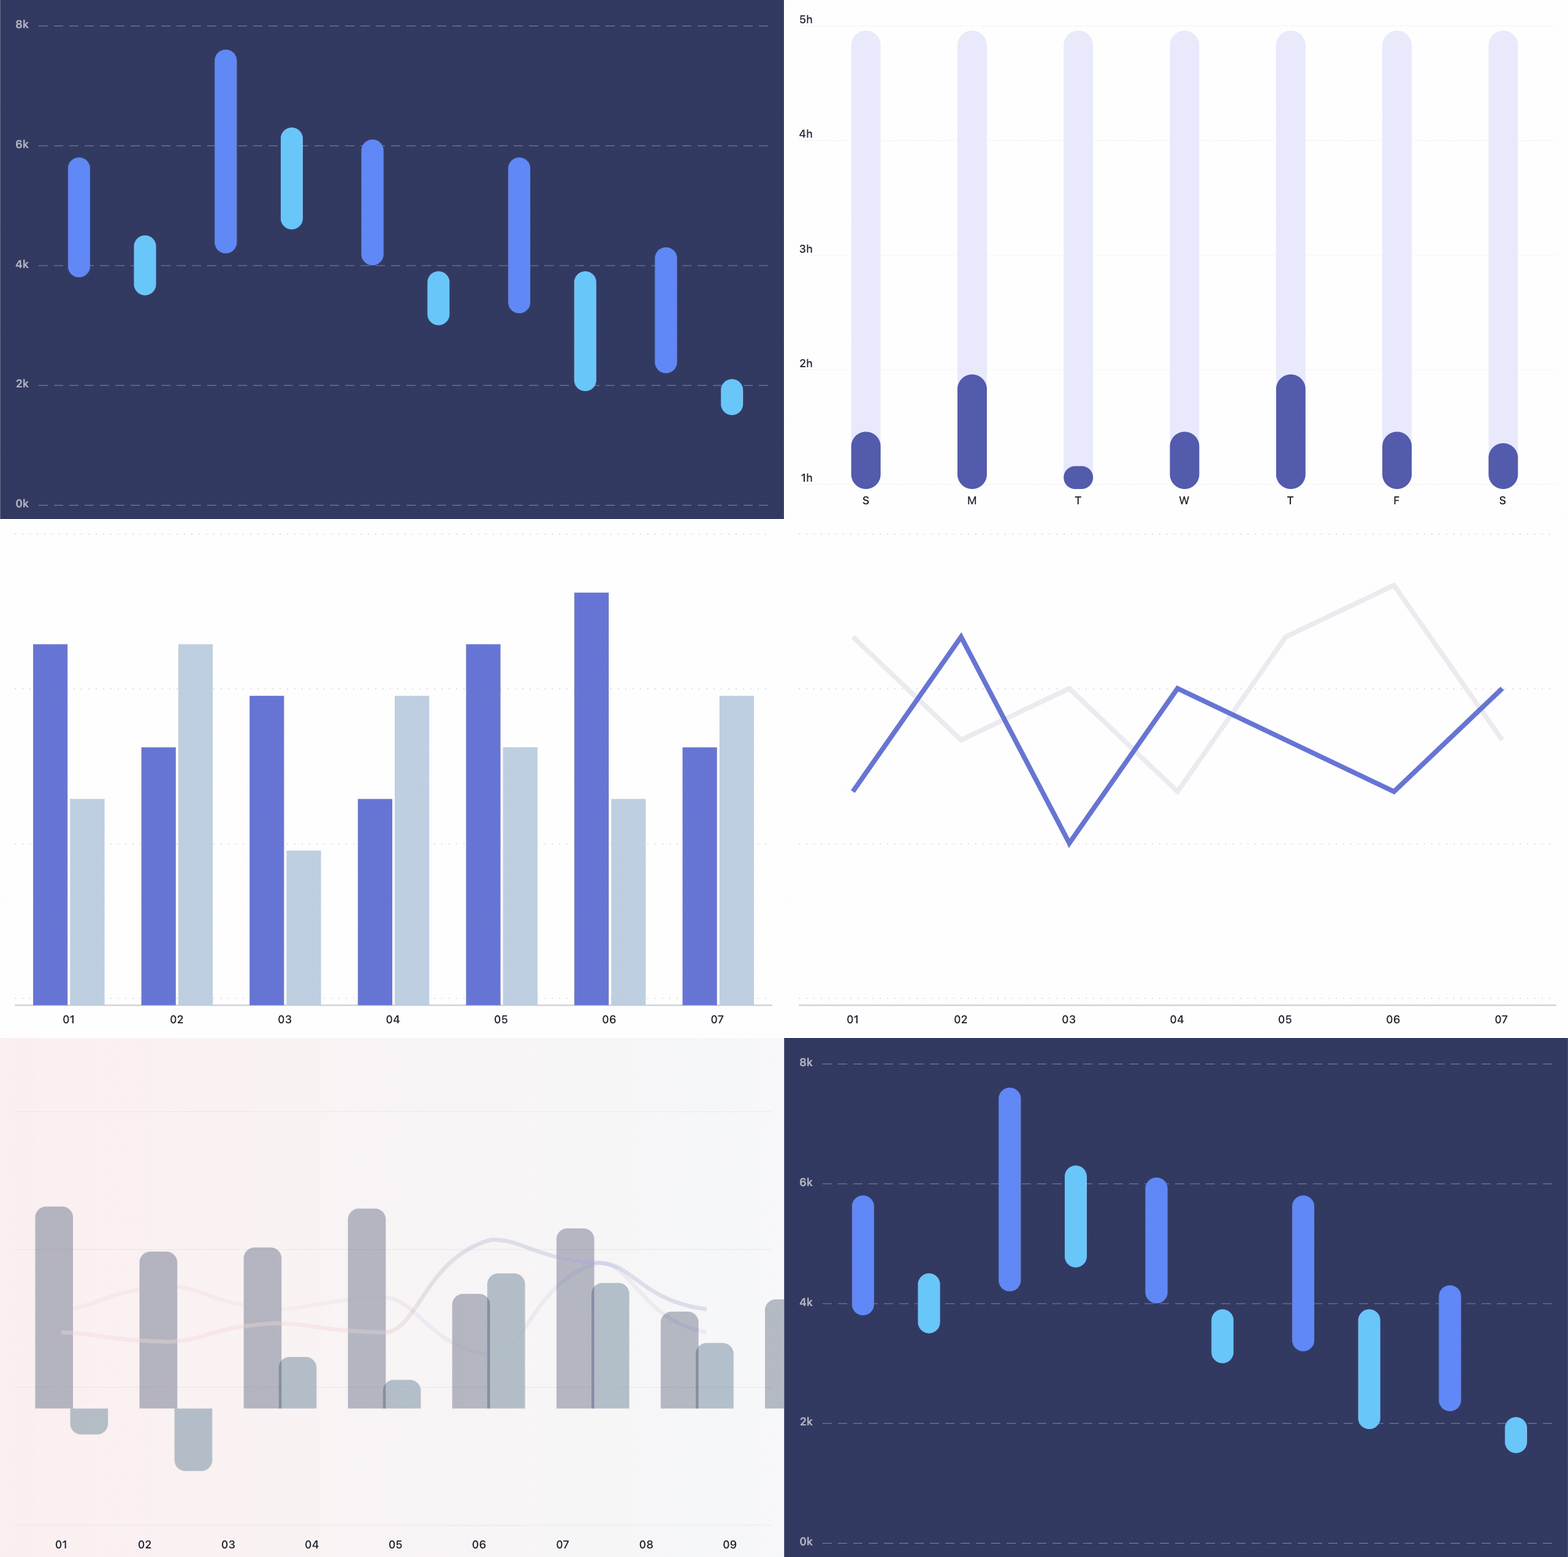
Which will produce a chart looking like:

A bit more complex example with two data lists coloured differently and grid decoration would look like:
Chart(
state: ChartState<void>(
data: ChartData(
[
[3, 5, 7, 9, 4, 3, 6].map((e) => ChartItem<void>(e.toDouble())).toList(),
[5, 2, 8, 4, 5, 5, 2].map((e) => ChartItem<void>(e.toDouble())).toList(),
],
),
itemOptions: BarItemOptions(barItemBuilder: (itemBuilderData) {
return BarItem(color: itemBuilderData.listIndex == 0 ? Colors.red : Colors.blue);
}),
backgroundDecorations: [
HorizontalDecoration(axisStep: 2, showValues: true),
])
);
Which produces a chart:

There’s a lot more things possible with this package, but to keep this README readable, we recommend you checking out the demo and showcase web app.
Scrollable chart
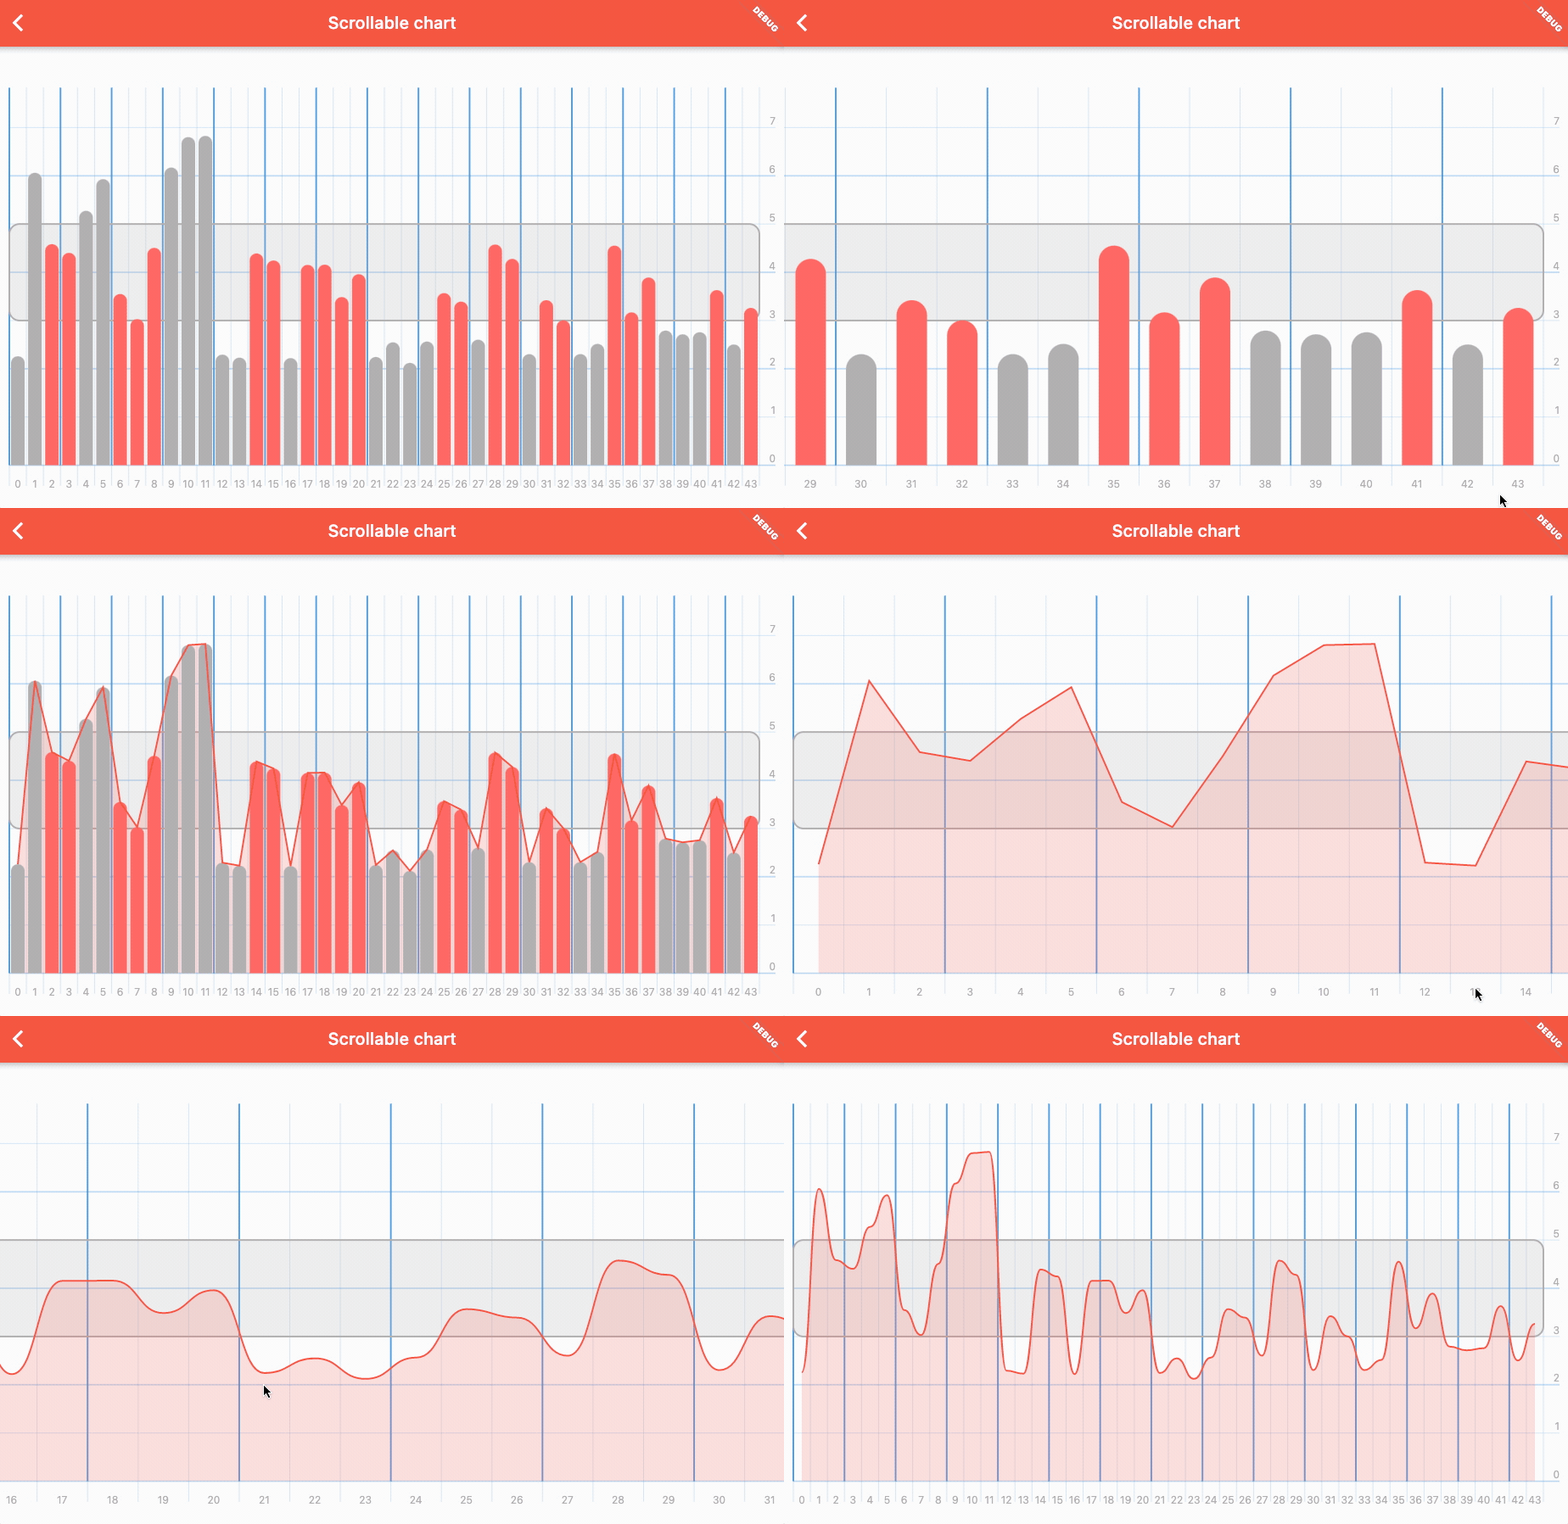
Charts can also be scrollable, to use scroll first you have to wrap chart your chart in SingleChildScrollView widget. Then in ChartBehaviour make sure you set isScrollable to true.
scrollable_chart
To make sure you can make any chart you want, we have included DecorationsRenderer as widget that you can use outside of the chart bounds. That is useful for fixed legends:
More examples
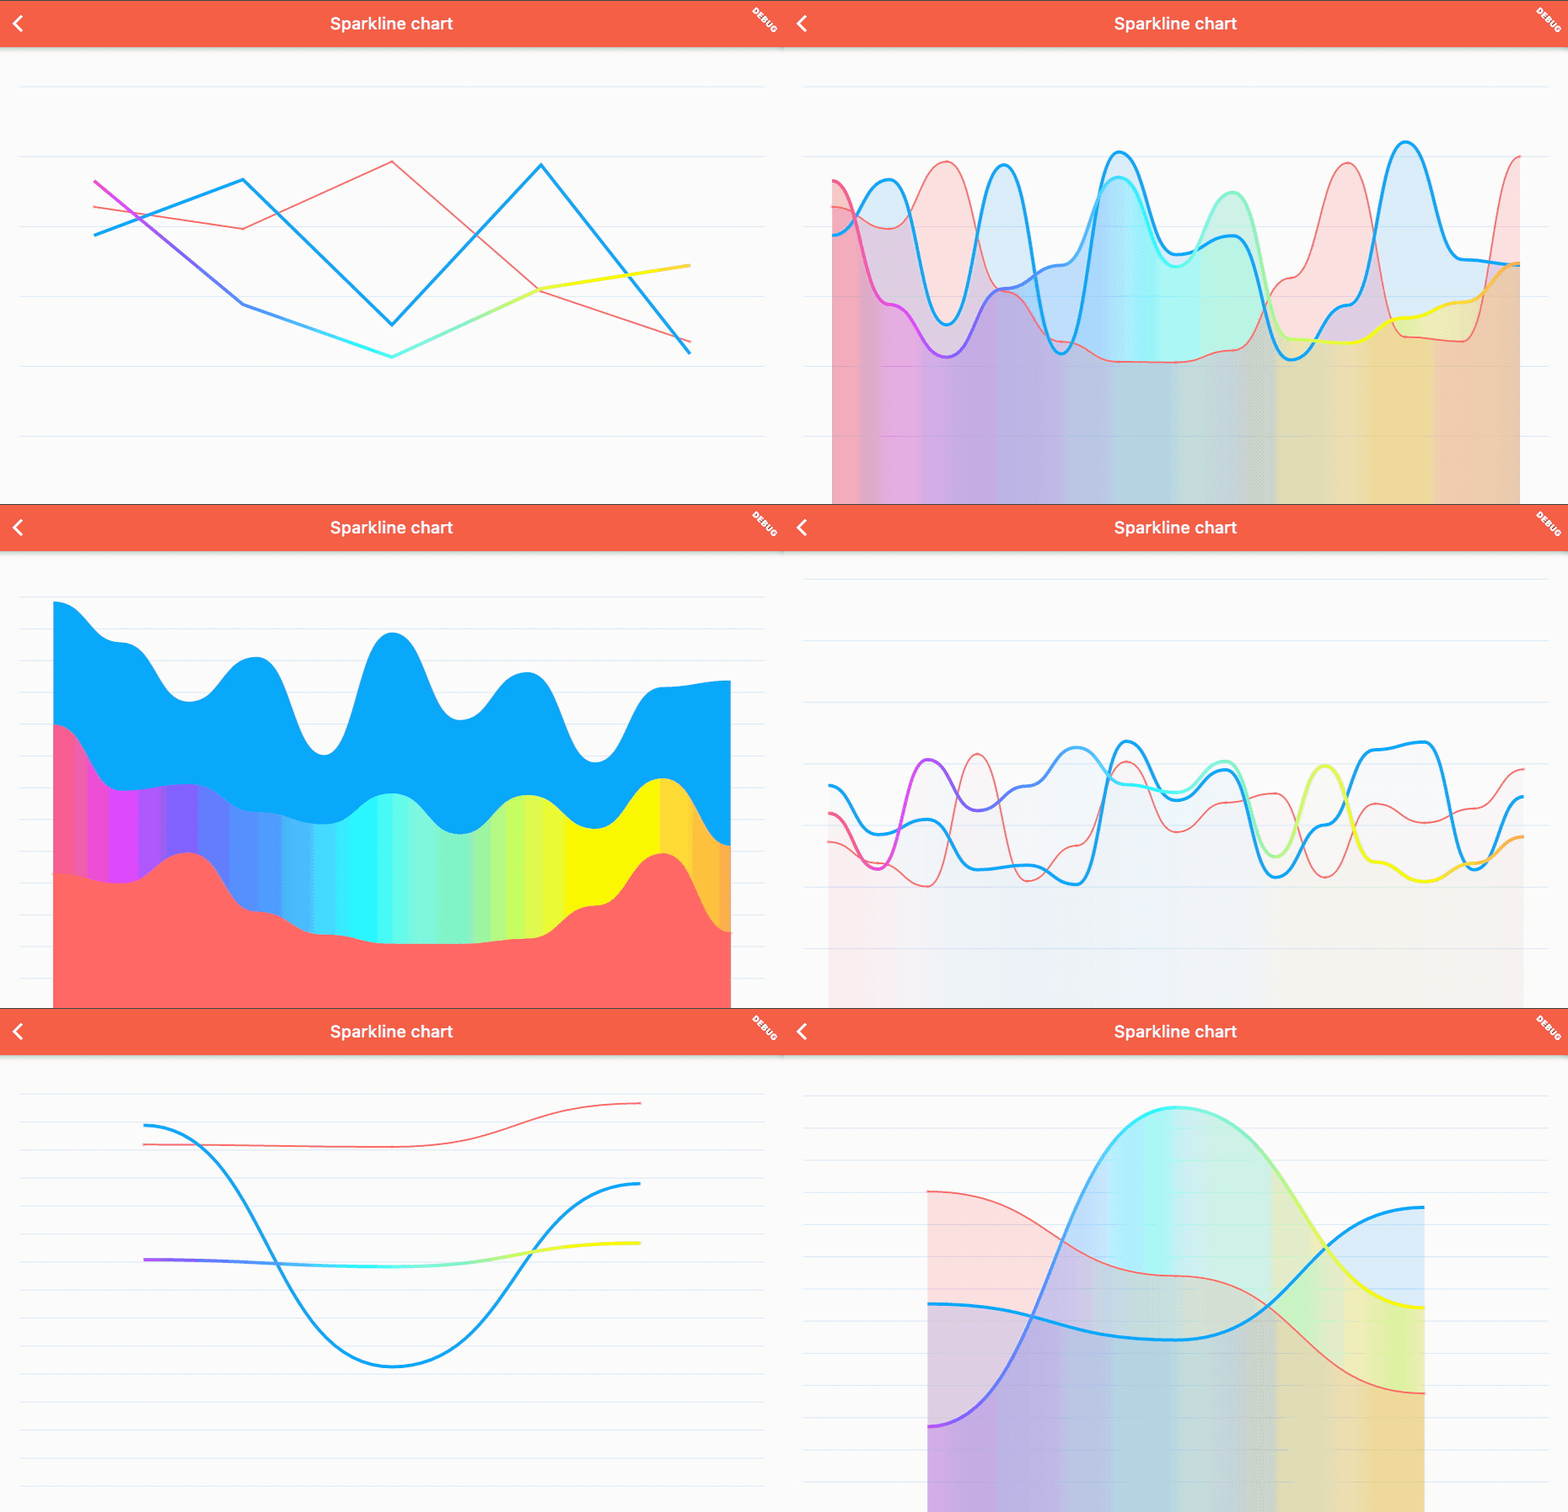
Line charts
Line chart with multiple values
example code
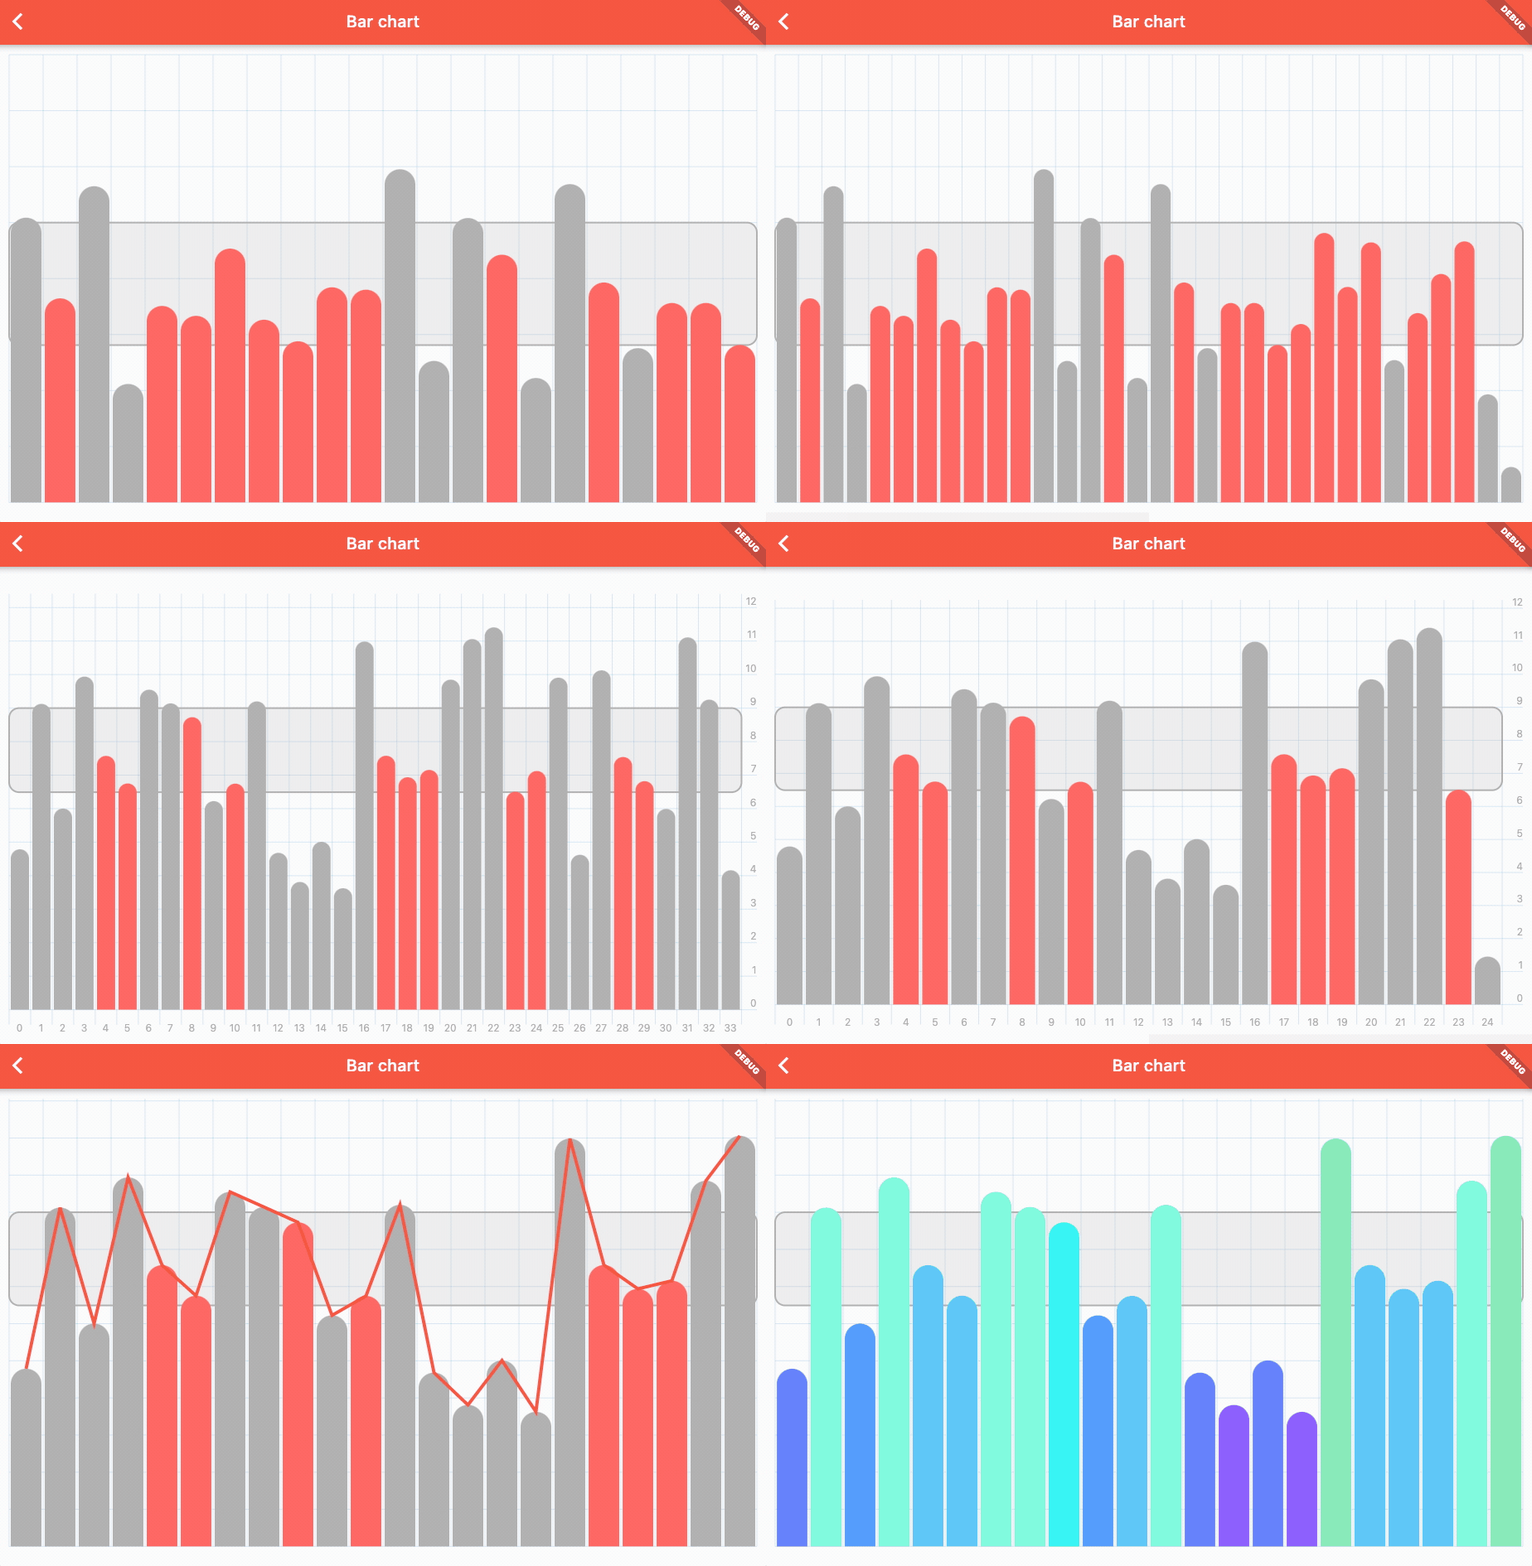
Bar charts
Bar chart with area
example code



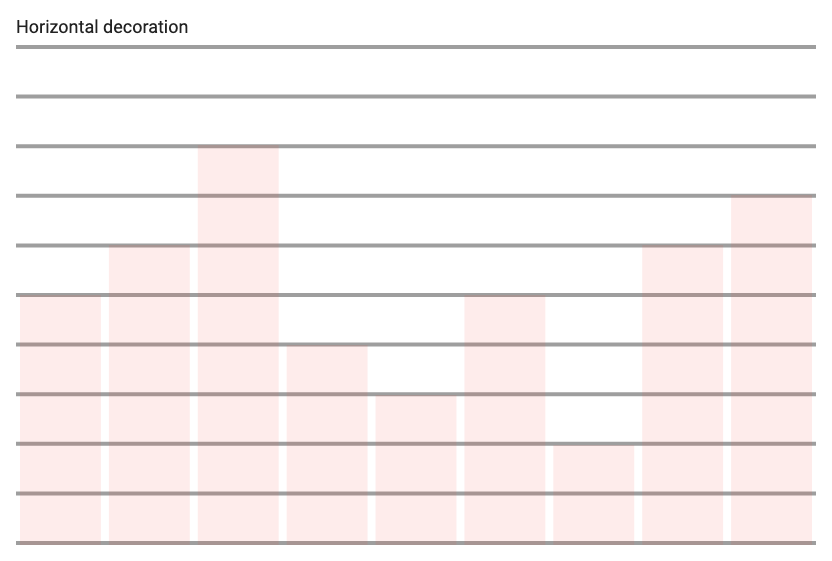 Horizontal decoration
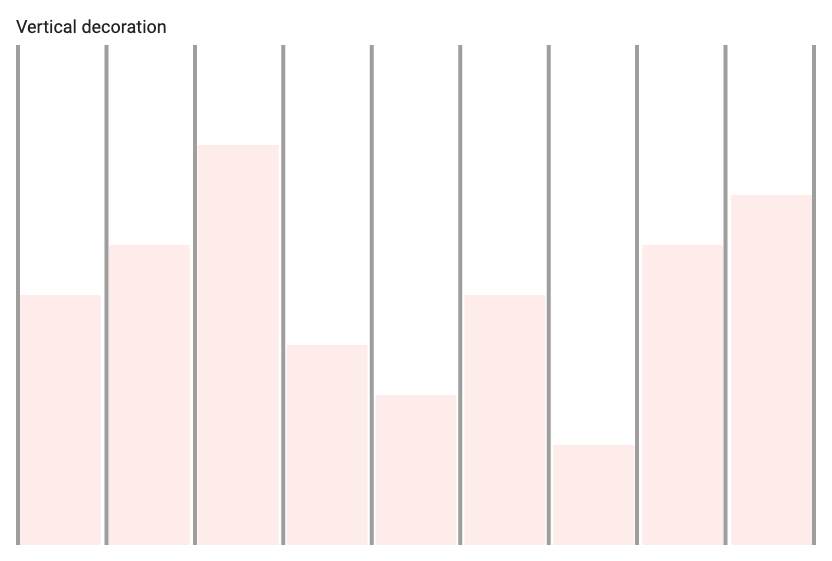 Vertical decoration
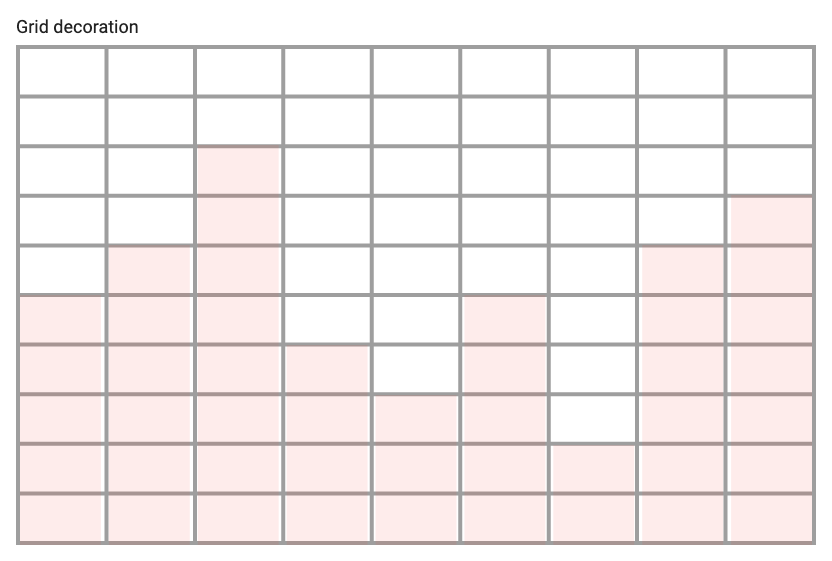 Grid decoration
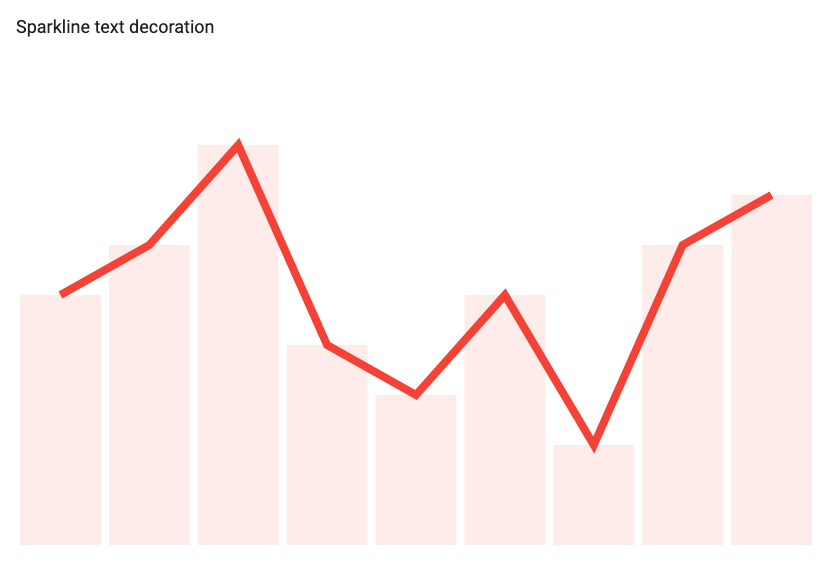 Sparkline decoration