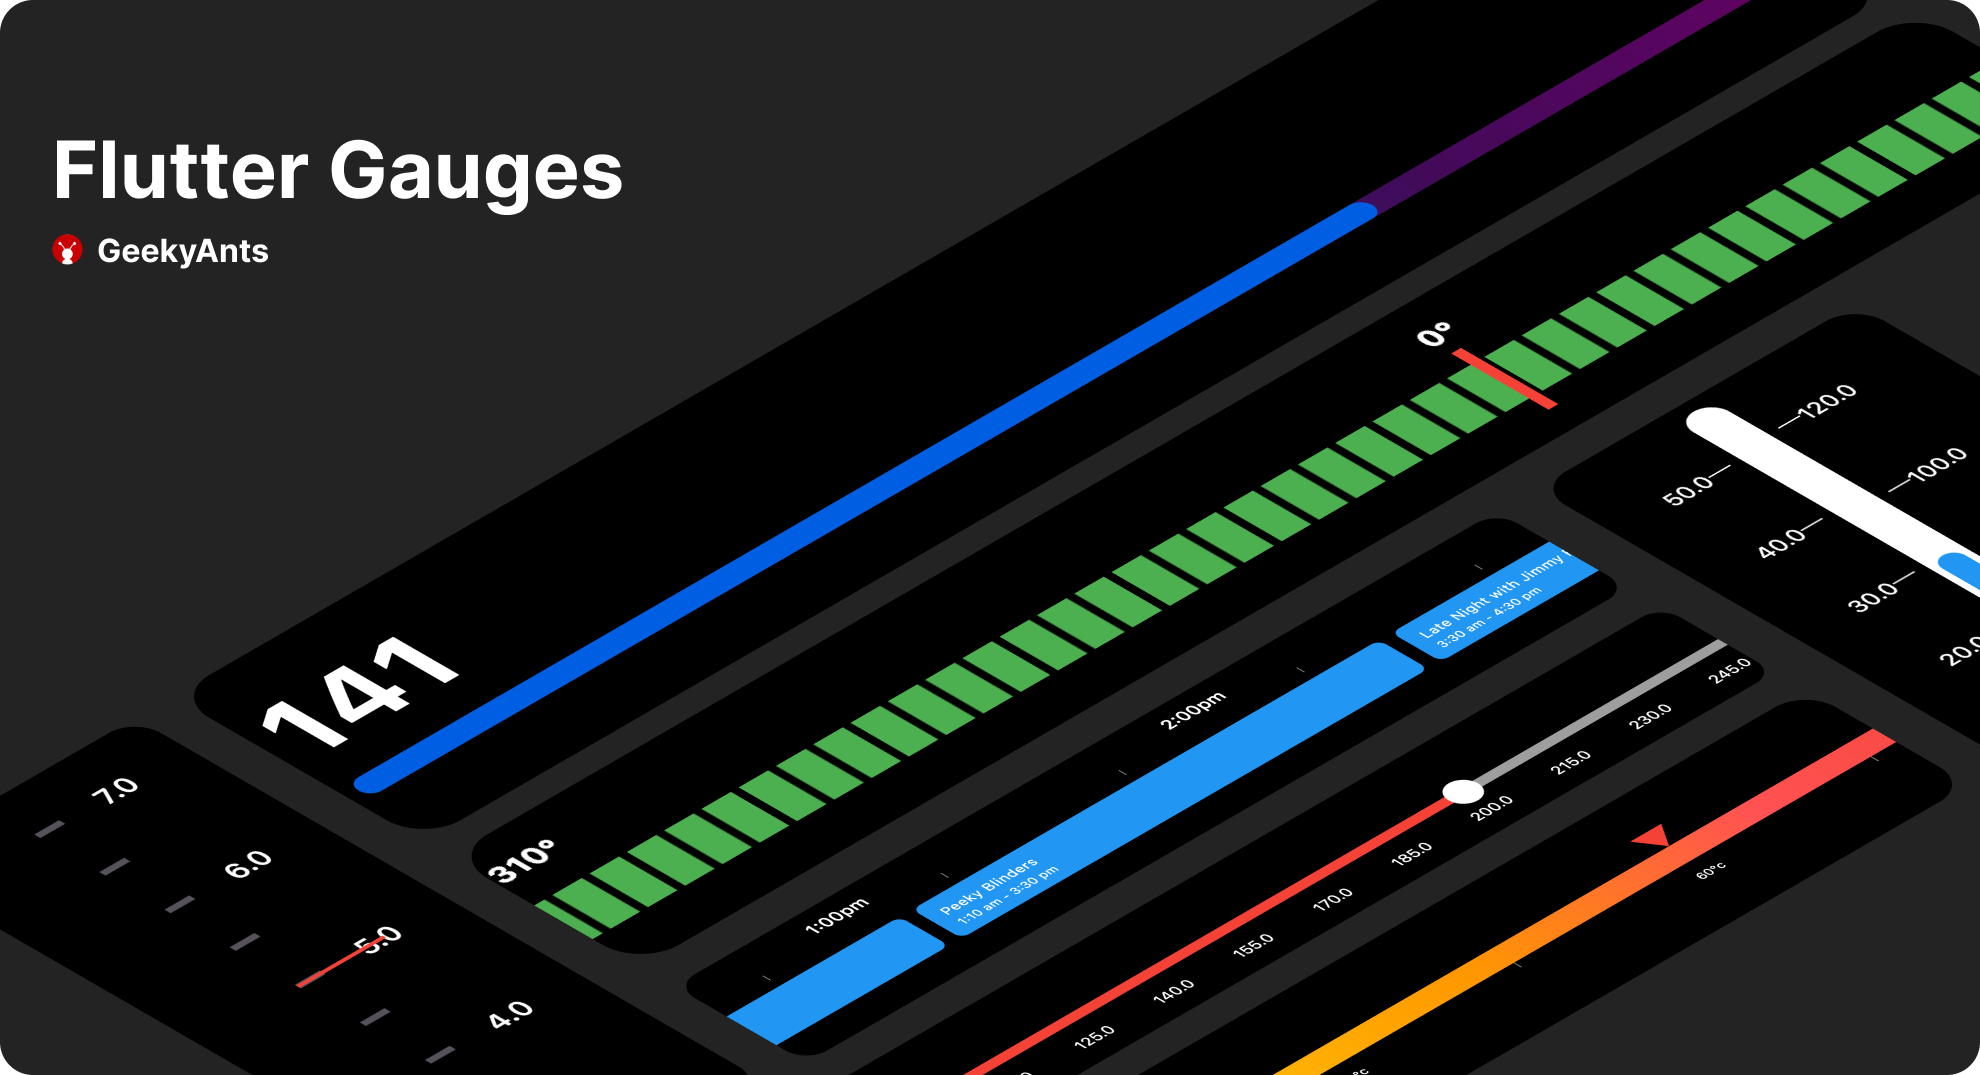
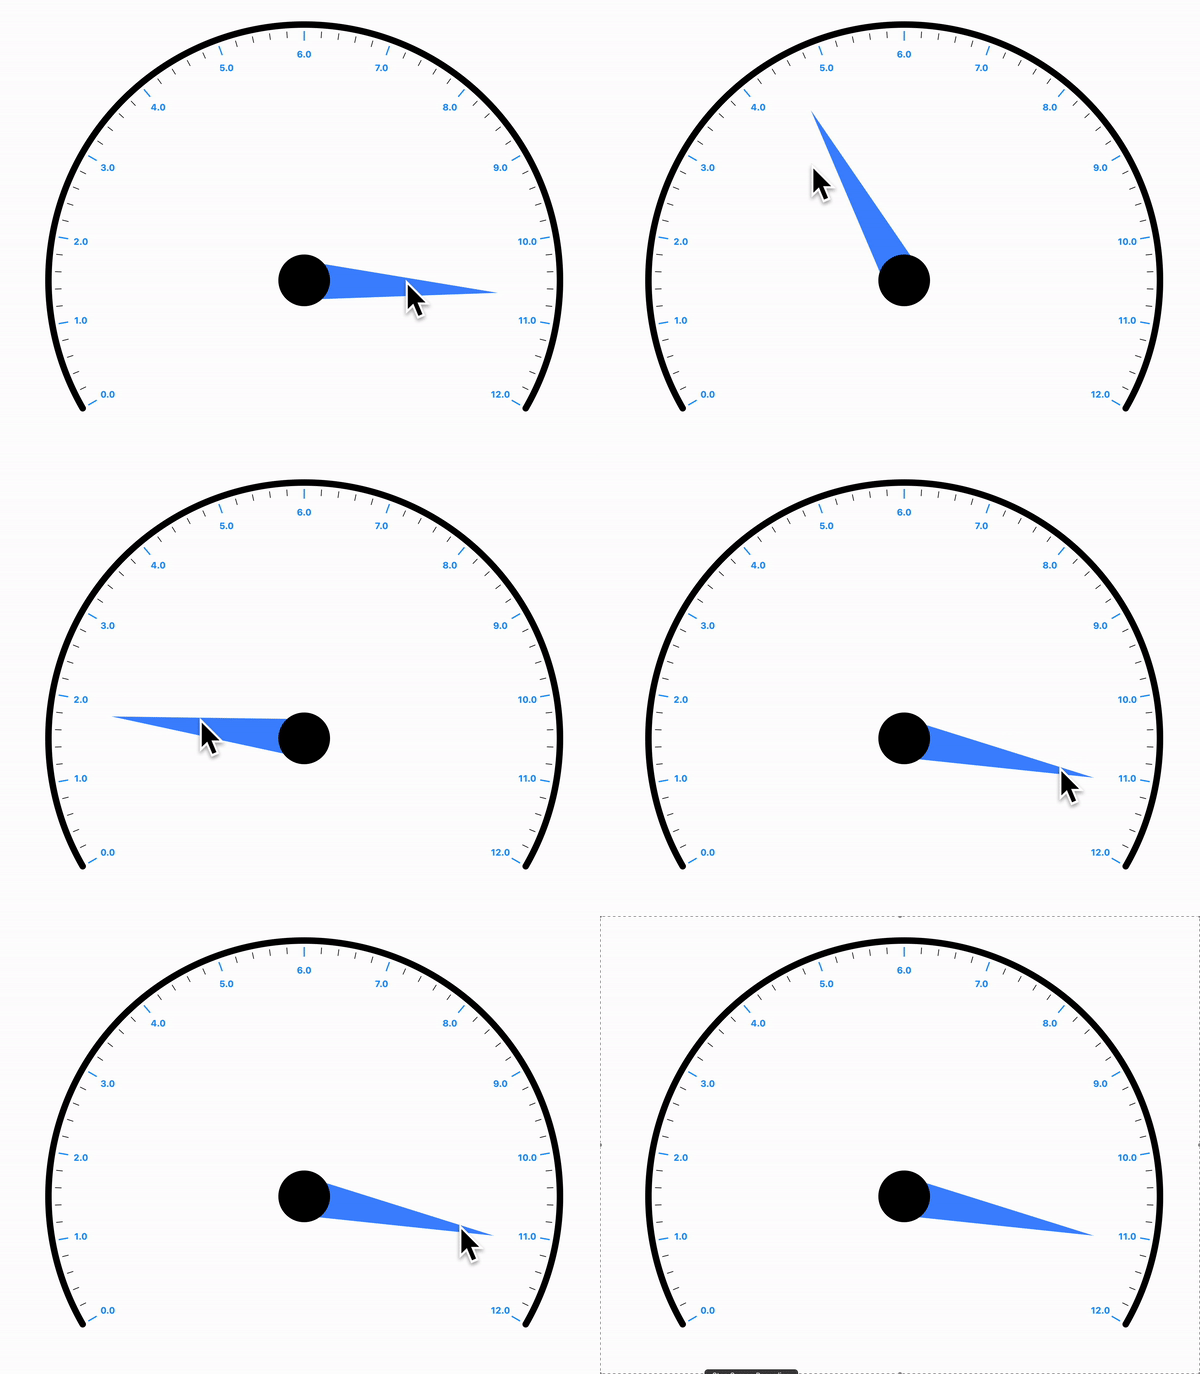
一个可自定义的线性仪表盘包,适用于 Flutter,旨在以视觉方式表示进度或数据值。它支持多种样式选项,用于外观和行为,非常适合仪表板、健康追踪器或性能指标。该仪表盘在 Android、iOS、Web、macOS、Windows 和 Linux 等多个平台上均具有响应式表现。通过直观的配置,开发者可以轻松将流畅、动画化的进度显示集成到其应用中。
适合场景
仪表板小部件
进度跟踪
性能监控
健康与健身应用
仪表板中的数据可视化
主要特点
可自定义外观
动画进度显示
跨平台支持
可配置的范围和标签
响应式设计
支持多种主题
适合对象
开发数据仪表板的开发者
需要视觉进度指示器的应用程序
具有跨平台需求的项目
寻求可复用组件的UI设计师
使用建议
仅限线性仪表盘(无圆形变体)
需要手动处理动态更新
复杂布局可能需要额外的样式
原始 README
以下为关联源码仓库的 README 原文快照,最新内容请访问源码仓库。
Gauges
A gauge, in science and engineering, is a device used to make measurements or in order to display certain dimensional information. A wide variety of tools exist which serve such functions, ranging from simple pieces of material against which sizes can be measured to complex pieces of machinery.Here in Flutter you can use this package to plot a machinery information effortlessly.
Demo Application
To fully explore the capabilities of our Linear Gauge, we recommend checking out our Demo Application which consists of Use Cases and Playgrounds for Linear Gauge
DEMO APPLICATION
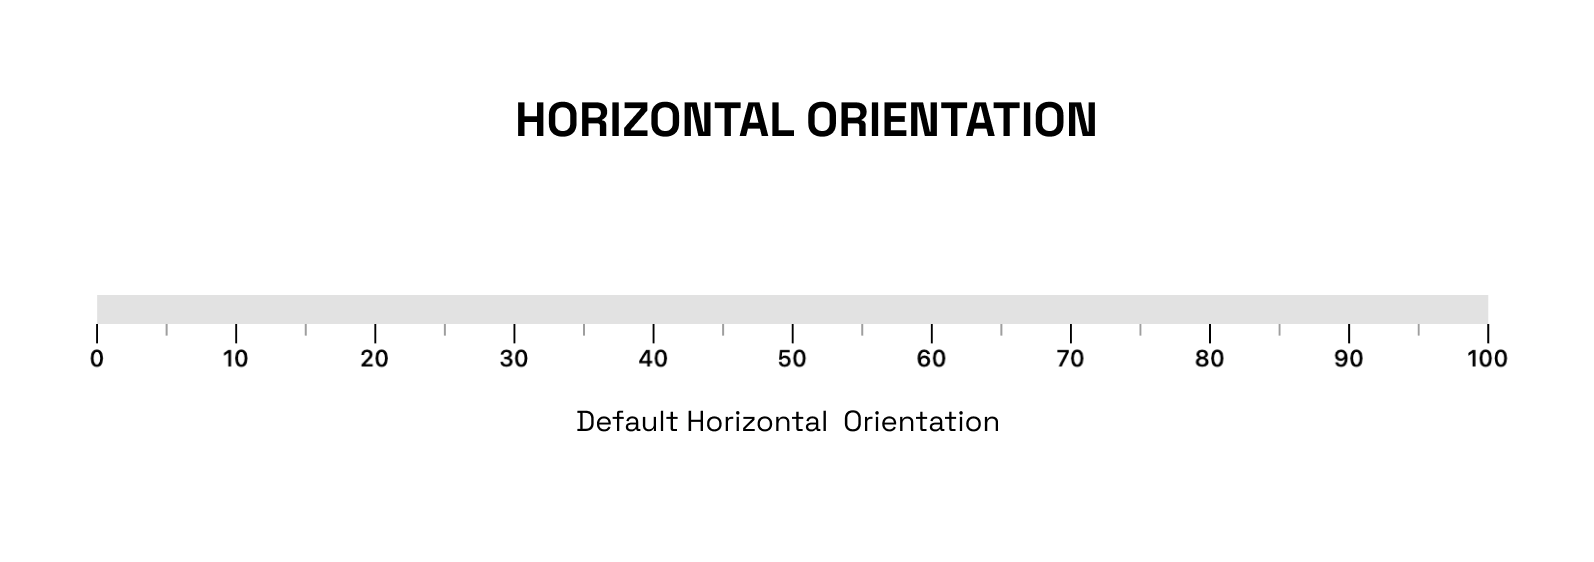
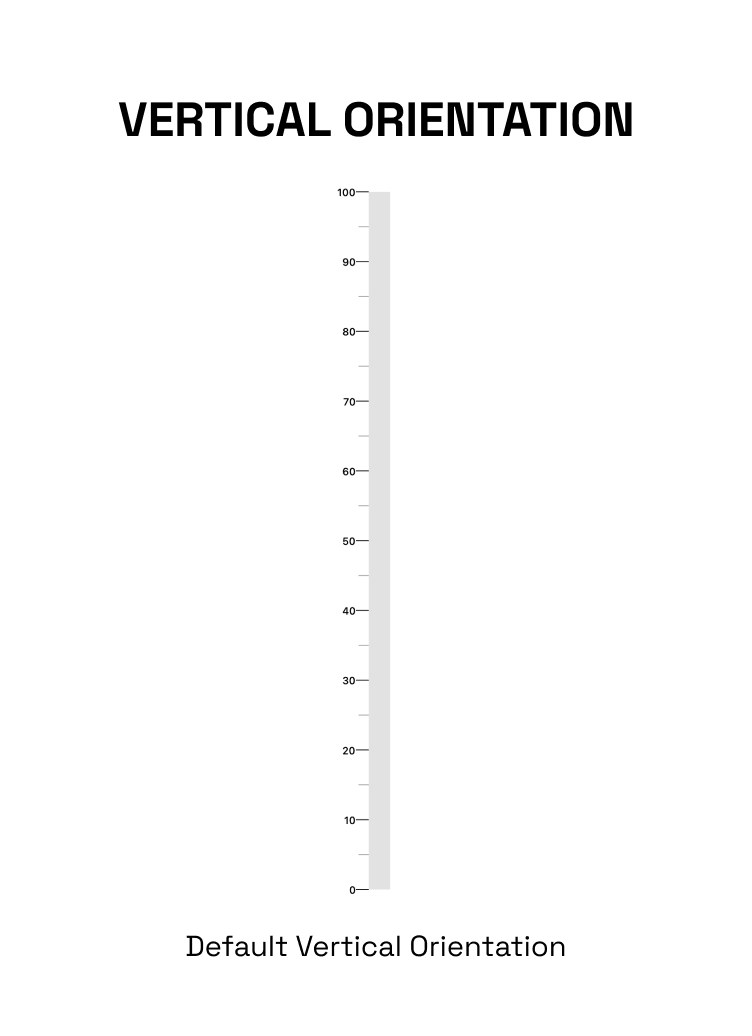
The linearGauge can be oriented vertically or horizontally. The orientation can be set using the Gaugeorientation property in the Linear Gauge. The possible values for the orientation property are:
GaugeOrientation.horizontal: The gauge will be oriented horizontally, with the minimum value on the left and the maximum value on the right.
GaugeOrientation.vertical: The gauge will be oriented vertically, with the minimum value at the bottom and the maximum value at the top.
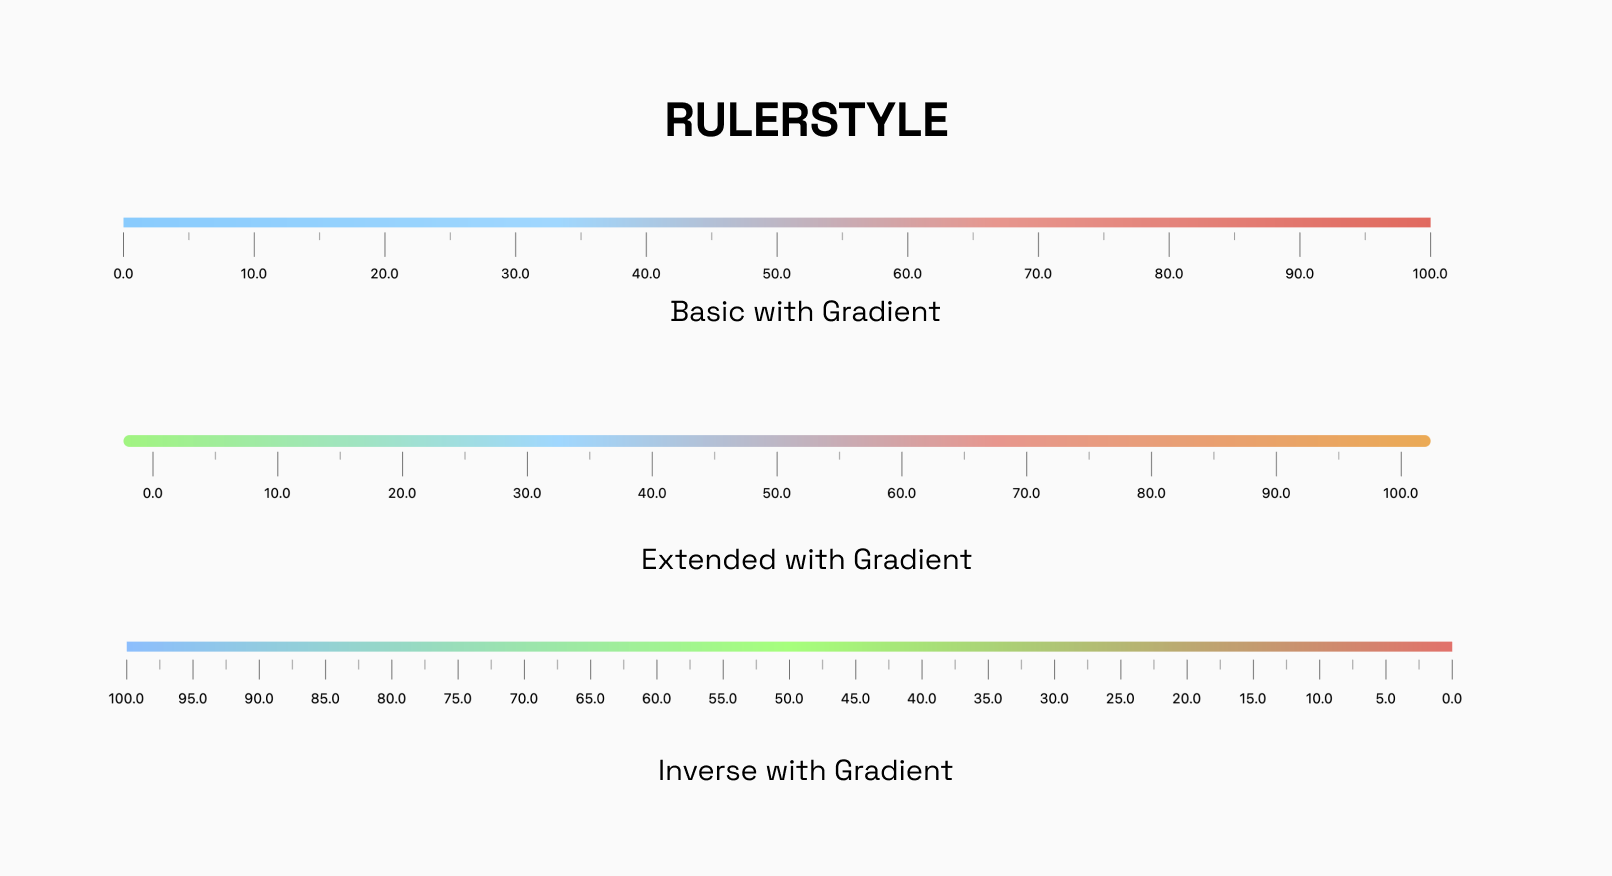
RulerStyle:
The RulerStyle class allows you to customize the appearance of the ruler used in the LinearGauge. With properties such as RulerPosition, showLabel, inverseRuler, and many more, you can customize the ruler in various ways to suit your needs.
Pointer:
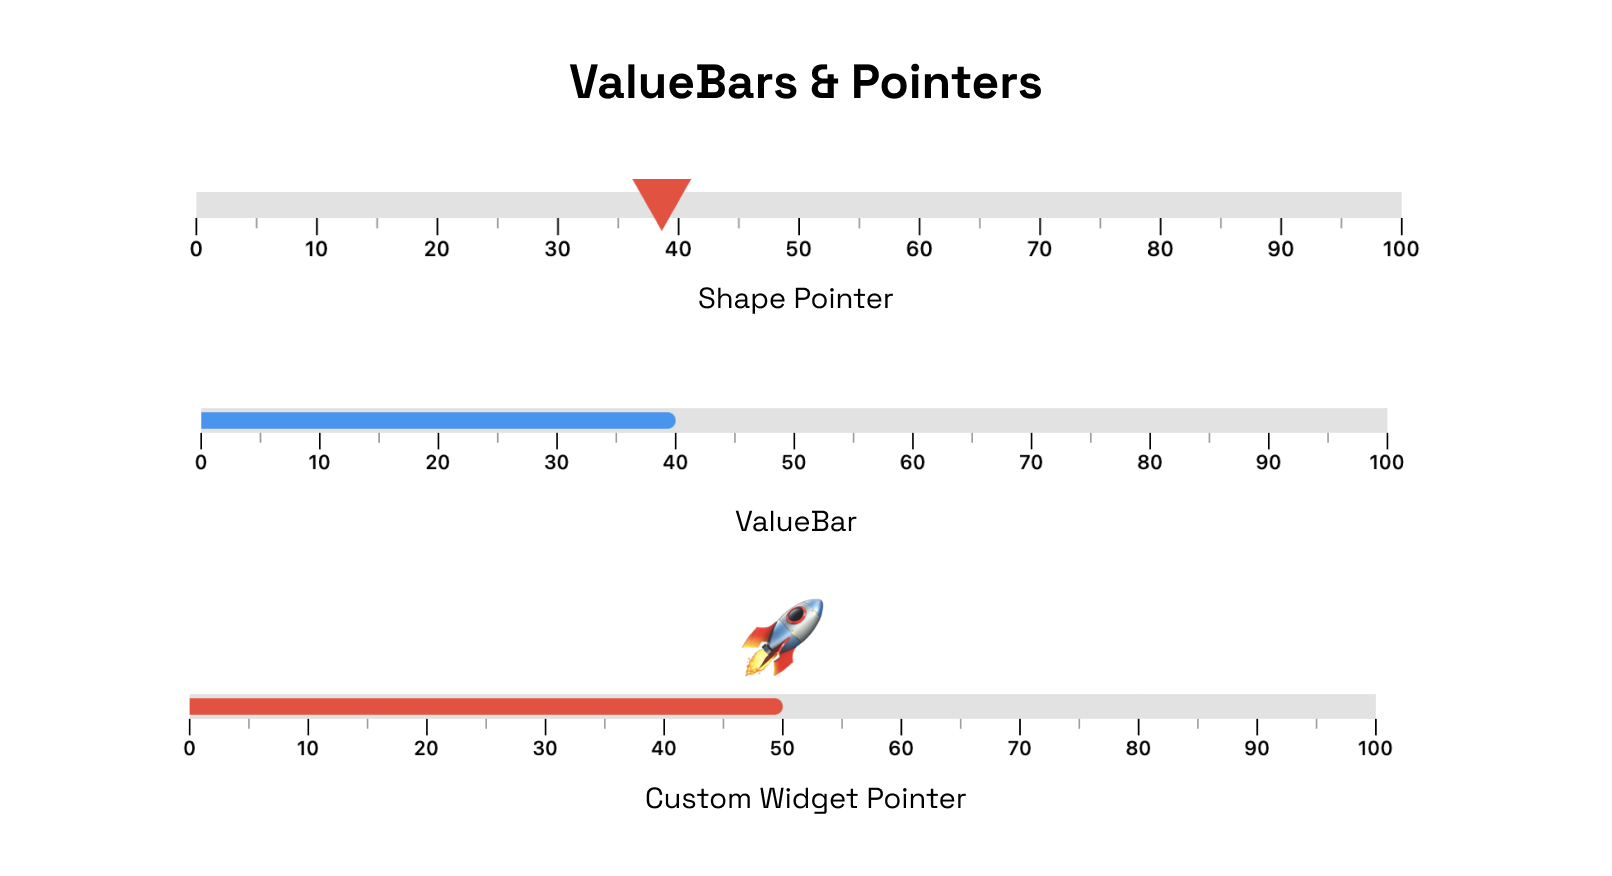
The Pointer is used to indicate a specific value on the gauge. The gauge can have multiple pointers with various shapes and values
ValueBar
The ValueBar in the LinearGauge is the component that displays the actual value of the gauge. It has properties such as color, offset, and thickness that can be customized to fit your needs.
There are different customization options available for pointers and value bar.
RangeLinearGauge
The RangeLinearGauge class enables you to customize the ruler appearance in the LinearGauge. You can display multiple ranges by providing a list of RangeLinearGauge values, and customize the color, start, and end values to match your requirements.
CustomCurve
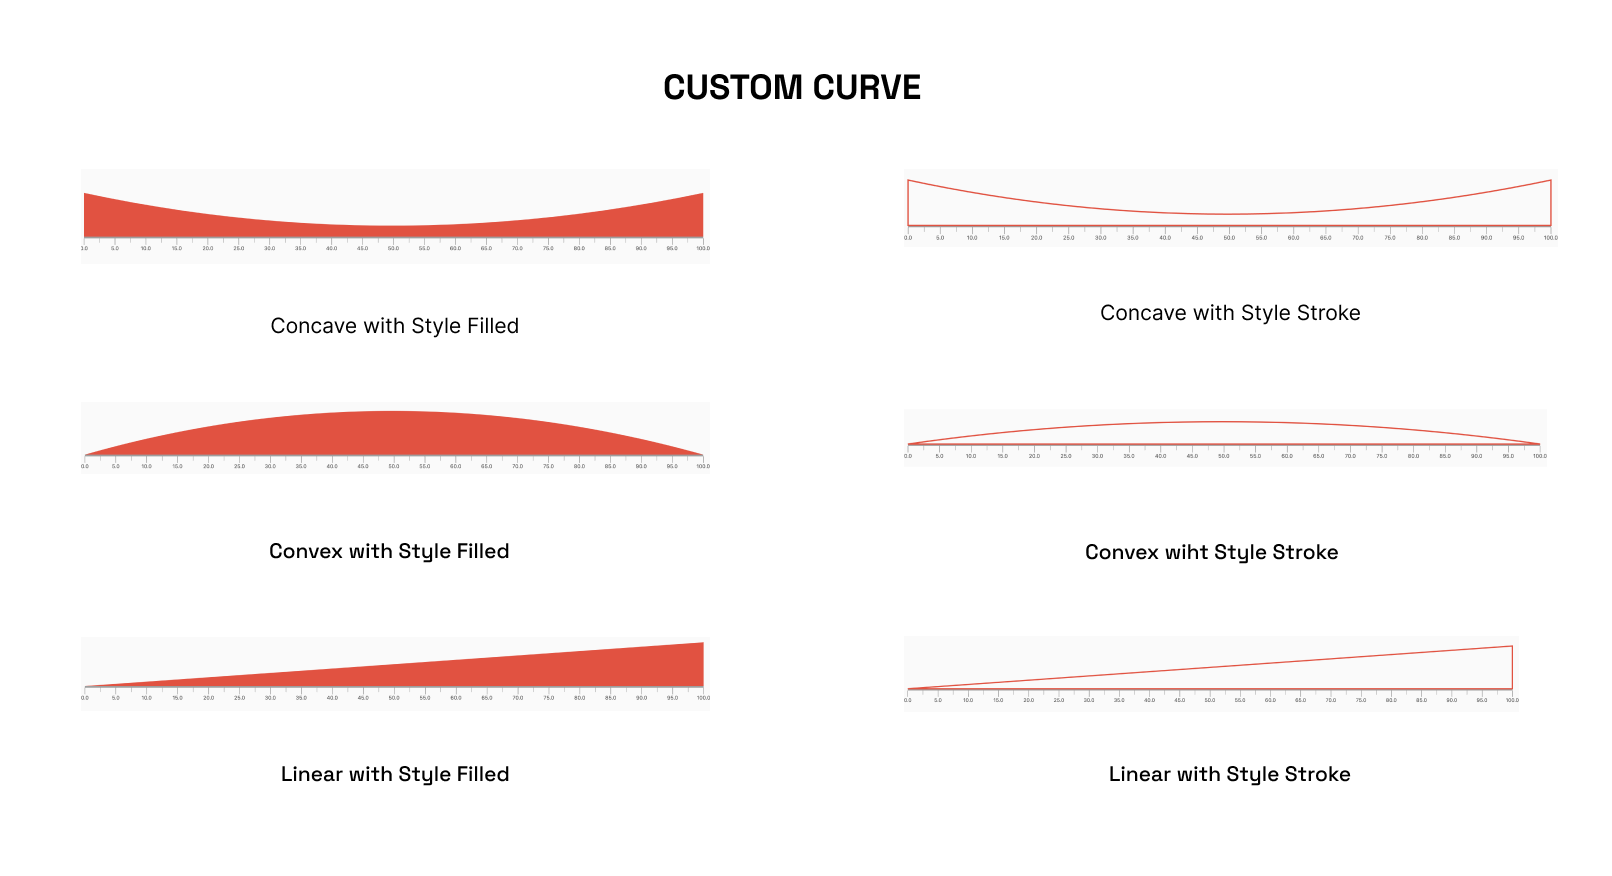
The CustomCurve class allows you to draw Bezier and Straight curves on the LinearGauge, providing a high degree of customization for visualizing data.
Animations
The LinearGauge class includes pre-made animations that can be applied to its pointers, value bars, or the gauge's overall visibility. These animations can help to make the gauge more visually engaging and dynamic.
Interactivity
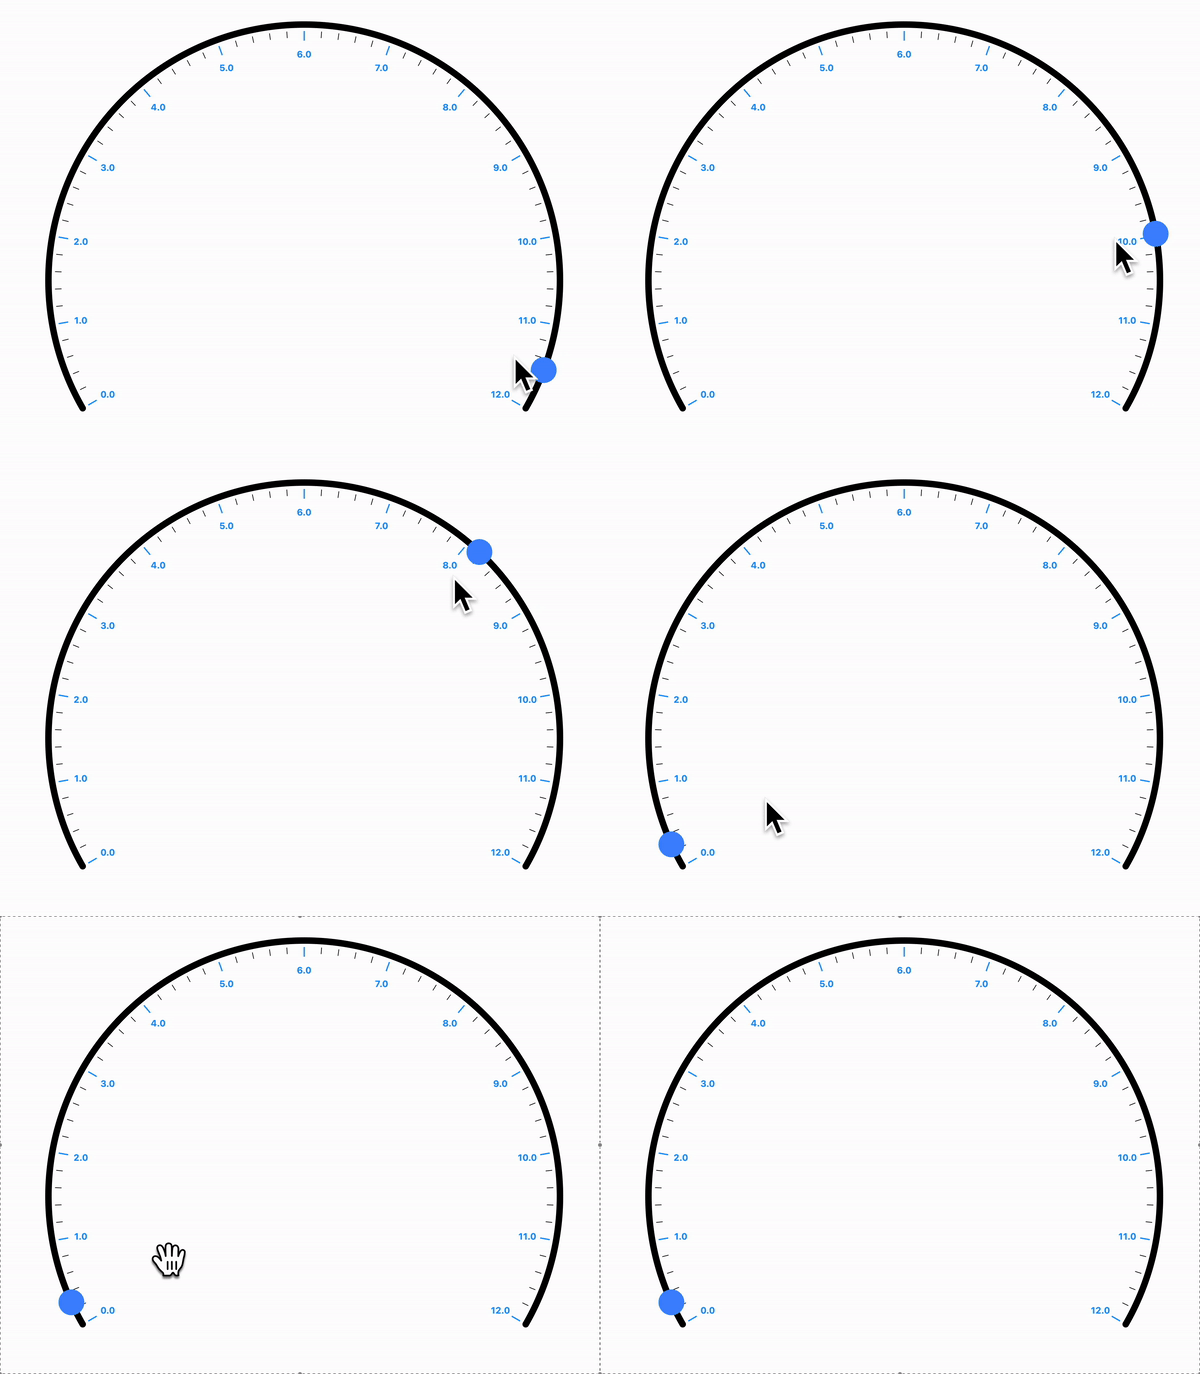
The Pointer is interactive , it responds to user horizontal & vertical drag.
Radial Gauge
A Radial Gauge is a graphical representation used to visualize and display a value within a circular format. It consists of several components, including a radial track, a needle pointer, and a value bar. The radial track represents the range or scale of values that the gauge can display, with the ability for users to set the start and end points of the track.
Position:
Angles
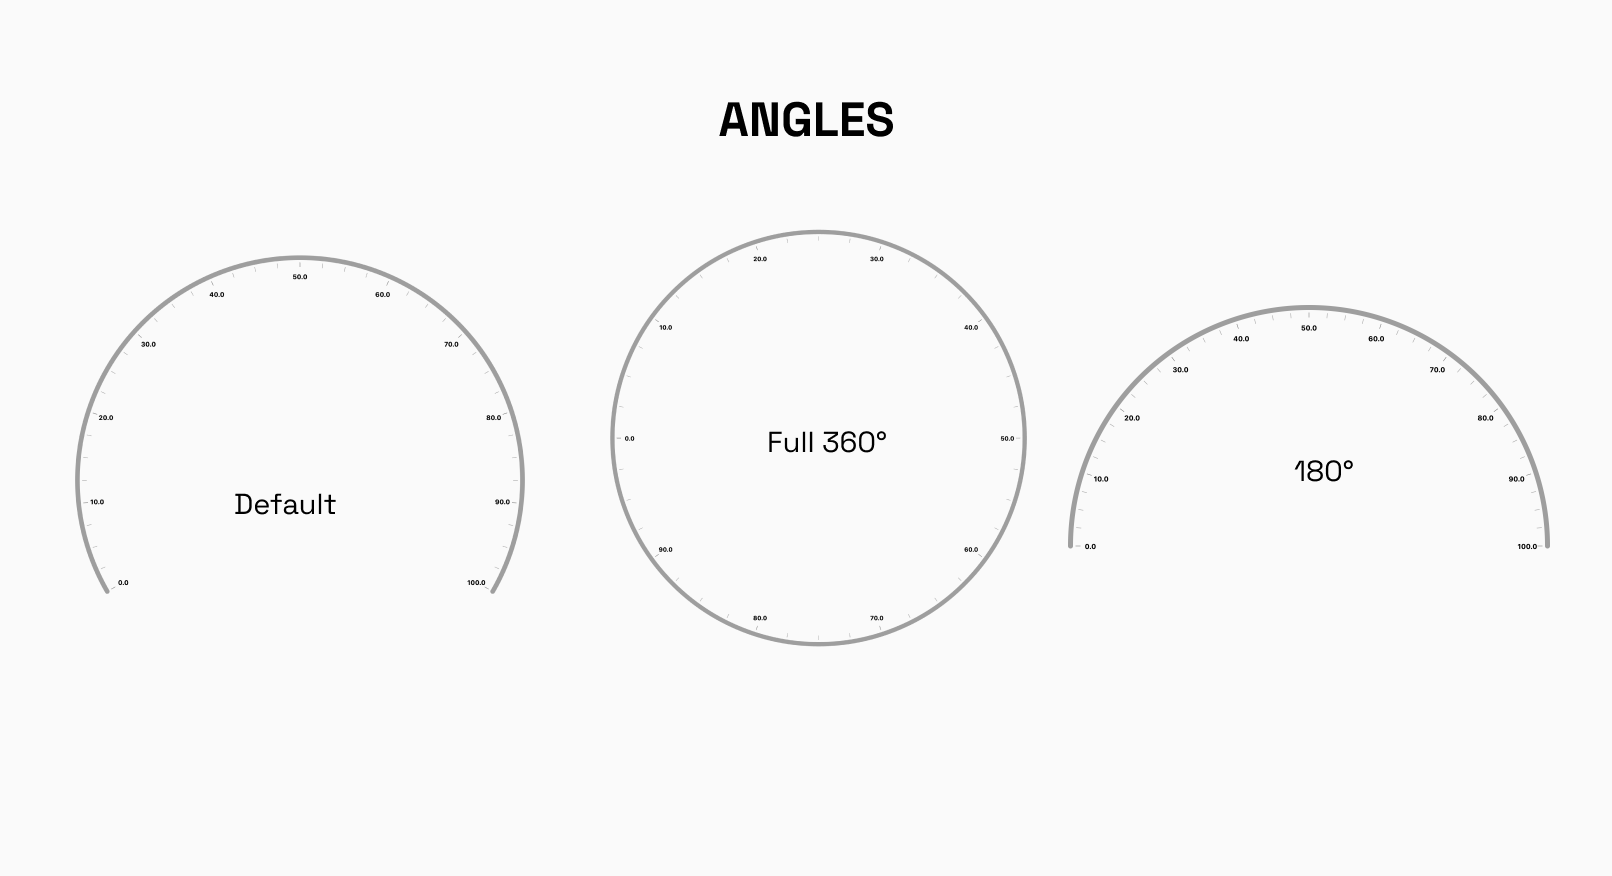
The RadialGauge can be easily laid out at different angles around its center. You have the freedom to specify the starting and ending angles, defining the arc over which the gauge will be displayed. This feature is particularly useful when you want to display multiple gauges side by side or need to emphasize a specific range on the gauge.
Default startAngle : -30°
Default endAngle`: 210°
Custom Track Labels
The labels displayed on the RadialGauge track can easily be formated to your need.
Radii Customization
radiusFactor can be used to size the adjust the scaling factor of the radius and change the radius of the gauge accordingly.
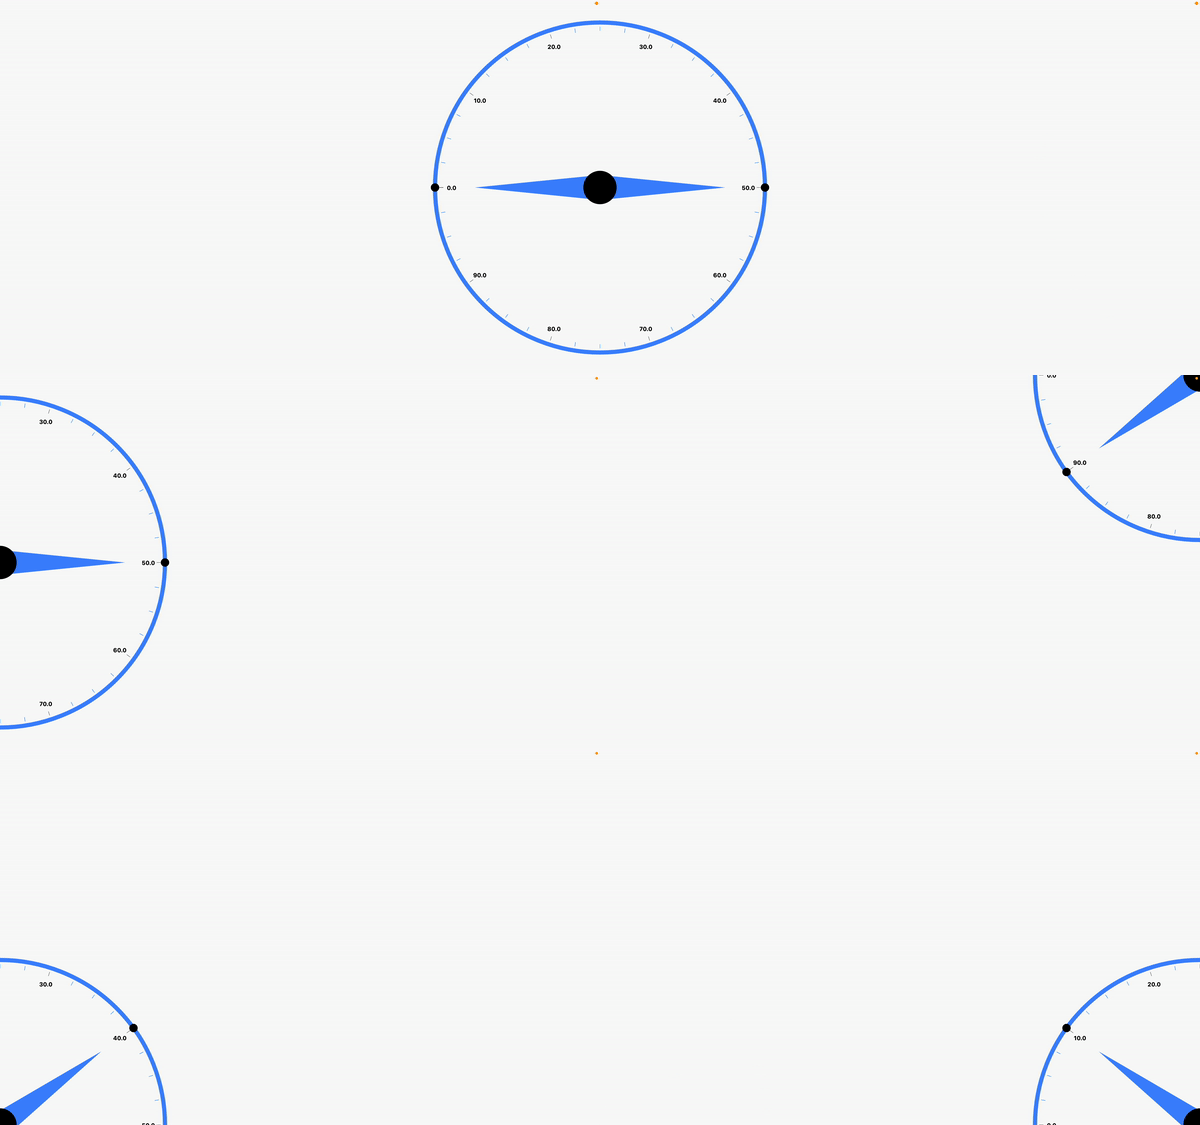
X and Y Coordinates
To precisely position the RadialGauge on your canvas or user interface, you can set the x and y coordinates of its center. This way, you can easily integrate the gauge into your existing layout or place it at specific locations as per your application's design requirements.
By combining these layout options, you can create stunning and interactive radial gauges that effectively present data to your users, whether it's for monitoring, analytics, or any other visualization needs.
Default xCoordinate : 0.5
Default yCoordinate`: 0.5
Needle Pointer
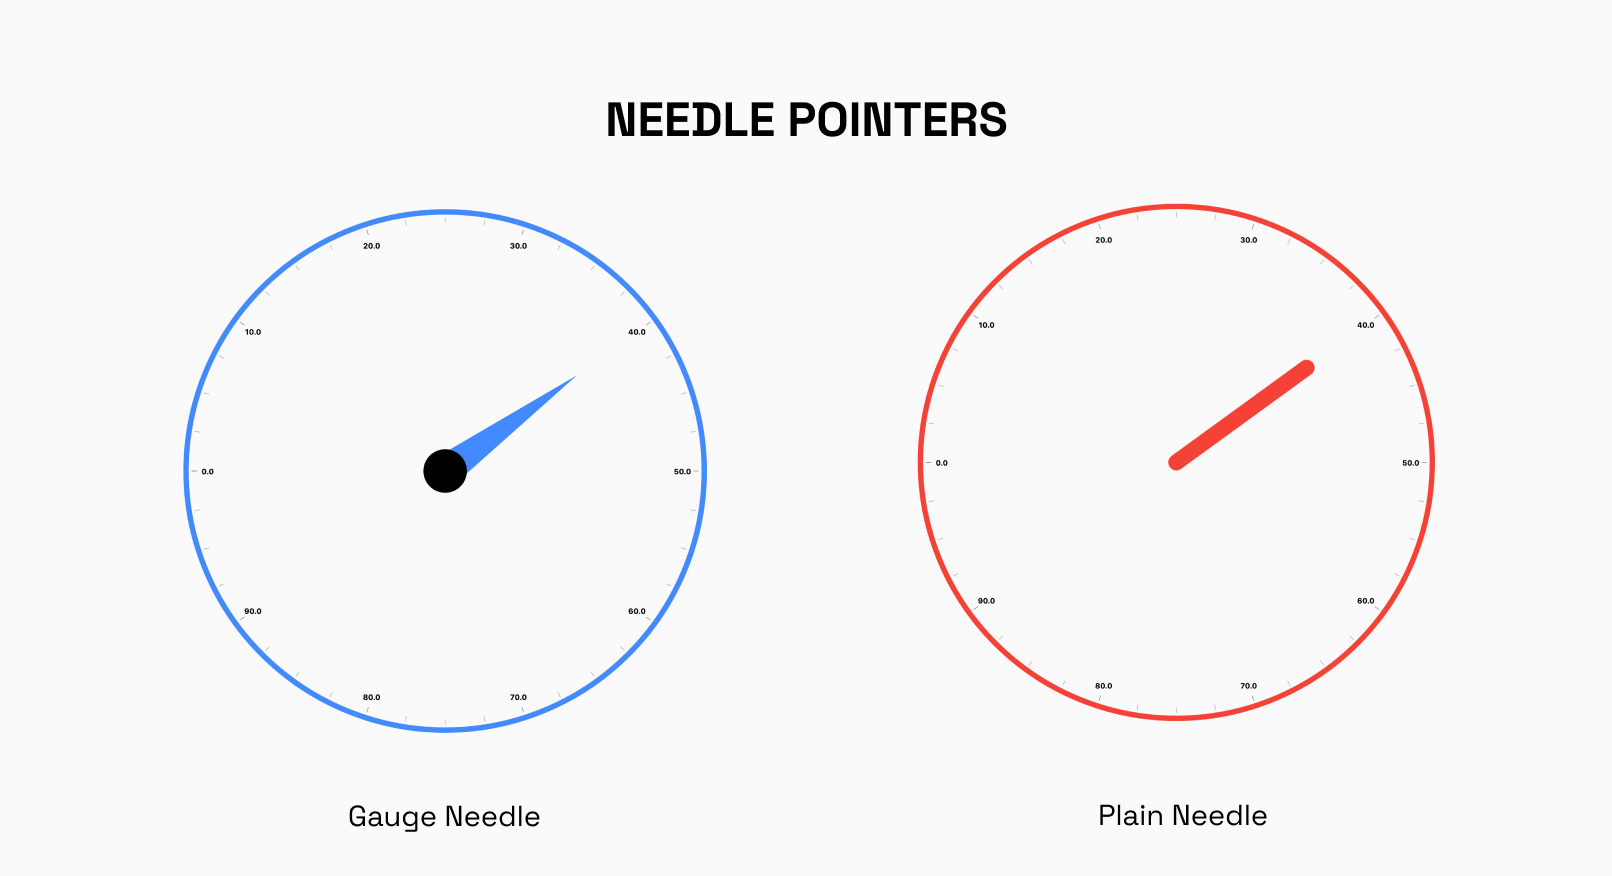
The NeedlePointer is a powerful component that enables you to create and customize Needle Pointers for your gauges. With this widget, you have the flexibility to design multiple Needle Pointers and adjust their styles using the gaugeNeedle and plainneedle enums.
Shape Pointer
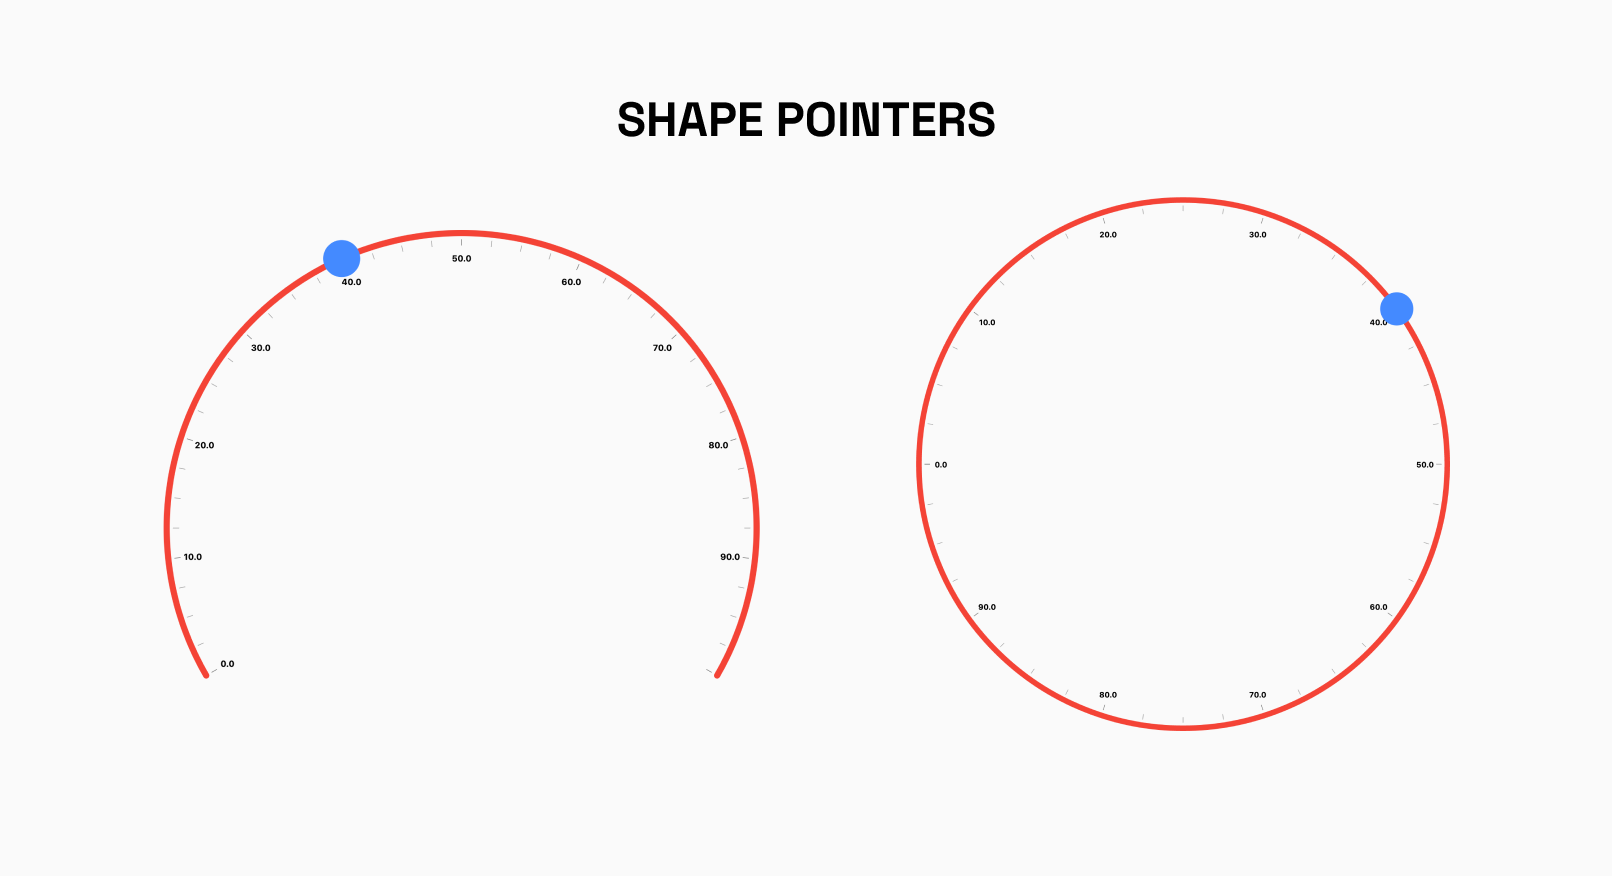
The RadialShapePointer allows you to add Shape Pointer to your Gauge.The shape can be customized using properties such as color, width and height.
Currently, Only Circle Shape is supported
Radial Value Bar
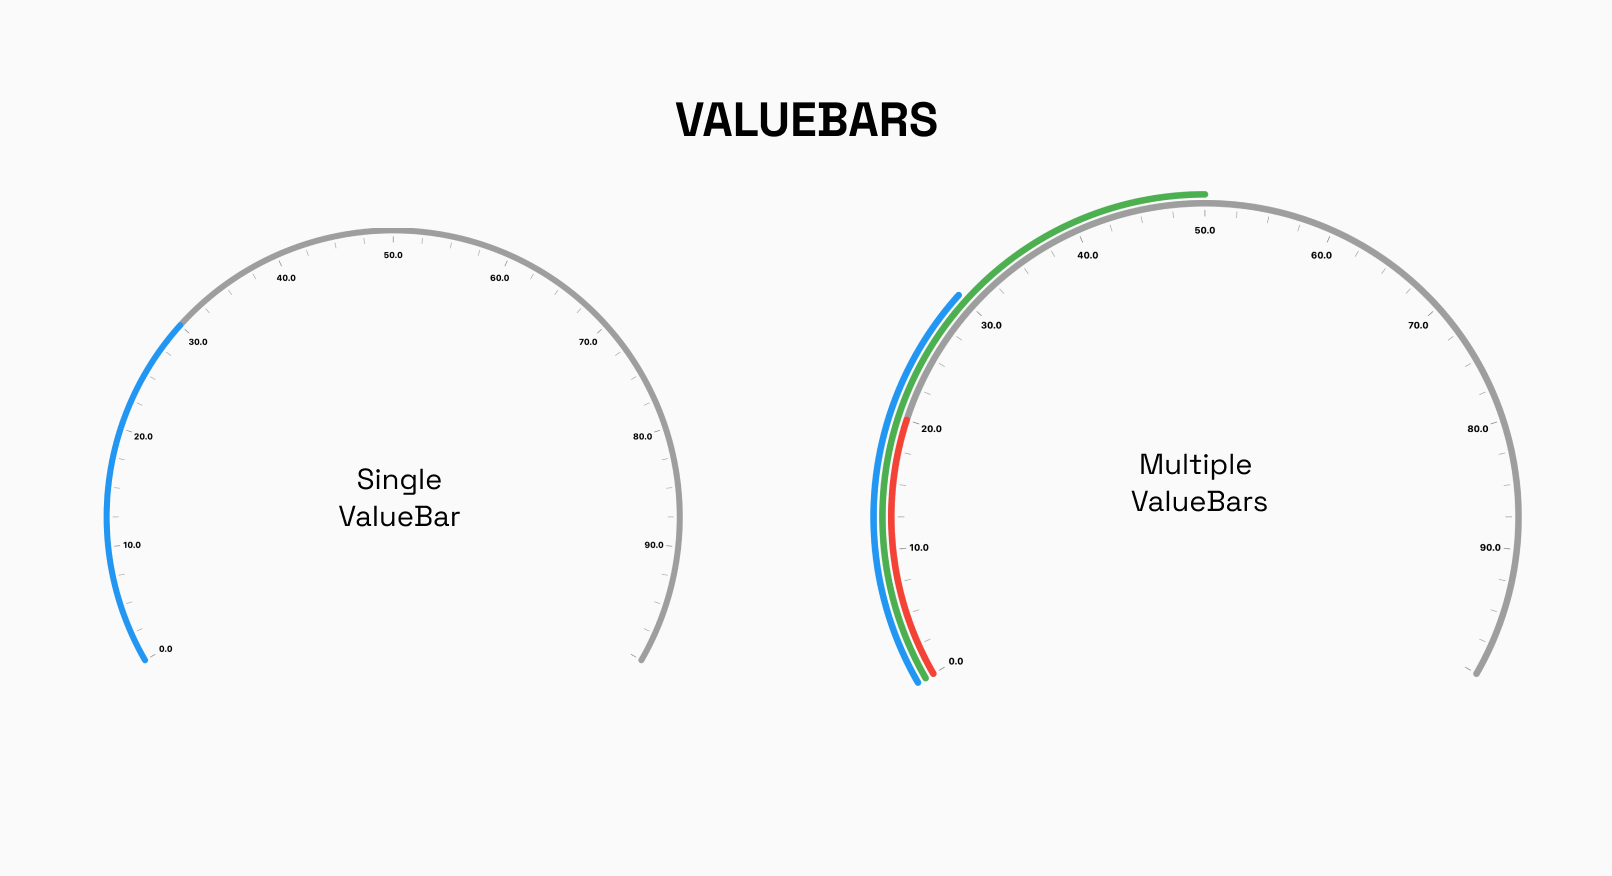
The RadialValueBar is a crucial component used within the RadialGauge to visually represent a specific value on the gauge using a bar. This bar provides users with a clear and intuitive indication of the current value within the defined range of the radial track.
Interactivity Radial
In the Radial Gauge, the NeedlePointer and RadialShapePointer can be set to interactive, making them respond to user's horizontal and vertical drag.