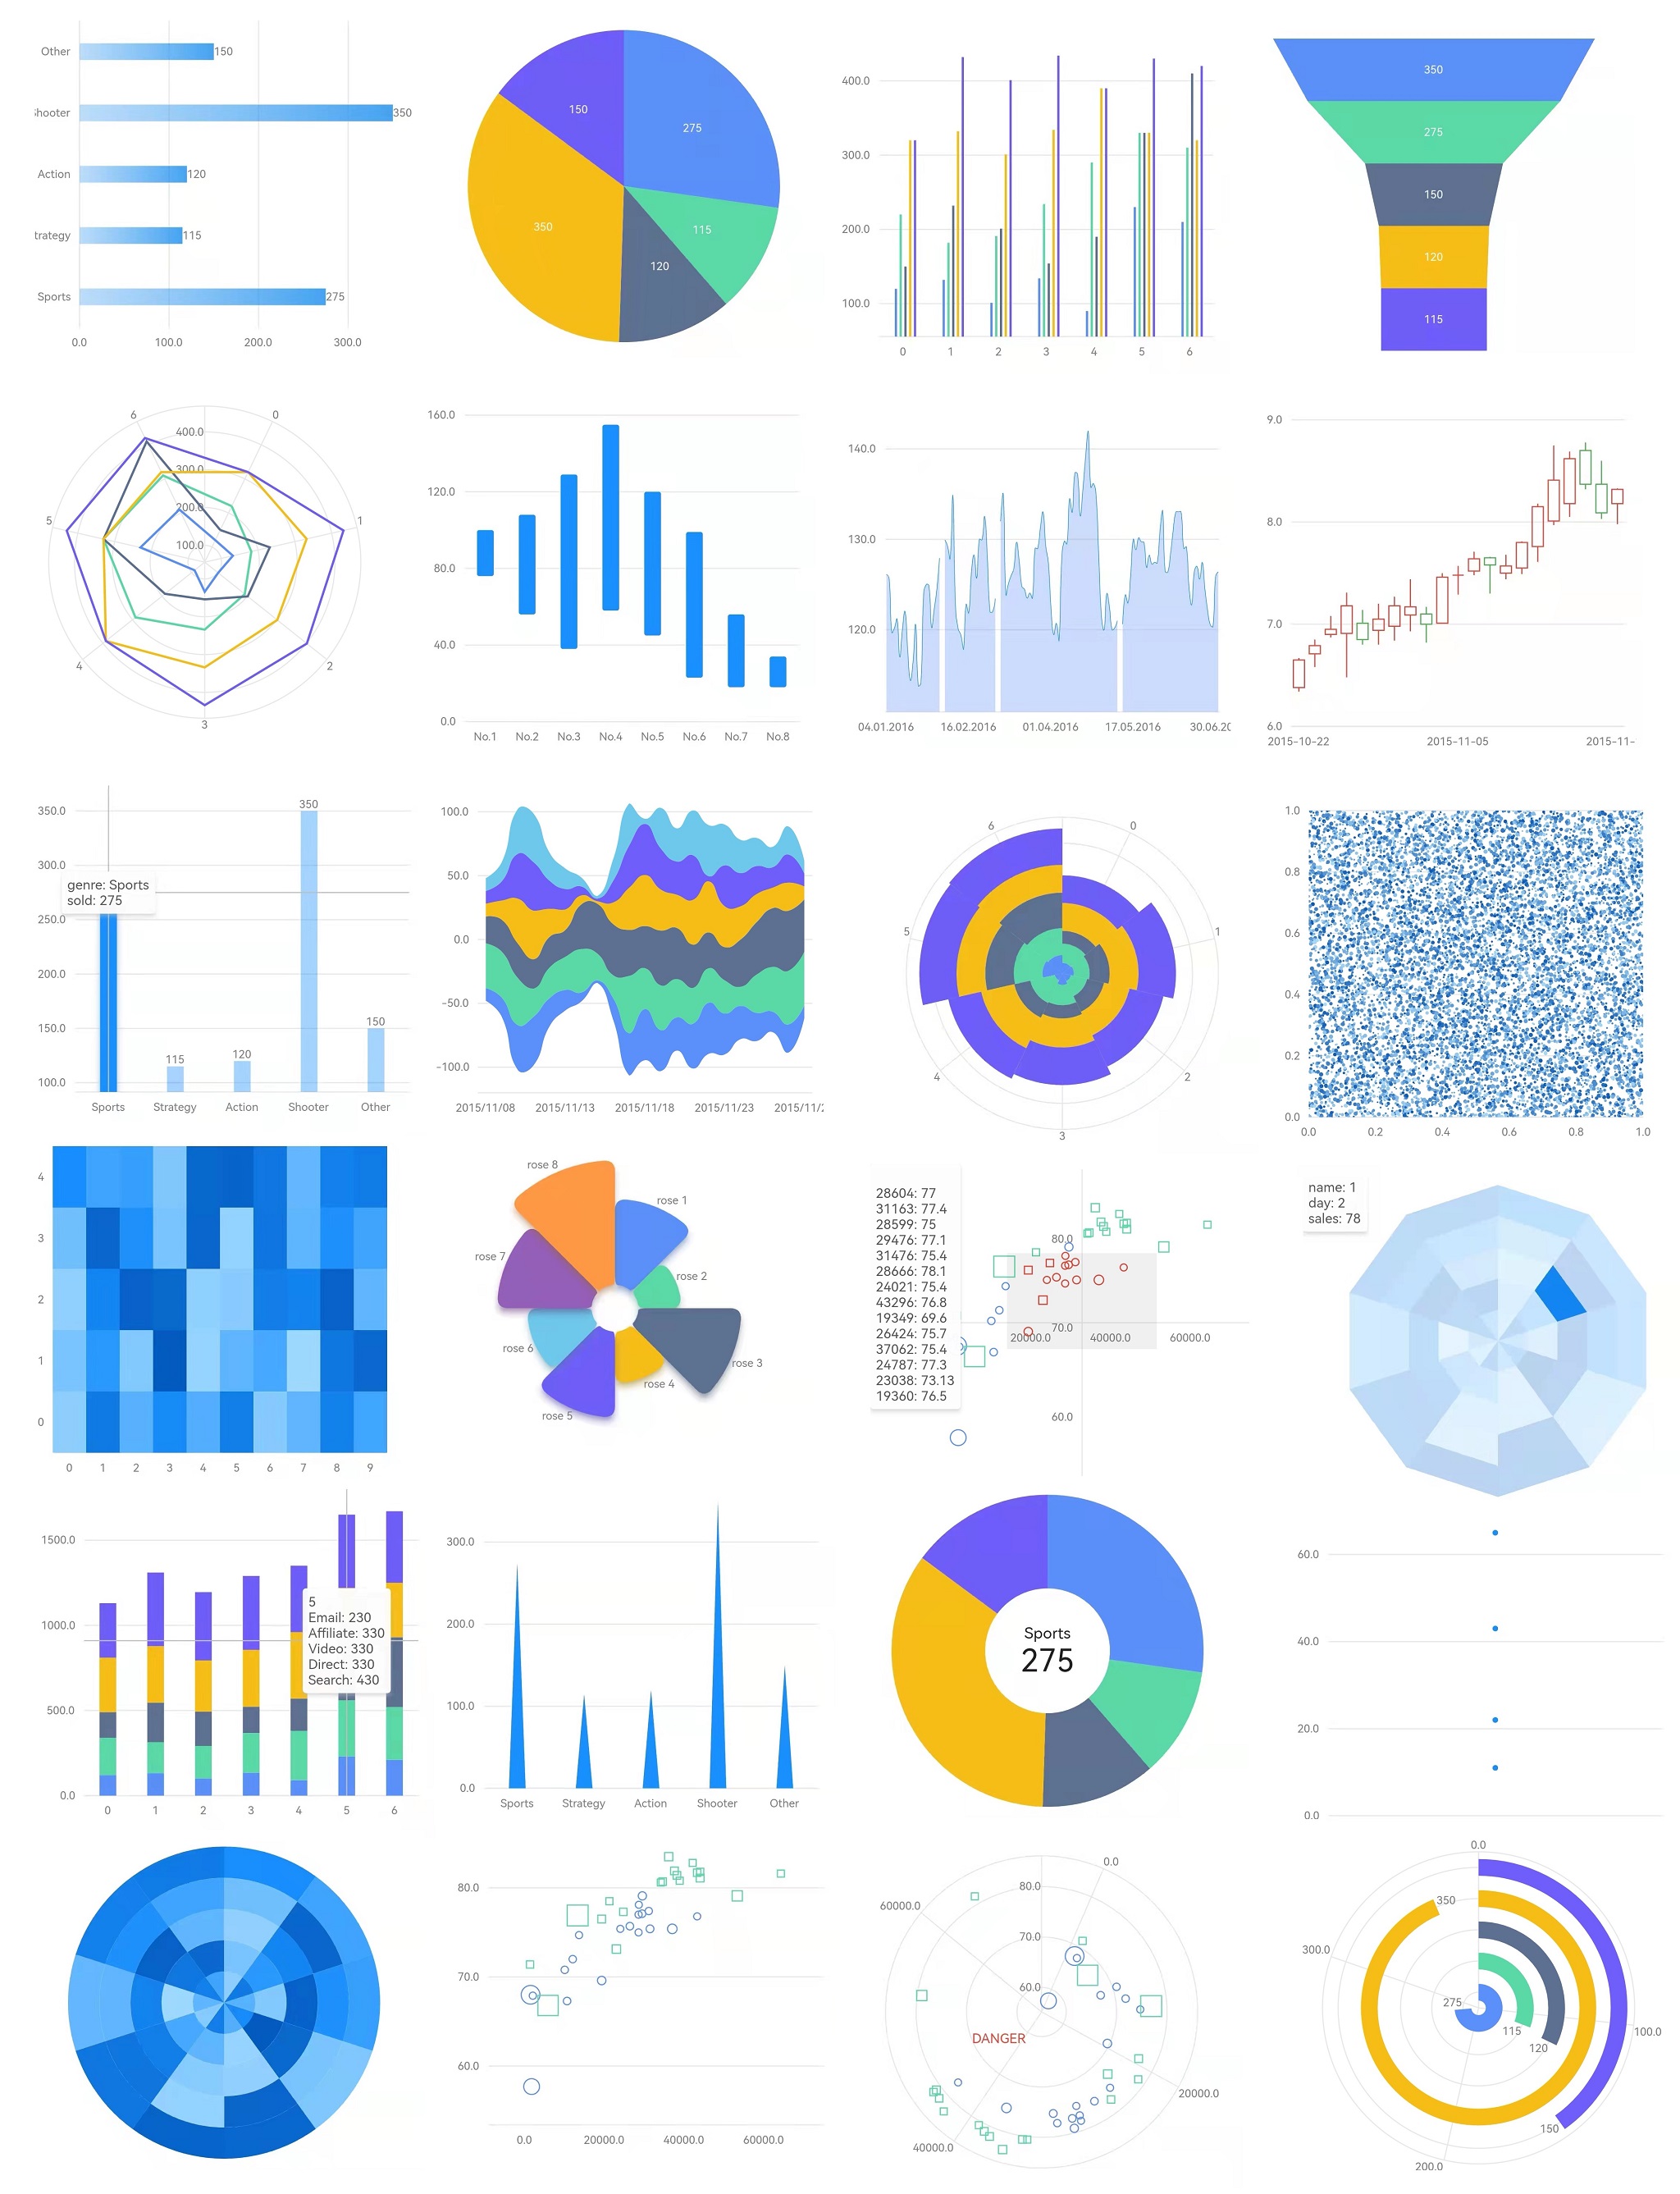
Graphic 是一个 Flutter 图表库,提供数据可视化的语法,使开发者能够以声明式方法创建表达性强且可自定义的图表。该库设计灵活且性能出色,支持 Android、iOS、Web、macOS、Windows 和 Linux 等多个平台。该库强调组件组合性和直观的语法,使开发者可以轻松地从简单构建块创建复杂的可视化效果。它可无缝集成到 Flutter 应用中,并提供丰富的样式和交互配置选项。
适合场景
创建交互式仪表板
可视化时间序列数据
构建自定义的数据驱动 UI
使用图表生成报告
实时数据可视化
主要特点
声明式图表语法
跨平台支持
高度可定制的组件
内置动画支持
可扩展的设计系统
适合对象
数据可视化开发者
Flutter 应用开发者
分析仪表板构建器
教育类应用开发者
与数据一起工作的UI设计师
使用建议
需要了解数据可视化原理
初学者的学习曲线更陡峭
与成熟库相比,文档有限
使用大数据集时,性能可能有所不同
自定义样式需要熟悉 Flutter 的 widget 系统
原始 README
以下为关联源码仓库的 README 原文快照,最新内容请访问源码仓库。
Graphic
Graphic is a grammar of data visualization and Flutter charting library.
Flexible declarative grammar: This visualization grammar derives from Leland Wilkinson's The Grammar of Graphics, and tries to balance between theoretical beauty and practicability. Data processing steps and mark shapes can be composed freely in a declarative specification, not limited to certain chart types. And shape draw methods are customizable.
Interaction: With the event and selection definition, the chart is highly interactive, such as highlighting selected items, popping a tooltip, or scaling the coordinate.
Animation: Mark transition animation can be set when a chart is built or changed. The entrance animation has various forms.
Skill for AI coding
Add the following skill, and your coding agent will be an expert of charting with this library: